Why Is My Portfolio Underperforming the S&P 500? [2026]
Key Takeaways
- A four-ETF portfolio (VTI, VXUS, BND, VNQ) returned 153.28% over ten years while SPY returned 300.56%, a gap of $14,728 on a $10,000 start.
- Most of that gap is explained by beta 0.74. The portfolio was built to capture roughly three-quarters of the market's movement, in both directions.
- Diversification did work. Average correlation across the four holdings was ~0.35, and bonds ran at -0.16 against US equity over the full period.
- It worked least when it mattered most. In Q3 2022, US and international equity correlated at 0.89 and REITs at 0.82.
- Lower volatility was real (13.74% vs 17.93%) but not free. The portfolio's Sharpe ratio was 0.75 against SPY's 0.87, so each unit of risk bought less return.
- Not every holding earned its seat. BND contributed +0.81% alpha; VNQ subtracted -5.92% while carrying more volatility than the S&P 500 itself.
This article is educational and based on historical data. It is not investment advice, and past performance does not predict future results.
The question, and the number behind it
Every few months the same post appears in investing forums, worded a little differently each time. The index just hit a record. The headlines say the market is up. The account balance says something else. Something must be broken.
Usually nothing is broken. The distance between a diversified portfolio and the S&P 500 is a measurable quantity, and once you measure it, it stops being a mystery and starts being a decision you already made.
Here is what that distance looks like. A globally diversified four-fund portfolio, ten years, $10,000 in at the start: $25,328. The same $10,000 in SPY: $40,056.
That's a gap of $14,728 on a starting balance of ten thousand dollars. Big enough to make anyone wonder what went wrong. The rest of this article is the answer, and it comes in three parts.
The portfolio I tested
Four funds, the shape most people arrive at after reading a few Boglehead threads:
| Asset | Weight | Fund |
|---|---|---|
| VTI | 45% | Vanguard Total Stock Market |
| VXUS | 25% | Vanguard Total International Stock |
| BND | 20% | Vanguard Total Bond Market |
| VNQ | 10% | Vanguard Real Estate |
Rebalanced annually, benchmarked against SPY, tested from July 2016 to July 2026 on daily data. That's 2,513 observations rather than 120 monthly ones, which matters for the drawdown and correlation figures later.
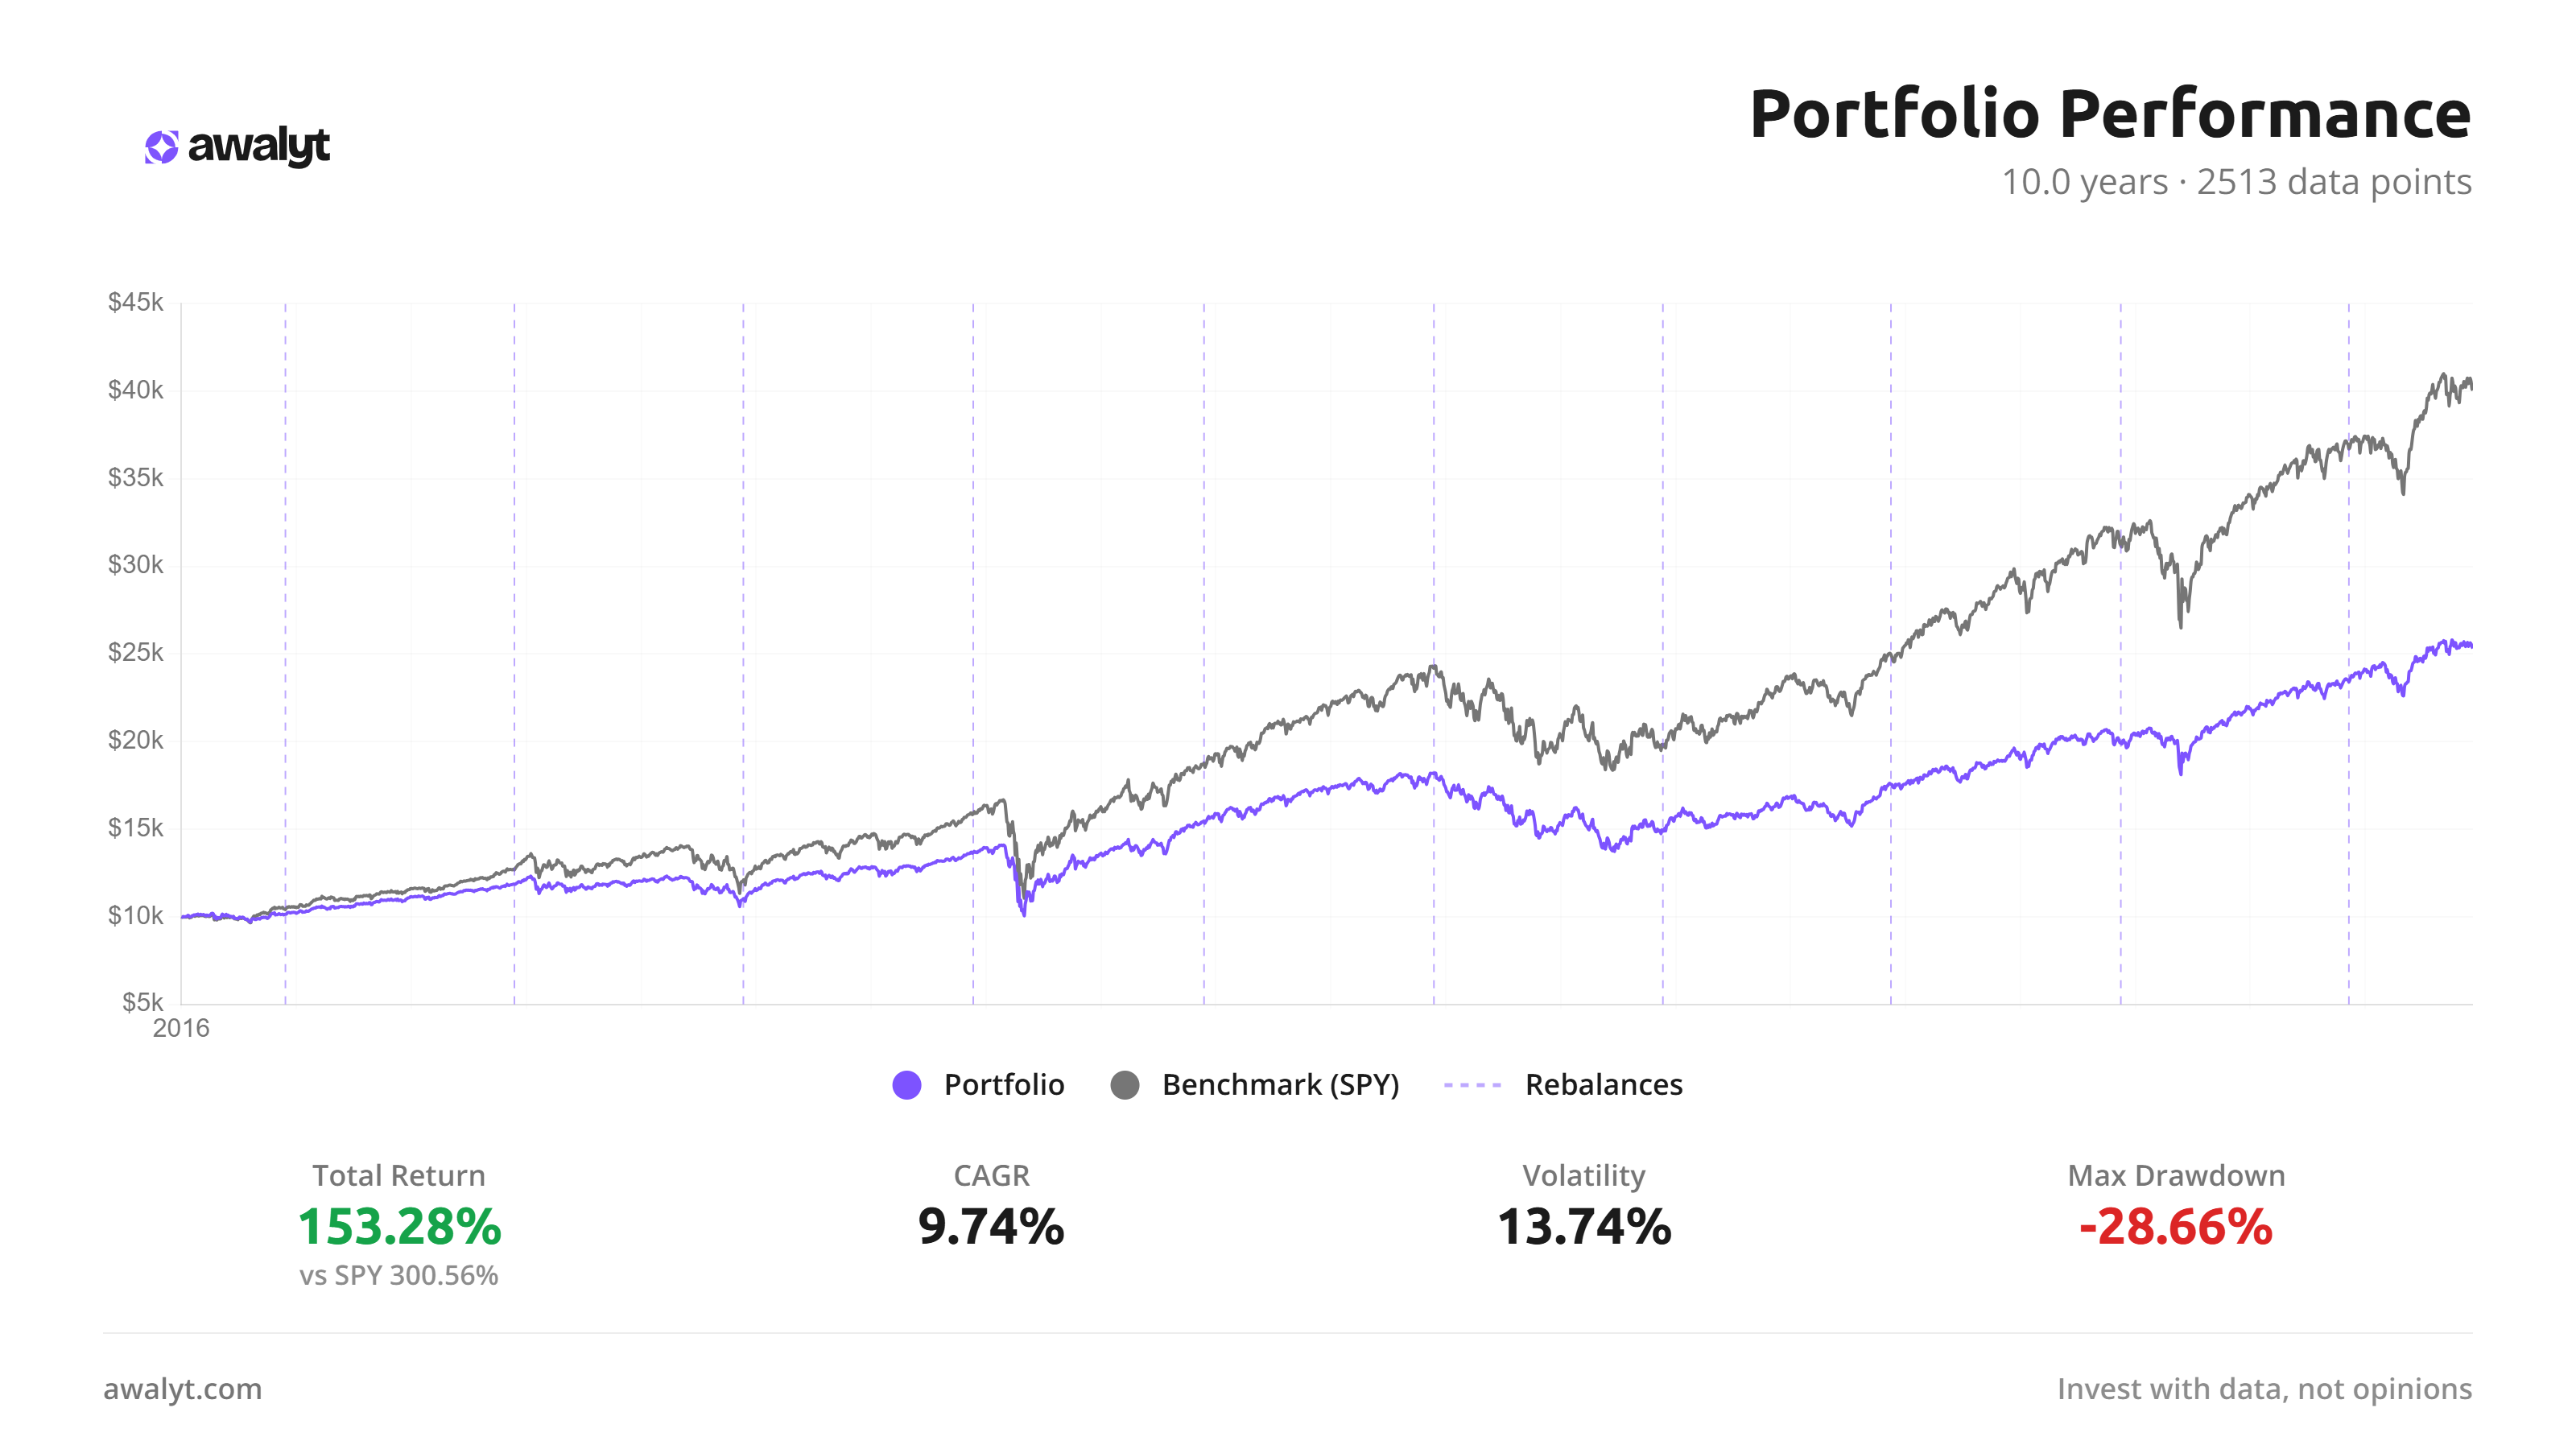
The two lines separate early and never reconverge. No single event caused the gap; it accumulated.
Reason one: your portfolio has a beta, and it isn't 1
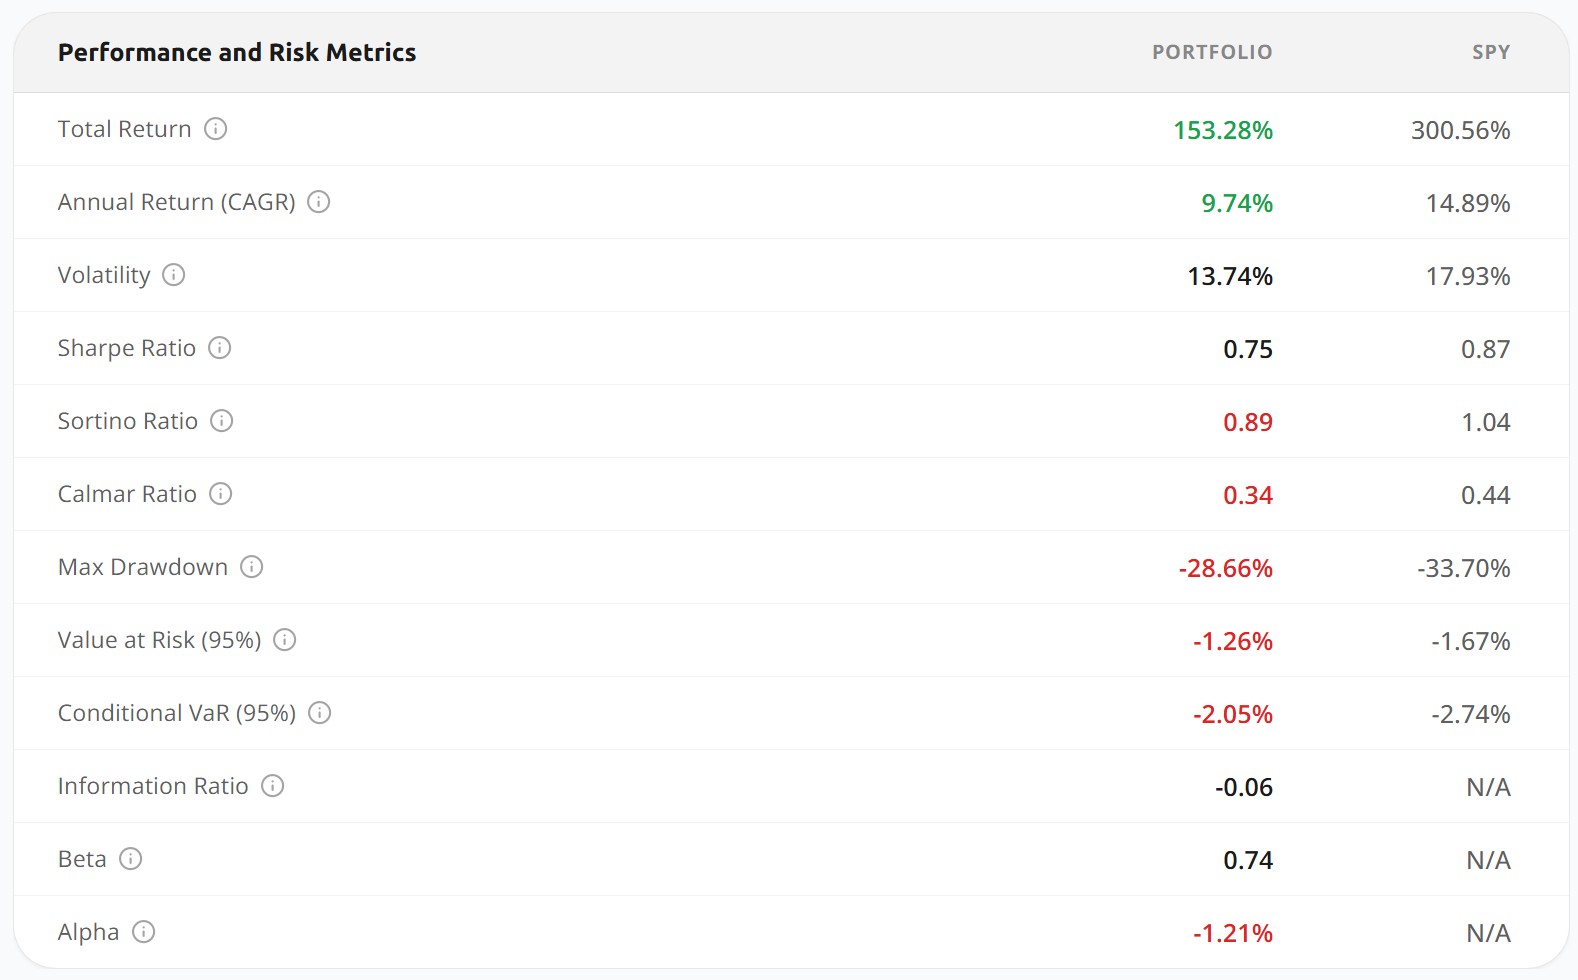
Here is the full comparison.
| Metric | Portfolio | SPY |
|---|---|---|
| Total return | 153.28% | 300.56% |
| CAGR | 9.74% | 14.89% |
| Volatility | 13.74% | 17.93% |
| Beta | 0.74 | — |
| Alpha | -1.21% | — |
Beta 0.74. That one number does most of the explaining. In a year when the market gains 20%, a portfolio with this beta is structurally positioned to gain about 15%. Not because anything failed, but because that is what a 20% bond and real-estate allocation does to your exposure.
The same number runs the other way, which is the part people forget when they're comparing themselves to the index. Max drawdown of -28.66% against SPY's -33.70%. Volatility a quarter lower. Value at Risk at -1.26% against -1.67%. You bought a smaller ride and you got one.
The year-by-year returns show the shape of it:
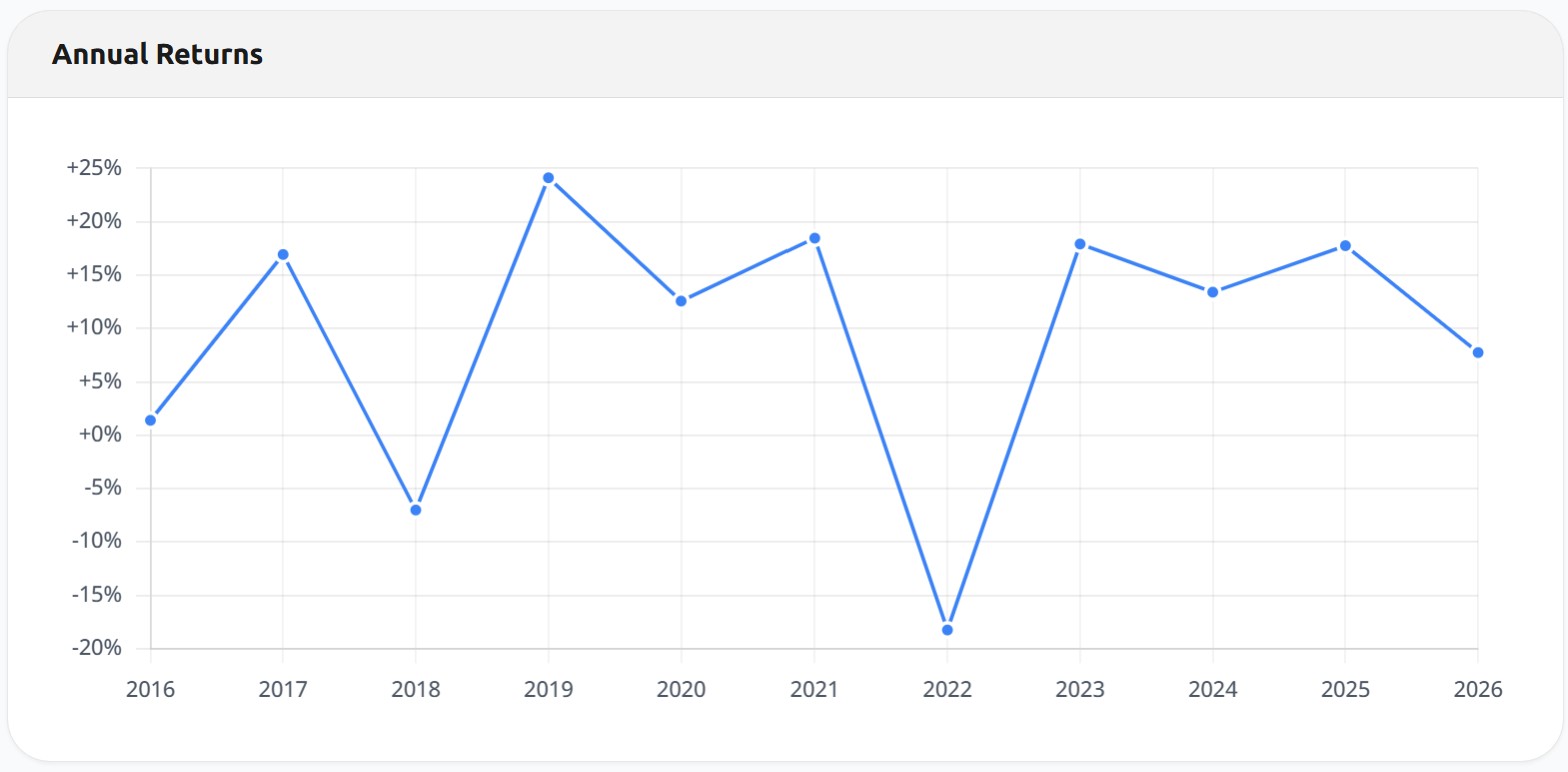
Two negative years in ten. About -7% in 2018 and about -18% in 2022. Everything else positive, with 2019 near +24% and 2021, 2023 and 2025 all clustered in the high teens. Solid years. Just consistently a few points behind an index that was compounding at nearly 15%.
Then there's alpha at -1.21%, and this is the part worth pausing on. Beta explains the return you gave up by design. Alpha is the return you gave up beyond that, after accounting for the risk you actually took. Roughly a percentage point a year of unexplained shortfall. That number isn't a choice. It's the one that deserves investigating, and we'll get to what caused it.
You can run this comparison on your own holdings in the backtesting tool. Beta and alpha against any benchmark come back with the results.
Reason two: you own four things that don't move together
This is the mechanism people miss, and it's the one that makes the underperformance make sense rather than just hurt.
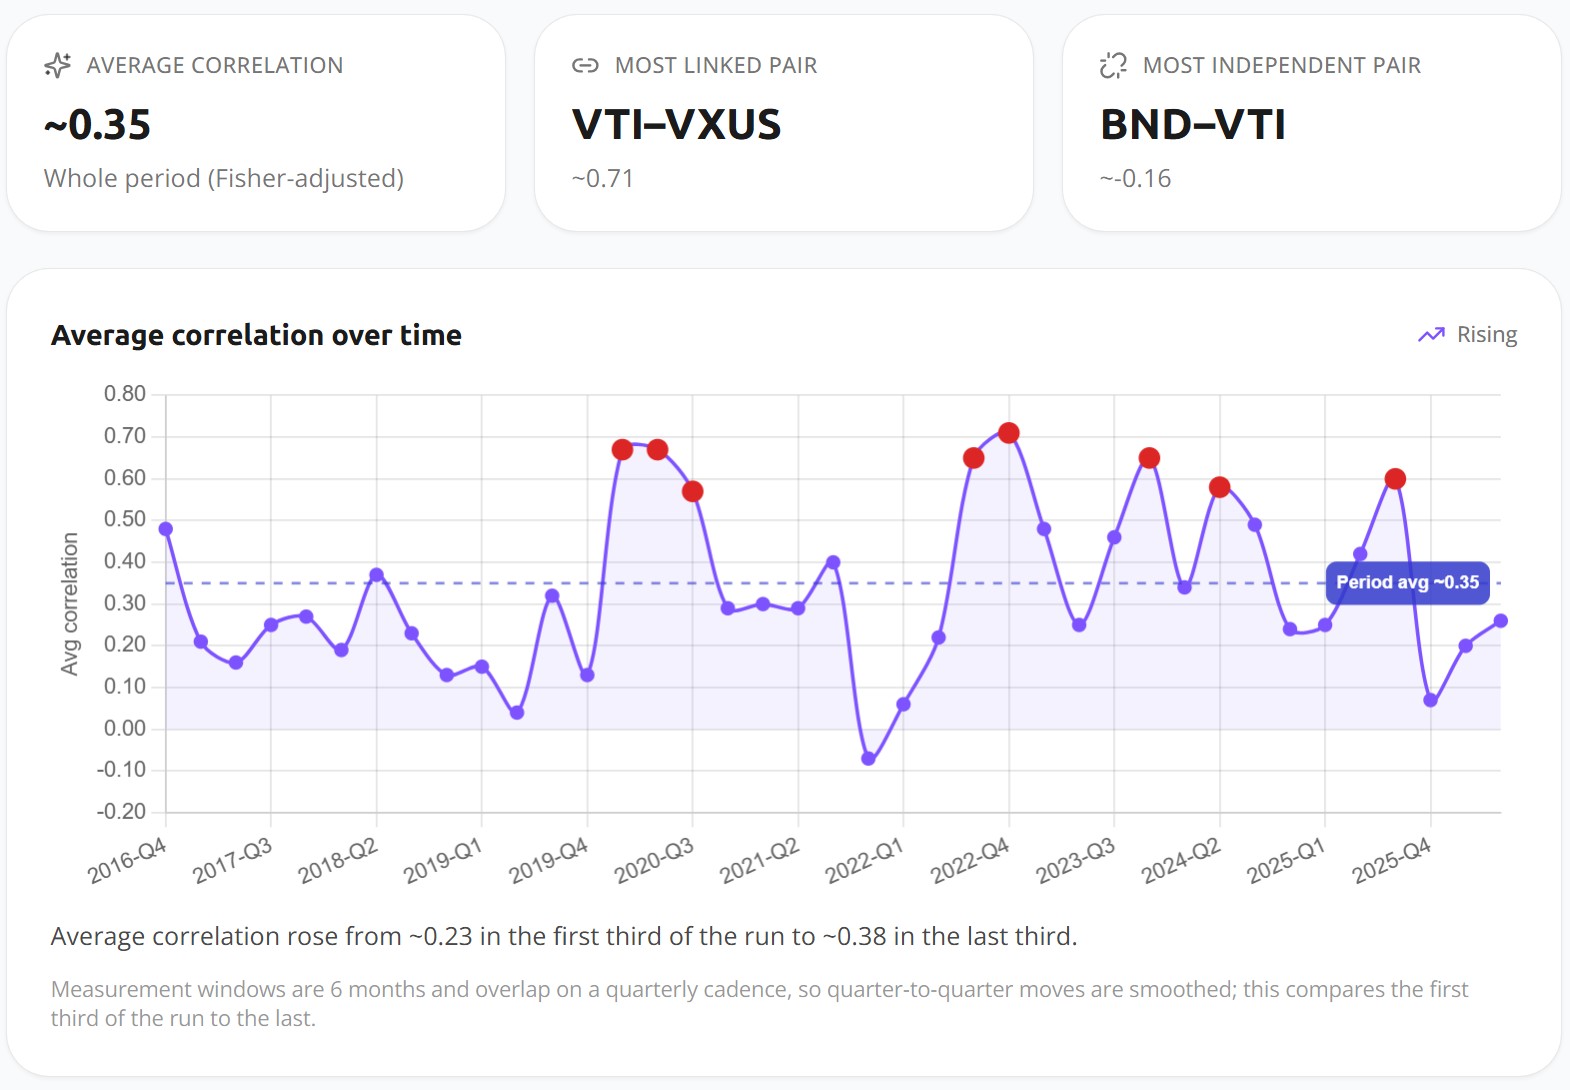
Average correlation across the four holdings: ~0.35 over the full ten years. The most connected pair, VTI and VXUS, sat at ~0.71. The most independent, bonds against US equity, at ~-0.16.
Read that as a report card and the portfolio passes. The holdings were genuinely independent of each other. That is what diversification is supposed to look like.
And it is exactly why you trailed.
You cannot hold assets that are uncorrelated with the thing that went up and expect to go up as much as it did. Those are the same statement. The $14,728 is not evidence of a mistake; it's the invoice for a property you deliberately bought.
The individual holdings show where the drag came from:
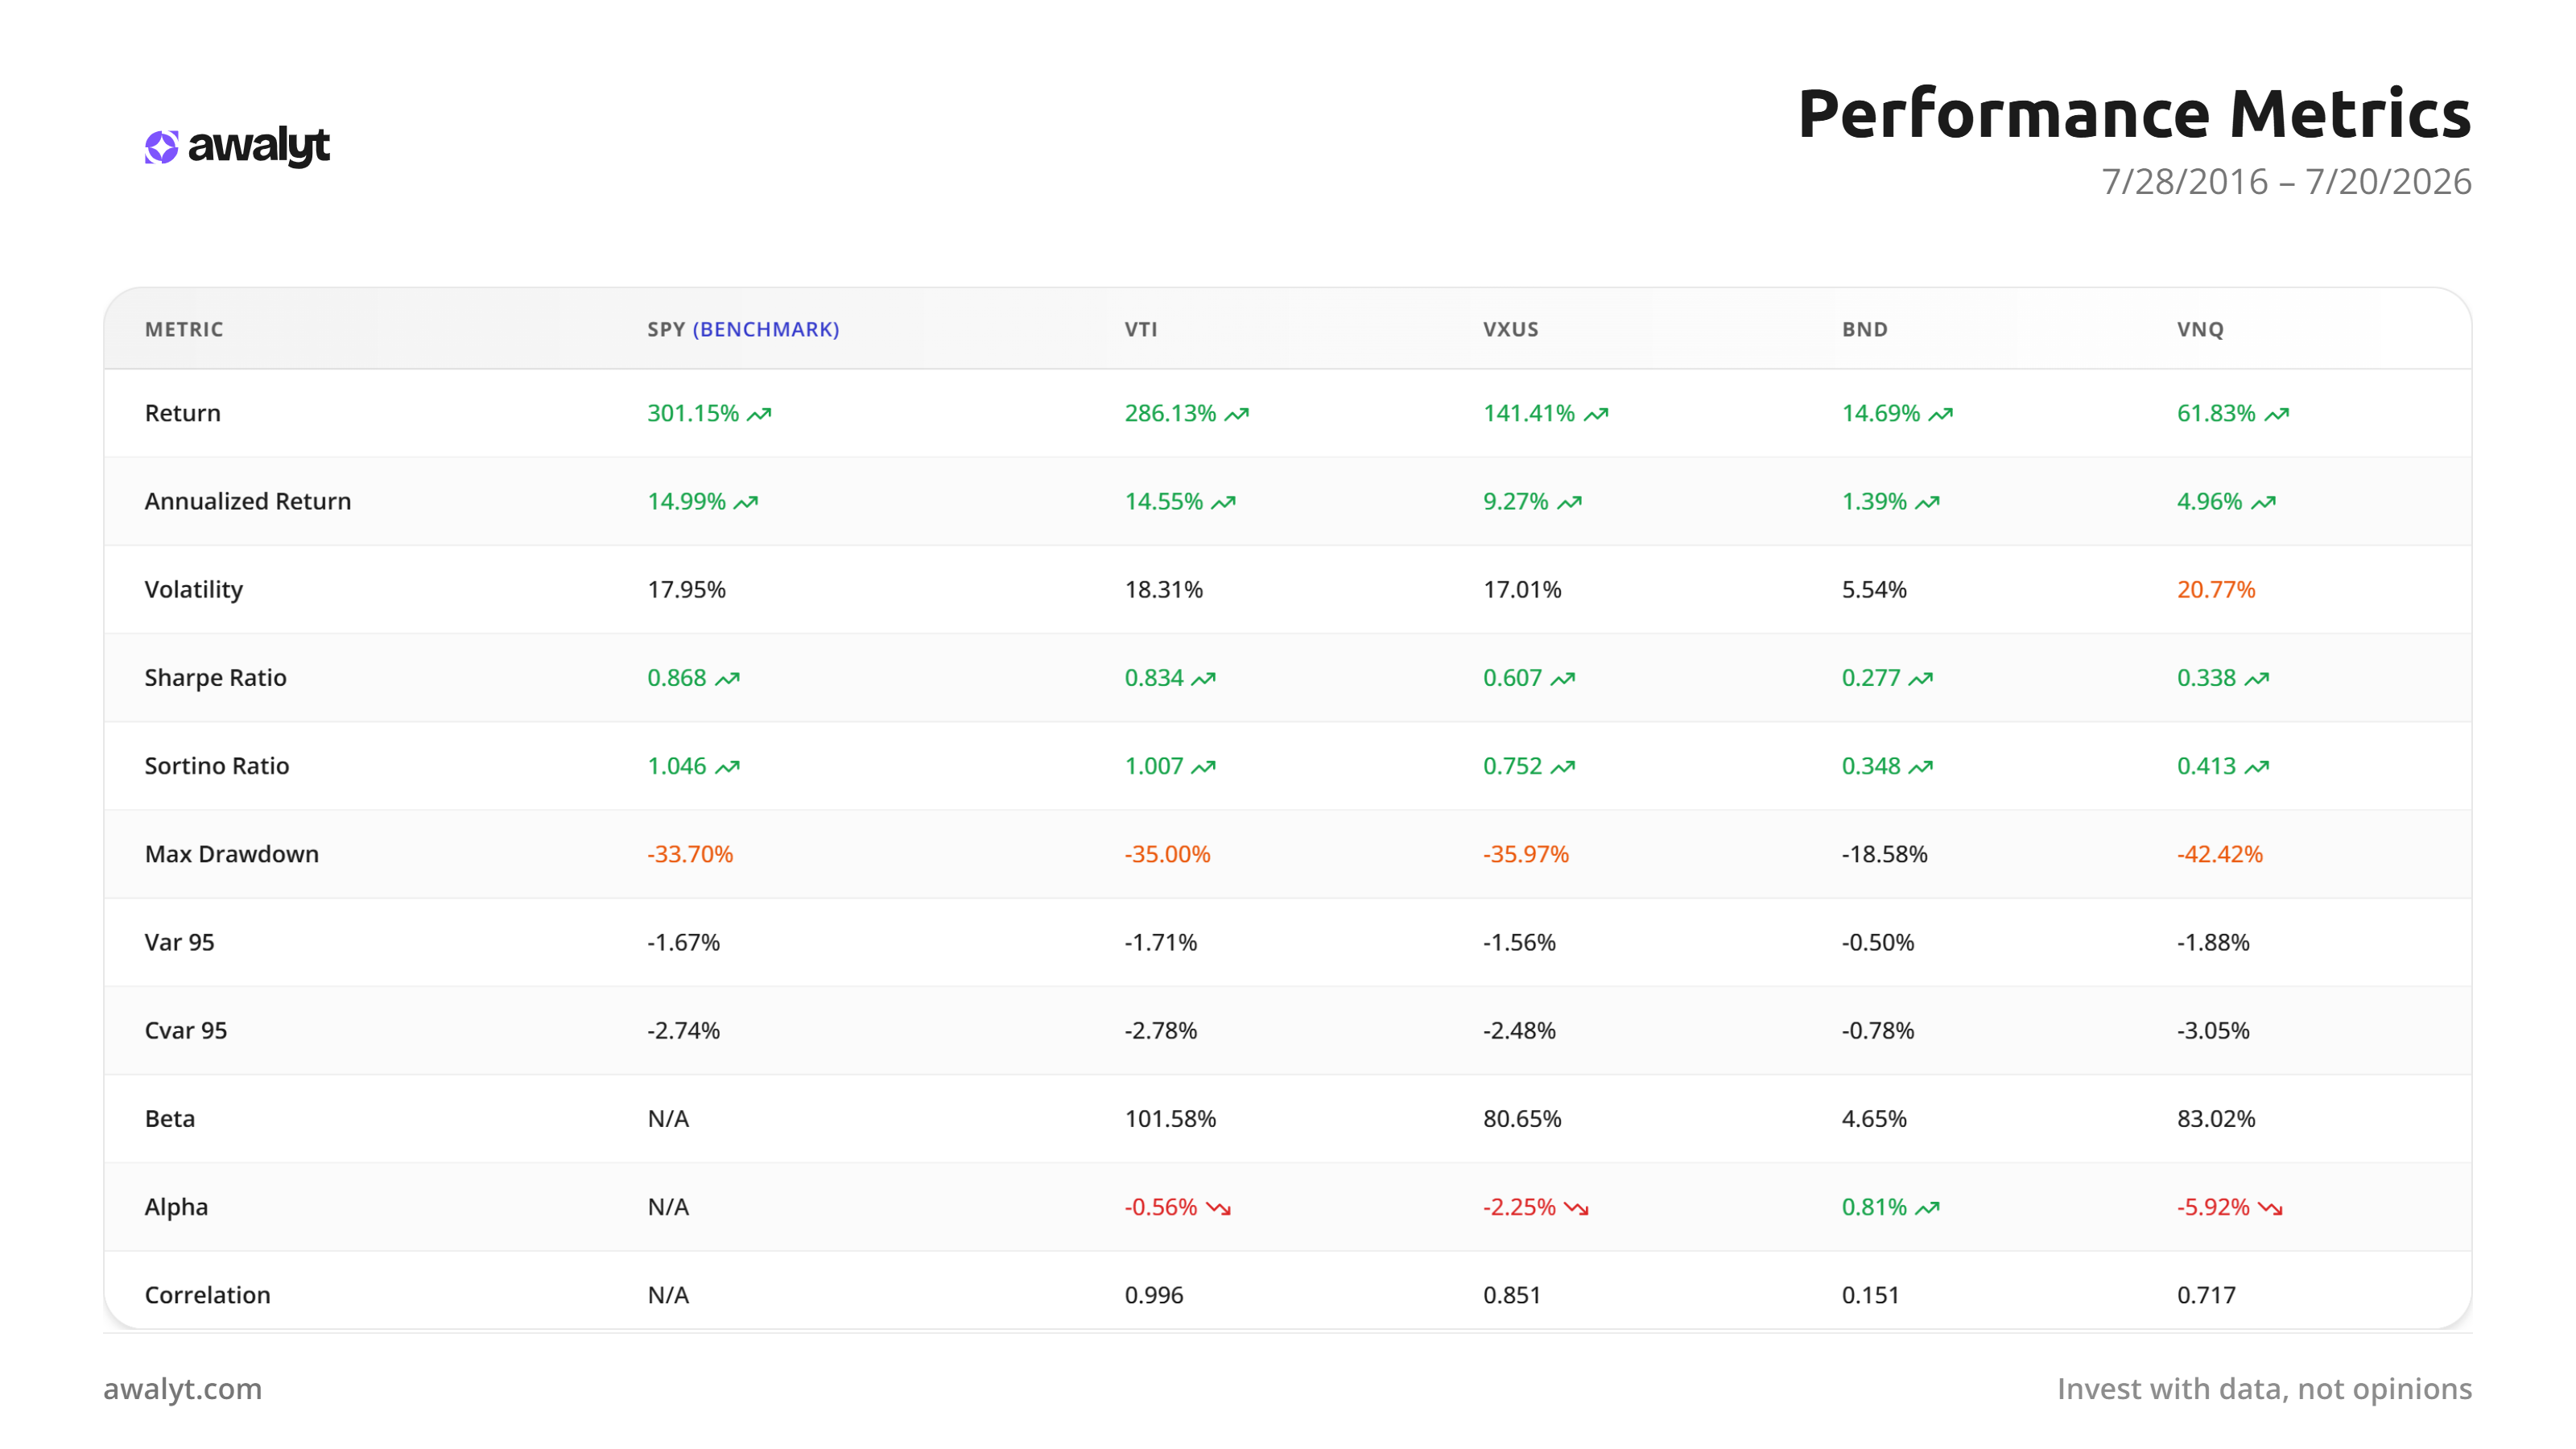
| Return | CAGR | Volatility | Beta | Alpha | |
|---|---|---|---|---|---|
| SPY | 301.15% | 14.99% | 17.95% | — | — |
| VTI | 286.13% | 14.55% | 18.31% | 1.02 | -0.56% |
| VXUS | 141.41% | 9.27% | 17.01% | 0.81 | -2.25% |
| BND | 14.69% | 1.39% | 5.54% | 0.05 | +0.81% |
| VNQ | 61.83% | 4.96% | 20.77% | 0.83 | -5.92% |
VXUS returned 141% against VTI's 286%. International equity spent a decade losing to US equity, which is a well-documented feature of this particular window and not a permanent law. BND returned 14.69% total across ten years, which reads badly until you notice it was the only holding with positive alpha and the only one that stayed out of the way during equity drawdowns.
Beta is displayed as a percentage in the platform, so 80.65% for VXUS is a beta of 0.81. Same number, different notation.
When the diversification stopped working
The average tells a flattering story. The quarterly view tells a more useful one.
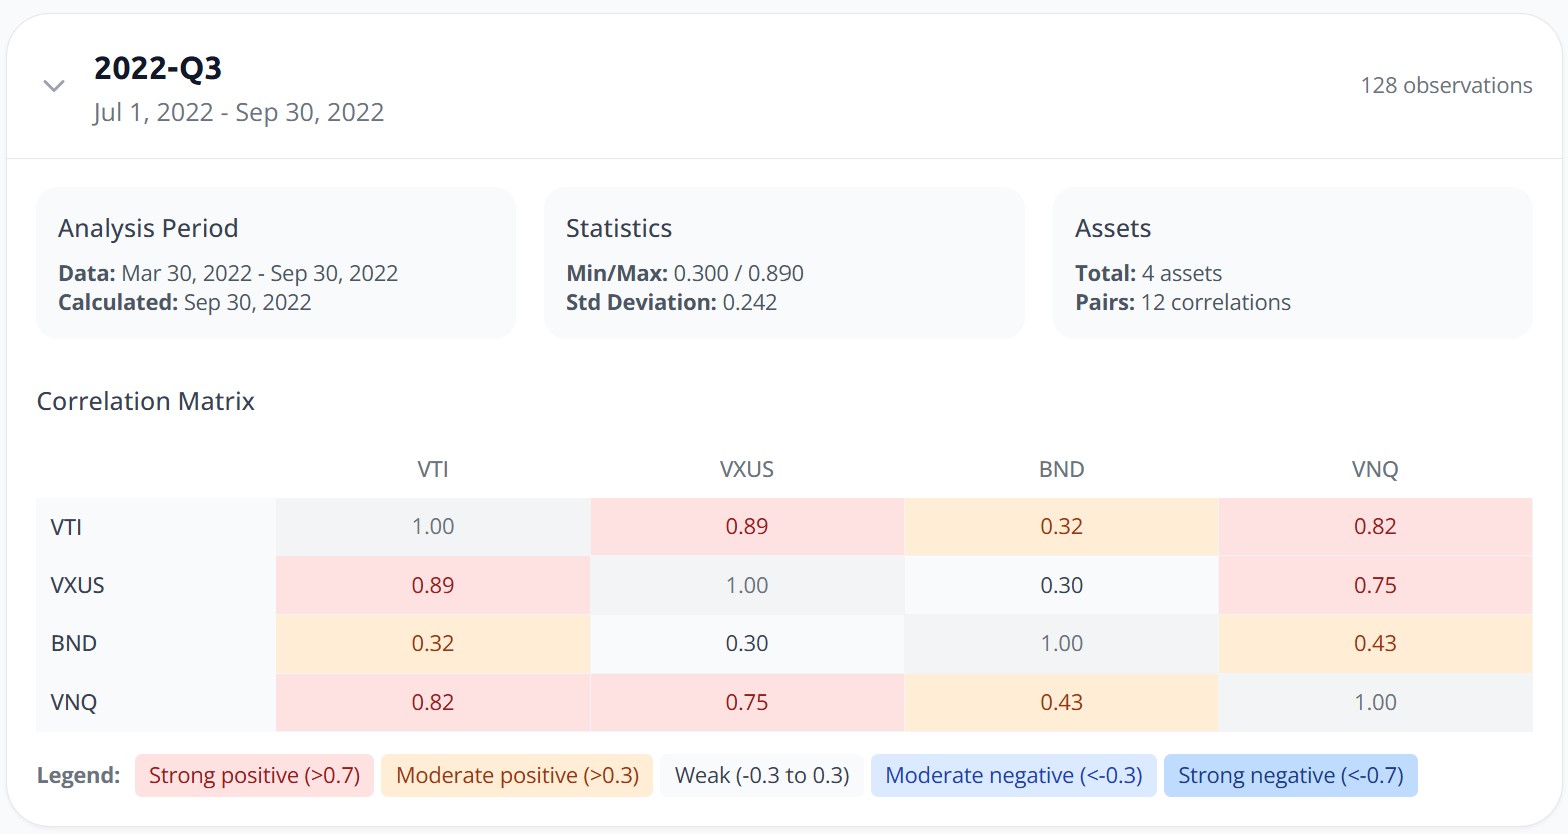
Third quarter of 2022. The market is falling, bonds are falling with it, and this is the exact moment a diversified portfolio is supposed to prove its worth.
| Pair | Q3 2022 correlation |
|---|---|
| VTI–VXUS | 0.89 |
| VTI–VNQ | 0.82 |
| VXUS–VNQ | 0.75 |
| BND–VNQ | 0.43 |
| VTI–BND | 0.32 |
| VXUS–BND | 0.30 |
Three of your four holdings were moving as one asset. US equity, international equity and real estate at 0.75 to 0.89. The full-period average of 0.35 was nowhere to be found in the quarter that counted. Only bonds held any independence, and 2022 was the year bonds fell 13% on their own.
There's a slower version of the same problem in the trend line. Average correlation across the portfolio rose from ~0.23 in the first third of the period to ~0.38 in the last third. The diversification is eroding, gradually, and an investor who checked once in 2016 and never again would have no idea.
One methodological note, since the two correlation figures in this article are computed differently. The ~0.35 average comes from six-month rolling windows sampled quarterly, which smooths short shocks; the single figures in the per-asset table are computed once across the whole period against SPY. They answer different questions and I've kept them separate rather than blending them.
This is the reason I'd argue correlation belongs inside the backtest rather than in a separate lookup. A single average number for the whole period tells you the portfolio was diversified. The quarterly series tells you when it wasn't.
Reason three: one holding was actively hurting
Go back to the per-asset table and look at VNQ on its own.
| VNQ | vs SPY |
|---|---|
| CAGR 4.96% | 14.99% |
| Volatility 20.77% | 17.95% |
| Max drawdown -42.42% | -33.70% |
| Correlation with SPY 0.717 | — |
| Alpha -5.92% | — |
Real estate went into the portfolio as a diversifier. Over these ten years it delivered more volatility than the S&P 500, a drawdown nearly nine points deeper, a correlation of 0.72 to the thing it was supposed to be independent from, and a third of the return.
More risk, less return, limited independence. That is the worst available outcome on all three axes at once, and it is where a meaningful share of that -1.21% alpha came from.
I want to be careful about what this does and doesn't say. It's one asset over one particular decade, a decade that included a rate cycle brutal to leveraged real assets. It isn't a verdict on REITs forever. But it is a clean example of a holding that was added for a reason it did not deliver on, and nobody would have known without checking the numbers separately. Averaged into a portfolio return, VNQ's failure is invisible.
That per-holding view is what asset analysis is for: beta, alpha, Sortino and correlation against any benchmark, one instrument at a time.
The tradeoff almost nobody prices correctly
Here's the honest complication, and it cuts against the comfortable version of this story.
Diversification did reduce risk. Volatility 13.74% against 17.93%. Drawdown -28.66% against -33.70%. Those are real, and for anyone who has sold at the bottom of a crash, they may be worth more than the return difference.
But it did not reduce risk efficiently. Sharpe 0.75 against SPY's 0.87. Sortino 0.89 against 1.04. Calmar 0.34 against 0.44. The portfolio gave up less return than it gave up risk on an absolute basis, yes, but on a risk-adjusted basis it still lost. Every unit of volatility in the diversified portfolio bought less return than a unit of volatility in the index.
So the usual framing, that you trade return for smoothness and it comes out even, isn't what happened here. You traded return for smoothness and came out slightly behind on both.
Which reframes the question. It isn't whether to diversify. It's which diversifiers are actually paying for their seat.
The data in this test answers that unevenly. BND paid: positive alpha, near-zero correlation, the only holding that was doing something different when it counted. VNQ didn't. VXUS is arguable, and depends entirely on whether you think the next decade looks like the last one.
So what do you do with a portfolio that trails?
What kind of investor are you, honestly? The one who set up an automatic monthly contribution in 2017 and genuinely hasn't looked since? Then a 0.74 beta and a shallower 2022 is probably doing exactly what you hired it to do, and the $14,728 is a number you can afford to stop looking at.
Or you're someone who checks quarterly, felt every point of that 2022 drawdown, and wants the portfolio to keep closer pace with the market without going all-in on one index. That's a different problem, and it has more than one solution.
The search is for holdings that add independence without giving up return. That's harder than it sounds, because most things that are uncorrelated with equities are uncorrelated because they earn less. Some places people look:
Commodities and gold behave differently from both stocks and bonds, particularly in inflationary stretches, though the long-run return profile is its own conversation. We ran that test in gold as a portfolio diversifier.
Sector and factor tilts pull in the other direction, adding concentration rather than reducing it, sometimes profitably and sometimes not. The semiconductor tilt test is a case where the returns were excellent and the diversification argument still failed.
Individual stocks change the math again, since a portfolio of ten businesses you understand has different correlation properties from a portfolio of ten funds that each hold five hundred.
And the simplest lever is often allocation weight rather than new assets. Moving from 20% bonds to 10% shifts beta materially without adding a single line item. A version of this portfolio without VNQ, redistributing the 10%, is a two-minute test.
None of these are recommendations. They're hypotheses, and the point of a backtest is to find out which ones survive contact with the data before your money does. If the shape of the portfolio here looks close to yours, the Core Four is the canonical version and a reasonable place to start comparing.
Why is my portfolio down when the market is up?
Worth separating from everything above, because it's a different question.
In this ten-year test there was no calendar year where SPY finished up and the portfolio finished down. Both negative years, 2018 and 2022, were negative for the index too. Underperformance is common; genuine inverse movement over a full year is not.
Over shorter windows it happens routinely, and the reasons are the same ones already covered: a low-beta portfolio can drift sideways during a sharp index rally driven by a handful of large names it holds at below-index weight.
There's also a cause that has nothing to do with holdings. The index return assumes a lump sum sitting there the whole time. Yours doesn't. If most of your contributions landed in early 2022, your money-weighted return can be meaningfully negative while the time-weighted return of the same portfolio is positive. That gap isn't a portfolio problem, it's an arithmetic one, and it's why comparing your account balance to an index chart is misleading in the first years of investing. Portfolio monitoring tracks time-weighted return separately for exactly this reason.
Frequently asked questions
Is beta 0.74 bad? It isn't good or bad on its own. It's a description. It says you should expect roughly 74% of the market's movement in both directions, which means trailing in strong up years and falling less in bad ones. It becomes a problem only if you expected index-like returns from a portfolio that was never built to deliver them.
Should I just buy the S&P 500 then? This test covers one ten-year window, and it happens to be a window where US large-cap beat almost everything. A decade starting in 2000 produces the opposite conclusion in dramatic fashion. The honest answer is that the data supports neither certainty. What it does support is knowing your portfolio's beta before you judge its returns.
How much underperformance is normal for a diversified portfolio? There's no fixed number, but beta gives you a rough expectation. If your beta is 0.74 and the index returned 15% annually, something in the region of 11% is the structural expectation. The distance between that expectation and what you actually got is alpha, and here it was -1.21% a year.
Why does correlation change so much quarter to quarter? Because correlation is a behavioral measure, not a fixed property of an asset. Assets that move independently in calm periods often move together under stress, when everything is being sold for liquidity rather than for reasons specific to each holding. That's why a single full-period average can be misleading, and why the quarterly matrices in the backtest are worth reading.
Does adding more funds fix this? Not reliably. Adding funds that correlate with what you already own increases complexity without increasing independence, which is a different failure from the one in this article. We looked at where that line falls in how many ETFs make a portfolio diversified.
The bottom line
A $14,728 gap over ten years looks like a mistake until you decompose it. Beta 0.74 explains most of it and was a deliberate choice. Correlation at 0.35 explains why the beta was there in the first place. The remaining -1.21% of alpha is the part that wasn't chosen, and roughly half of it traces to a single holding that carried more volatility than the index while returning a third as much.
None of that is visible from a balance. All of it is visible from a backtest that runs the correlation alongside the returns.
If you've been comparing your portfolio to the S&P 500 and feeling vaguely bad about it, the useful next step isn't to change anything. It's to find out what your beta is.
Want to test these insights on your own portfolios?
Awalyt is a portfolio analysis platform: backtesting on daily data, fundamental analysis, asset analysis, and AI-powered insights.
Get Started FreePortfolios mentioned in this article
Related Insights
Backtesting a Portfolio: 6 Common Mistakes and How to Avoid Them [2026]
11 min read
How to Check ETF Overlap for Free (VOO vs QQQ) [2026]
9 min read
How to Run a Free DCA Backtest (VOO Example) [2026]
8 min read
10 Years of $300/Month DCA: What Happened on VOO, QQQ, AAPL, and 7 Other Popular Assets [2026]
11 min read
What Is Factor Investing? A Practical Guide with 12 Years of Real Data [2026]
14 min read
How to Use Historical P/E to Tell If a Stock Is Cheap or Expensive [2026]
10 min read