How to Check ETF Overlap for Free (VOO vs QQQ) [2026]
Hold VOO and QQQ together and it can feel like diversification. Two big funds, two different indexes, the S&P 500 on one side and the Nasdaq-100 on the other.
Then you run the numbers: 95.6% of QQQ is already sitting inside VOO.
Most people never check. They add the second ETF because a Reddit thread called it "tech exposure," or because a model portfolio they saw online held both, and they assume two tickers means two bets. The one question that settles whether you diversified or just bought 105% of Apple and 110% of Nvidia goes unasked.
It takes about half a minute to answer, for free. The Awalyt ETF overlap analyzer pulls the full holdings of two funds, calculates how much they share, lists the biggest shared positions, and shows where their sector mix splits apart. Below: how to run it, what VOO vs. QQQ looks like in real numbers, why the result tends to surprise people, and the point where one overlap check stops being enough.
Disclaimer: This article is for educational and informational purposes only. It does not constitute investment advice. Past performance does not guarantee future results. Always do your own research before making any investment decisions.
How to run the check
Open the analyzer. No signup, no email.
Type two tickers into the First ETF and Second ETF fields, hit Analyze overlap, and you get five things back. The search autocompletes from the supported universe of US-listed ETFs. Popular pairs people compare: VOO vs. QQQ, VTI vs. VOO, VOO vs. SCHD, VTI vs. VXUS.
The first is a verdict (Very High / High / Moderate / Low) for an instant read before you look at anything else.
The second, and the one that matters most, is the weighted overlap percentage. For every shared holding it takes the smaller of the two weights and sums them, because that's the dollar amount you genuinely double up on. A stock that's 8% of VOO and 9% of QQQ counts as 8% overlap, not 17%.
Third is the overlapping holdings count and coverage asymmetry — how many tickers sit in both funds, and what share of each fund lives inside the other. The asymmetry is the part most people miss: a small, narrow ETF can be almost entirely swallowed by a large, broad one, while only a slice of the broad fund overlaps back.
Then a top shared holdings table, the ten largest common positions with each fund's weight and the overlap contribution side by side. And finally a sector comparison across the 11 GICS sectors, where even funds that overlap heavily can tilt very differently, and where the real story often hides.
The example: VOO vs. QQQ in real numbers
This is the one comparison most US investors should run at least once.
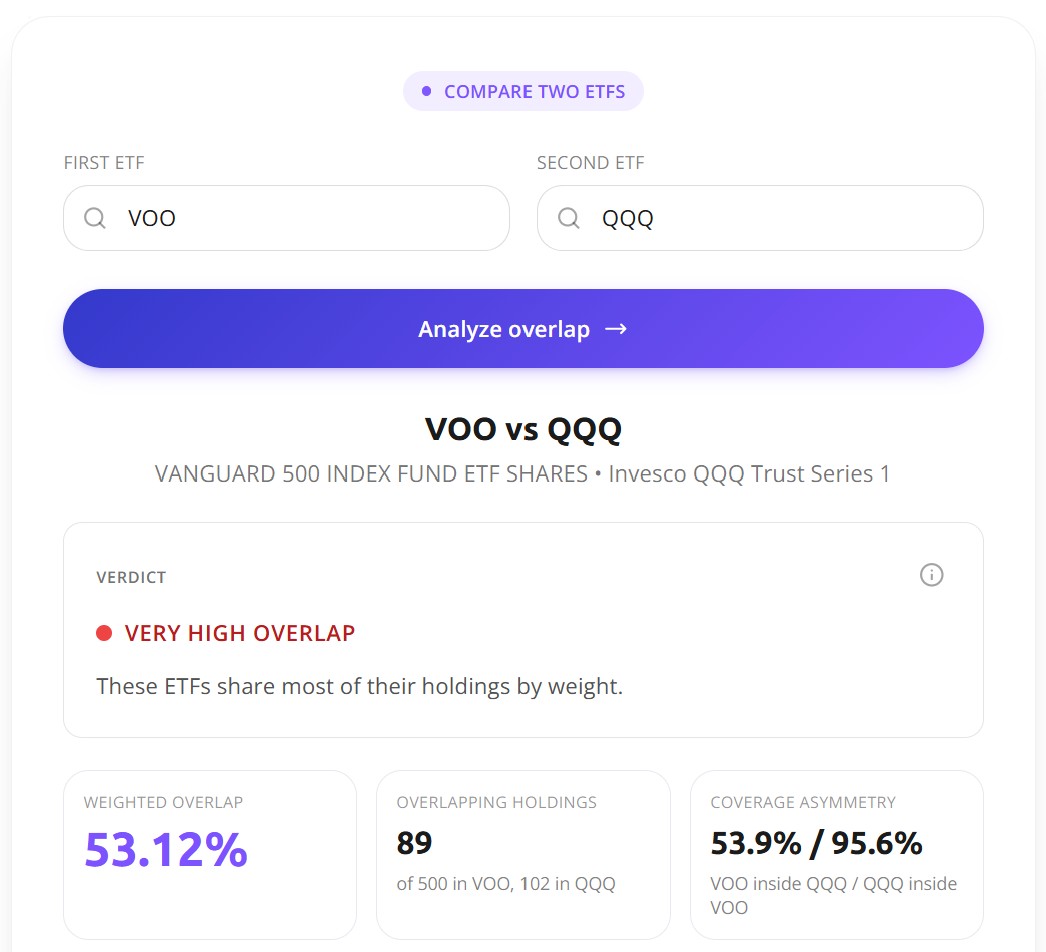
The verdict comes back Very High Overlap, with a 53.12% weighted overlap across 89 shared holdings (out of 500 in VOO and 102 in QQQ). But the figure to sit with is the asymmetry: 53.9% of VOO sits inside QQQ, while 95.6% of QQQ sits inside VOO. Holding both in equal amounts doesn't add a second strategy. It adds a near-copy of the first one with a thin layer of extra exposure on top.
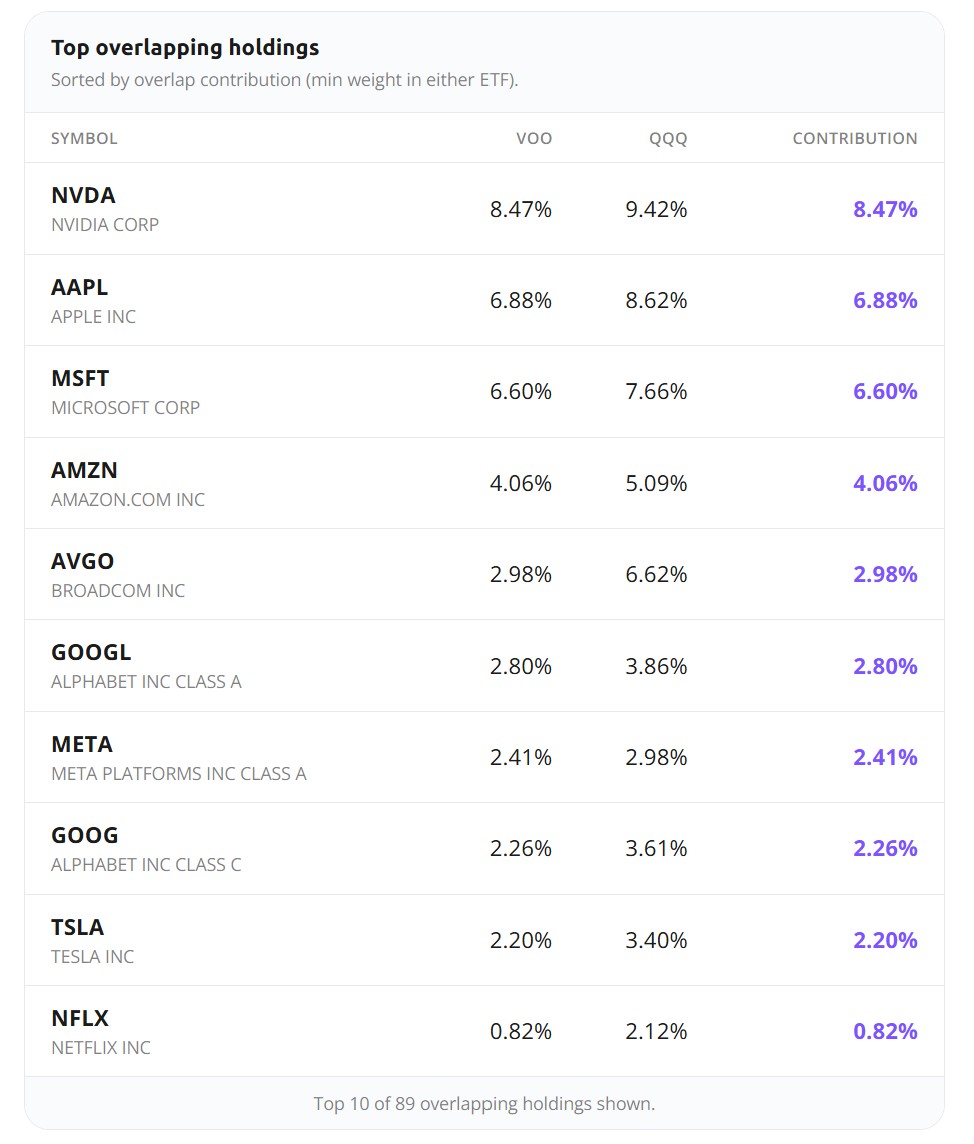
Look at the shared top ten: NVDA, AAPL, MSFT, AMZN, AVGO, GOOGL, META, GOOG, TSLA, NFLX. The same mega-cap tech names, around 8-9% each in VOO and 9-10% in QQQ. A 50/50 split between the two funds isn't a spread across two indexes; it's Nvidia at roughly 9% of your portfolio, Apple at 8%, Microsoft at 7%, with the top six names alone past 30% of your money.
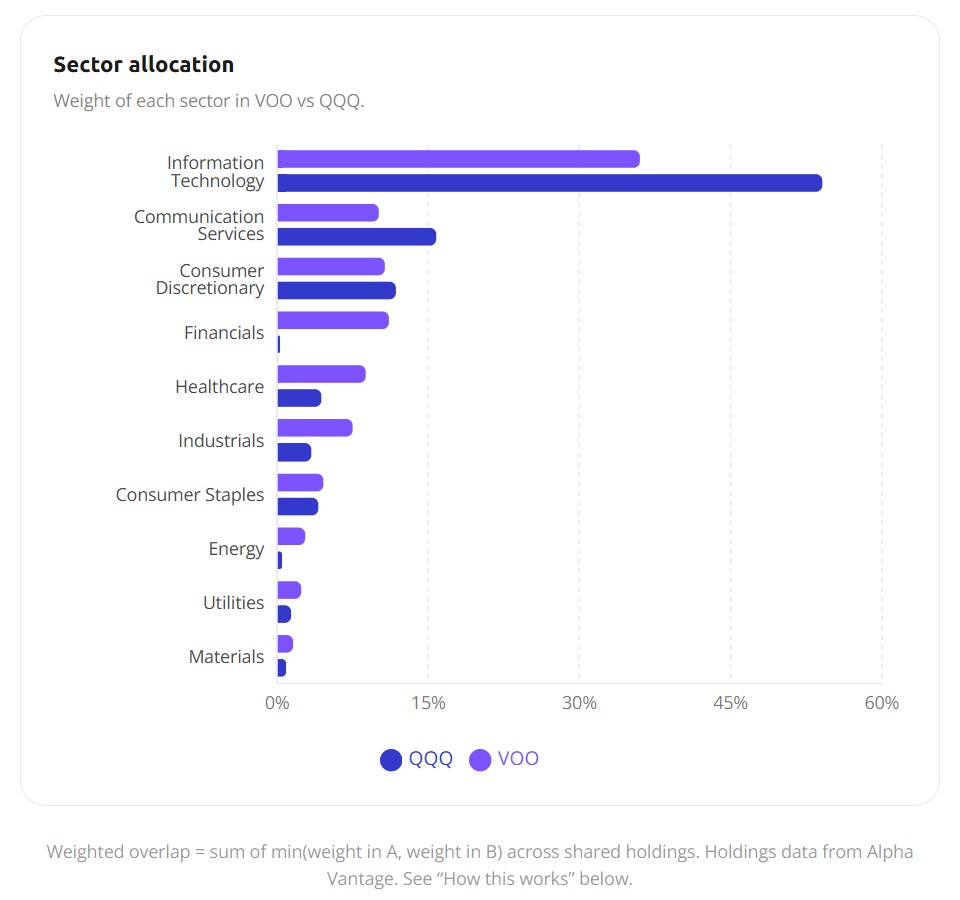
The sector chart shows where the two funds finally diverge. QQQ runs about 55% Information Technology to VOO's 35%, holds almost no Financials or Energy, and leans heavier on Communication Services. So the slice of QQQ that isn't already VOO is mostly an extra bet on tech and communications, paid for by underweighting financials and energy.
None of this makes a VOO and QQQ pairing wrong. It's a legitimate allocation with real tradeoffs. The thing to be clear-eyed about is that you're placing a directional bet on mega-cap tech, which reads very differently from "I own the S&P and the Nasdaq, so I'm covered" the next time a year like 2022 rolls around. If you want the performance side of the same pairing, we backtested it in VOO vs. QQQ.
Why it matters
Fund names are marketing. "S&P 500" and "Nasdaq-100" sound like different exposures because the indexes carry different names and rules, but underneath they hold most of the same companies at slightly different weights. You see the same thing with VTI and VOO, where "total market" is more than 80% the same large-caps as "large cap," and with VOO and SCHD, where "growth" and "dividend" still share a chunk of the mega-cap names. Build your mental picture of the portfolio from the labels and you'll overestimate how spread out you are.
That gap between the label and the holdings is where the most common DIY mistake lives: concentration nobody chose. Being heavily weighted in mega-cap US tech is a perfectly defensible position, and plenty of people who hold it on purpose have done well. The trouble is carrying that exposure by accident. When the next real tech drawdown hits, the investor who picked the tilt knows what they're in for; the one who thought two indexes meant two bets finds out the hard way. The overlap check won't tell you whether your concentration is wise. It tells you whether it was deliberate — usually the more useful thing to know.
This is also why a lot of "diversified" portfolios are less diversified than they look. Take a standard VTI / VXUS / BND setup with an SCHD tilt: the real diversification is across asset classes, US stocks against international against bonds, not across the two US-equity funds, which mostly repeat each other. The benefit is coming from the bonds and the international sleeve, which is worth knowing when you decide what to add next. (More on that in what portfolio diversification really means.)
One last reason to look before you buy: overlap is the cause of the correlation you'd otherwise only notice afterward. Backtest VOO and QQQ on Awalyt's correlation matrix and they sit around 0.85 to 0.90 daily. That high correlation isn't a quirk of the market; it falls straight out of the shared holdings. Correlation describes how two funds behaved after the fact. Overlap shows you the same relationship in advance, from the composition alone.
Where one overlap check stops
A composition snapshot is not a forecast. The tool shows what's inside the two funds today, not how that overlap will play out over the next decade or whether holding both suits your situation.
Holdings data refreshes periodically rather than in real time. For low-turnover funds like VOO and QQQ that lag is meaningless; for high-turnover or actively managed funds, read the overlap figure as accurate within a small margin rather than exact to the basis point.
The verdict labels are shorthand, not a rule. A 53% overlap inside a tech-tilted satellite sleeve is intentional and fine; the same 53% inside what you assumed was a diversified core is a warning sign. Same number, opposite meaning, depending on the rest of the portfolio.
And two ETFs at a time is only a starting point. Most portfolios hold four or five funds, and pairwise checks don't add up to a clean picture of total concentration. Knowing QQQ is 95.6% inside VOO still won't tell you whether to trim it, add to it, or leave it alone, since that depends on your horizon, your other positions, and your tax situation, none of which the tool can see. It sharpens the decision without making it for you.
A few pairs worth running
If you've never seen these numbers, VOO vs. QQQ is the one I'd run first; it recalibrates how you read every recommendation that pairs the two. From there, VOO vs. VTI makes the "S&P 500 vs. total market" question concrete, the overlap is very high because VTI is largely the same large-caps with a small- and mid-cap tail, so the urge for "broader exposure" is mostly already met by VOO alone. VOO vs. SCHD is the growth-versus-dividend pairing many investors hold, and the overlap in big dividend payers runs larger than the marketing implies, even though SCHD does add yield and a lighter tech weight.
Then run VTI vs. VXUS as a control. US total market against international ex-US should come back near 0% overlap, and seeing that makes the whole framework click: genuine, ground-up diversification looks like this, and among popular ETF pairs it's the exception rather than the default.
The DCA calculator guide applies the same test-before-you-commit logic to a contribution plan, if you want the companion piece.
When you need the portfolio-level view
Pairwise overlap answers a pairwise question. Real portfolios eventually pose one it can't. If you hold VTI, VXUS, BND, SCHD, and a tech tilt, your true mega-cap concentration across the whole US-equity sleeve, the correlation structure among all five positions, and how the mix would have weathered past drawdowns are portfolio-level problems. That's the job of the full Awalyt platform, which runs the same holdings and price data behind the free tools through correlation matrices, drawdown analysis, and a daily-precision backtesting engine built for multi-asset rebalancing. If you're new to that side of things, the introduction to portfolio backtesting is a good starting point.
Bottom line
A VOO-and-QQQ portfolio can be a sound choice. Holding the two without knowing that 95.6% of one already lives inside the other is just a choice you didn't realize you were making. The check costs nothing and takes about as long as reading this paragraph, so it's worth doing before you add the next ETF to something you already own.
This article is for educational and informational purposes only. It does not constitute financial, investment, or tax advice. Past performance does not guarantee future results. Always do your own research and consider consulting a qualified financial advisor before making investment decisions.
Want to test these insights on your own portfolios?
Awalyt is a portfolio analysis platform: backtesting on daily data, fundamental analysis, asset analysis, and AI-powered insights.
Get Started FreeRelated Insights
10 Years of $300/Month DCA: What Happened on VOO, QQQ, AAPL, and 7 Other Popular Assets [2026]
11 min read
How to Run a Free DCA Backtest (VOO Example) [2026]
8 min read
Why Is My Portfolio Underperforming the S&P 500? [2026]
11 min read
What Is Factor Investing? A Practical Guide with 12 Years of Real Data [2026]
14 min read
Backtesting a Portfolio: 6 Common Mistakes and How to Avoid Them [2026]
11 min read
How to Use Historical P/E to Tell If a Stock Is Cheap or Expensive [2026]
10 min read