What Is Portfolio Backtesting? A Complete Guide for DIY Investors [2026]
You've picked your ETFs. You've decided on a 50/30/20 split between US stocks, bonds, and international. You're ready to invest $10,000.
But here's the question no one asks before clicking "buy": how would this portfolio have actually performed over the last 10 or 15 years? Not in theory. Not in a blog post's optimistic projection. In real market conditions — including the 2020 COVID crash, the 2022 bear market, and everything in between.
That's exactly what portfolio backtesting answers. And if you're a DIY investor making your own allocation decisions, it's one of the most valuable tools you can use before committing real money.
Disclaimer: This article is for educational and informational purposes only. It does not constitute investment advice. Past performance does not guarantee future results. Always do your own research before making any investment decisions.
What Is Portfolio Backtesting?
Portfolio backtesting is the process of testing an investment strategy against real historical market data to see how it would have performed in the past.
Think of it like a flight simulator for your portfolio. A pilot doesn't learn to fly by jumping into a 747 with passengers on board. They practice in a simulator first — one that uses real physics, real weather conditions, real failure scenarios. Backtesting does the same thing for your investments: it takes your proposed allocation, applies it to years of actual market data, and shows you exactly what would have happened.
The output isn't just a single number. A good backtest gives you a complete picture: total return, annualized growth rate, how much the portfolio dropped during the worst periods, how volatile it was year to year, and how it compared to a benchmark like the S&P 500.
The key distinction is that backtesting uses real historical prices — not projections, not averages, not estimates. Every daily price movement, every dividend payment, every market crash is included in the simulation.
How Does a Backtest Actually Work?
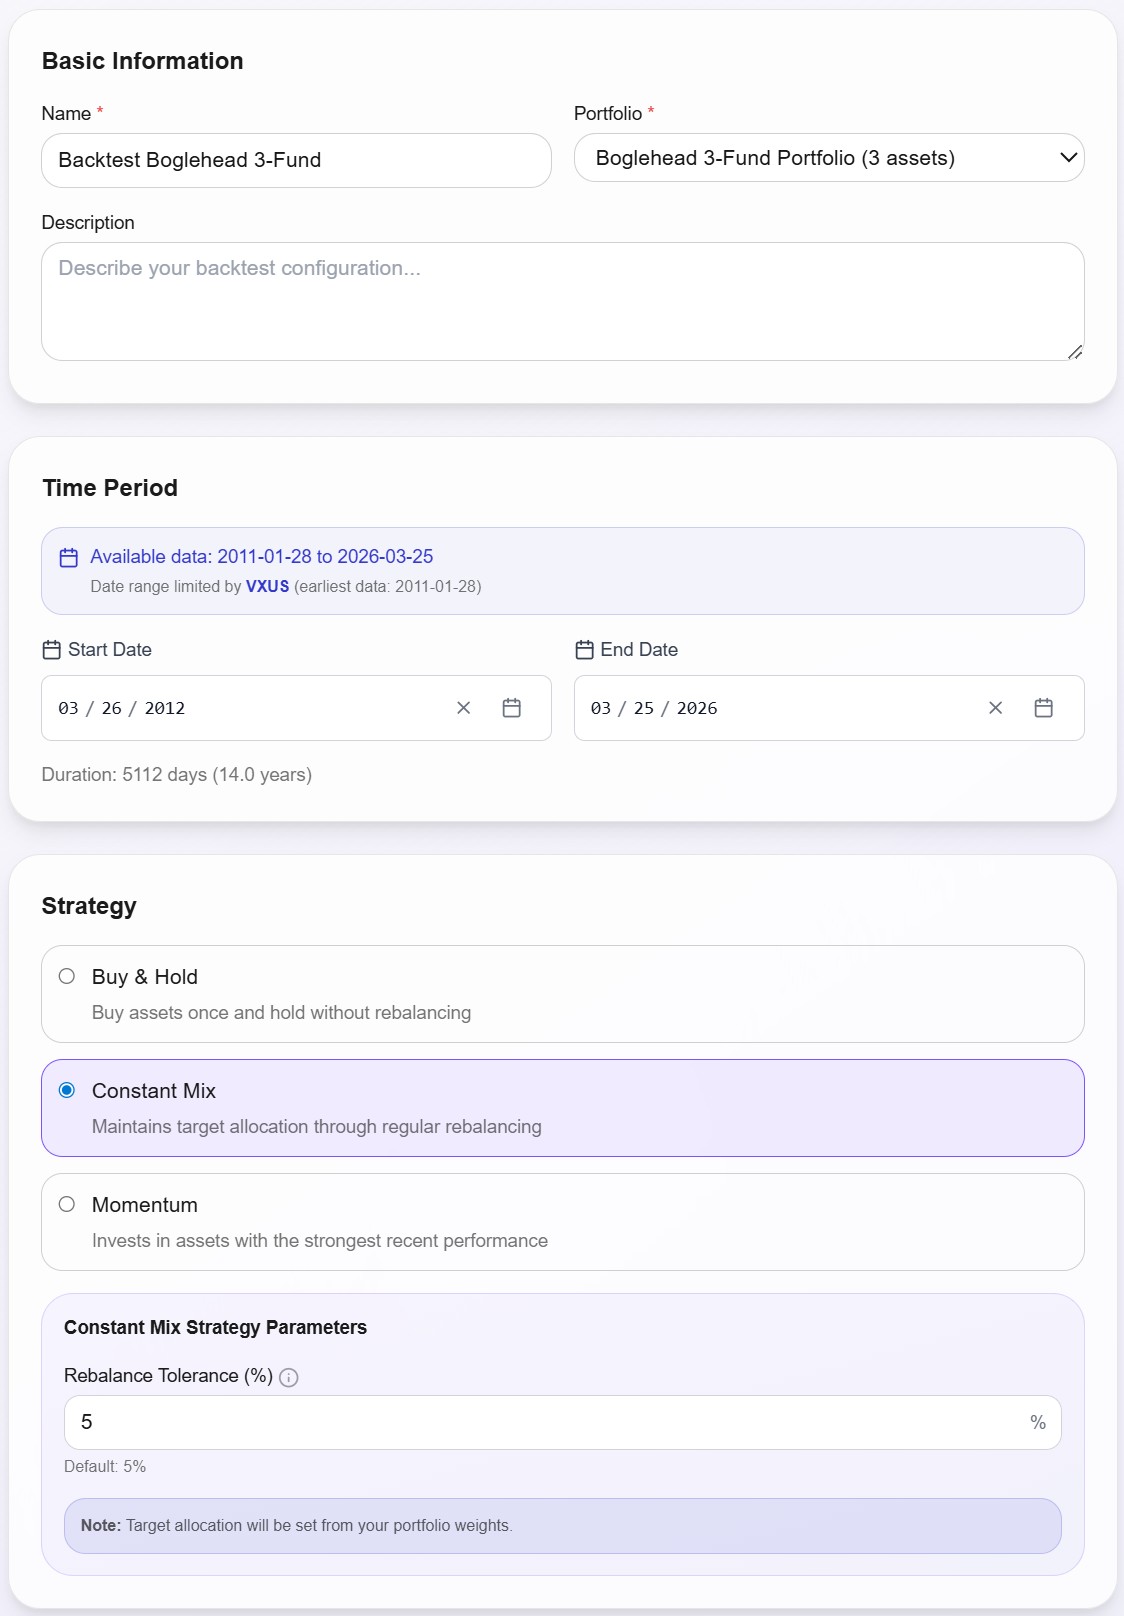
A backtest needs three inputs: a portfolio, a time period, and a strategy.
The portfolio is your asset allocation — which ETFs or funds you want to hold, and at what percentage. For example, a classic Bogleheads 3-Fund Portfolio might be 50% VTI (US total market), 30% BND (bonds), and 20% VXUS (international stocks).
The time period defines how far back you want to test. Longer is generally better — 10 to 15 years captures multiple market cycles, including both bull runs and crashes. A 5-year backtest might look great if it only covers a bull market, but it won't tell you how the portfolio handles real stress.
The strategy determines how the portfolio is managed over time. The simplest approach is Buy & Hold — you invest once and never touch it. A more common approach is Constant Mix (also called periodic rebalancing), where you bring the portfolio back to its target weights at regular intervals. Some tools also offer momentum-based strategies that shift allocation toward recent winners.
Once you hit "run," the backtesting engine replays history day by day. It simulates buying your portfolio on the start date with your initial investment, applies daily price changes to each holding, executes rebalancing trades according to your chosen strategy, and tracks everything from the first day to the last.
The result is a complete simulation of what your money would have done — not in theory, but based on what the market actually delivered.
What You Get from a Backtest
This is where backtesting becomes powerful. A good backtest doesn't just tell you "your portfolio returned X%." It breaks down the entire journey your money would have taken.
Let's look at a real example. Here's a backtest of the Bogleheads 3-Fund Portfolio (50% VTI, 30% BND, 20% VXUS) with a Constant Mix strategy, annual rebalancing, and a $10,000 initial investment from March 2012 to March 2026 — 14 full years of market data.
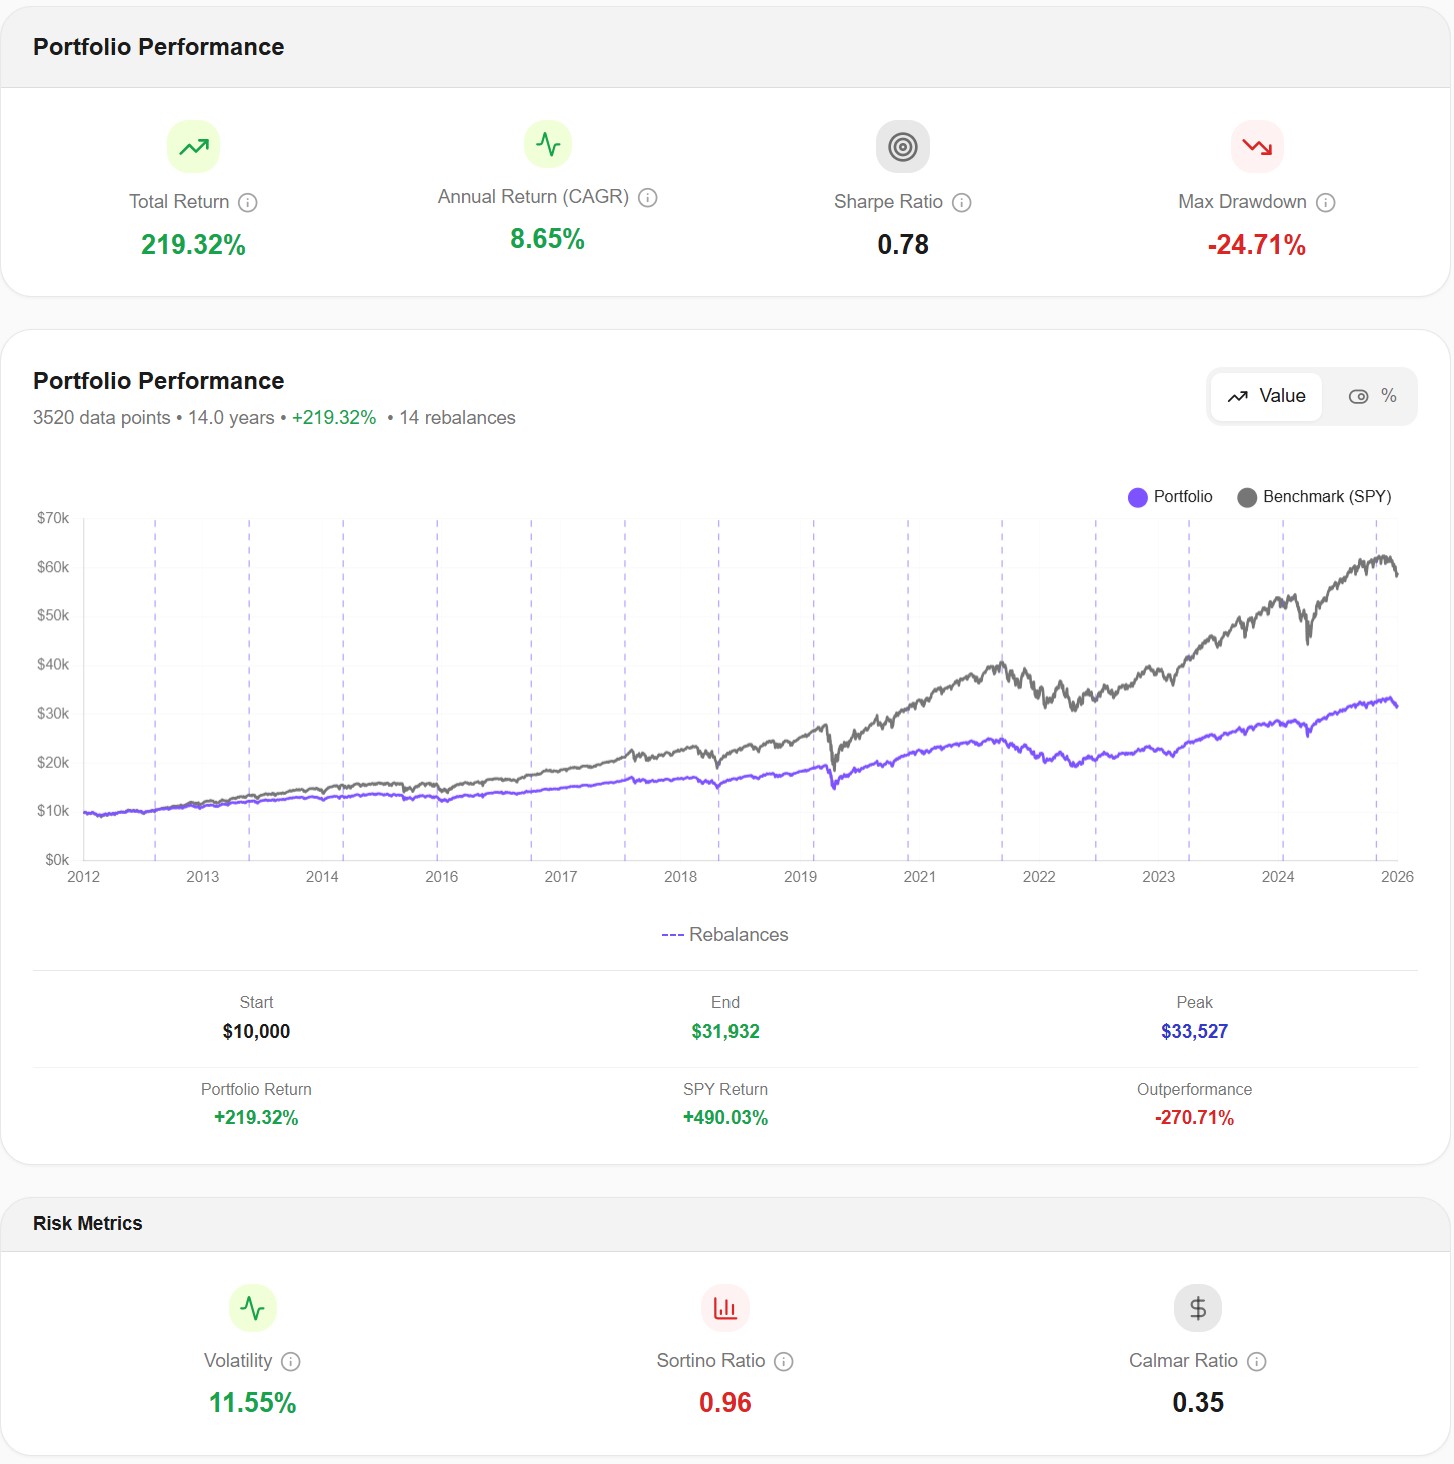
Here's what the numbers tell you:
Total Return: +219.32%. Your $10,000 became $31,932. That's the headline number, and it's useful — but it's far from the full story.
CAGR: 8.65%. The Compound Annual Growth Rate smooths out the ups and downs into a single annualized figure. It tells you what the portfolio returned per year, on average, accounting for compounding. This is a much more meaningful number than total return because it's directly comparable across different time periods.
Sharpe Ratio: 0.78. This measures risk-adjusted return — how much return you earned for each unit of volatility you took on. A Sharpe above 0.5 is generally considered acceptable; above 1.0 is strong. At 0.78, this portfolio delivered decent returns without excessive volatility.
Max Drawdown: -24.71%. This is arguably the most important number in any backtest, and the one most investors overlook. It tells you the worst peak-to-trough decline during the entire period. In real terms: at some point, your $10,000 portfolio (or whatever it had grown to by then) lost nearly a quarter of its value before recovering. Can you sit through that without selling? If the answer is no, you need a different allocation — and backtesting just saved you from learning that lesson with real money.
Volatility: 11.55%. This measures how much the portfolio's returns fluctuated day to day. Lower volatility means a smoother ride. For context, the S&P 500 typically runs around 15-17% volatility, so this diversified portfolio was notably smoother.
Sortino Ratio: 0.96. Similar to Sharpe, but it only penalizes downside volatility — the kind of volatility you actually care about. A Sortino near 1.0 tells you the portfolio generated solid returns relative to its downside risk.
Notice one more thing in the chart: the portfolio significantly underperformed the S&P 500 benchmark (SPY returned +490% in the same period). That's not a flaw — it's a feature of diversification. The 3-Fund Portfolio includes bonds and international stocks, which naturally drag returns in a US-dominated bull market. But they also cushioned the fall during every downturn. That's the tradeoff, and backtesting makes it visible.
Why You Should Backtest Before Investing
Most investors skip backtesting because they think they already know what they're getting into. "Stocks go up over time." "Bonds reduce risk." "Diversification is good." These are all true in general — but the specifics matter enormously, and they're often surprising.
You'll discover your real risk tolerance
Everyone says they can handle a 30% drawdown — until they're watching $30,000 disappear from their account in real time. Backtesting shows you exactly how deep the drops get, how long they last, and how long recovery takes. It's the closest thing to experiencing a crash without actually losing money.
You'll see how volatility changes over time
Risk isn't constant. A portfolio that feels calm and predictable for years can suddenly spike in volatility during a crisis. Backtesting reveals these patterns year by year.
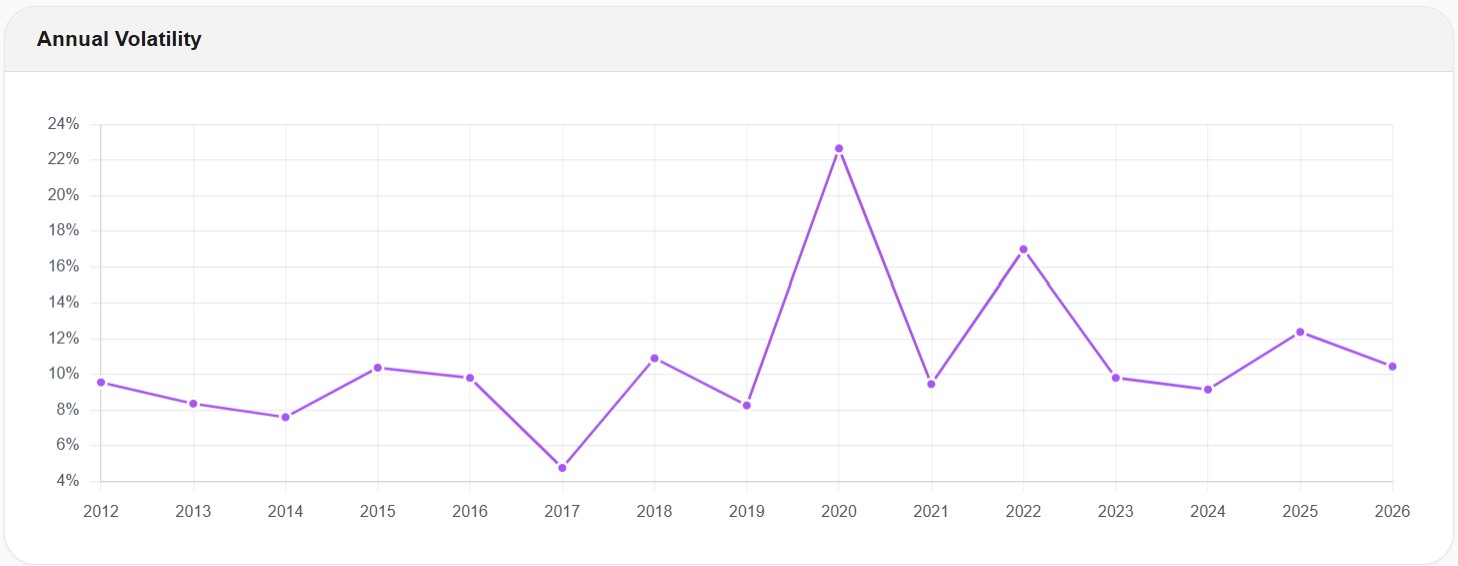
Look at 2020 in this chart. The portfolio's annual volatility jumped from around 8% to over 22% — nearly three times its normal level. By 2023, it had settled back down to around 9%. If you only looked at average volatility, you'd never see this spike. Backtesting shows you the full picture.
You'll understand what rebalancing actually does
Rebalancing sounds simple in theory: sell what's gone up, buy what's gone down, maintain your target weights. But what does it actually look like in practice?
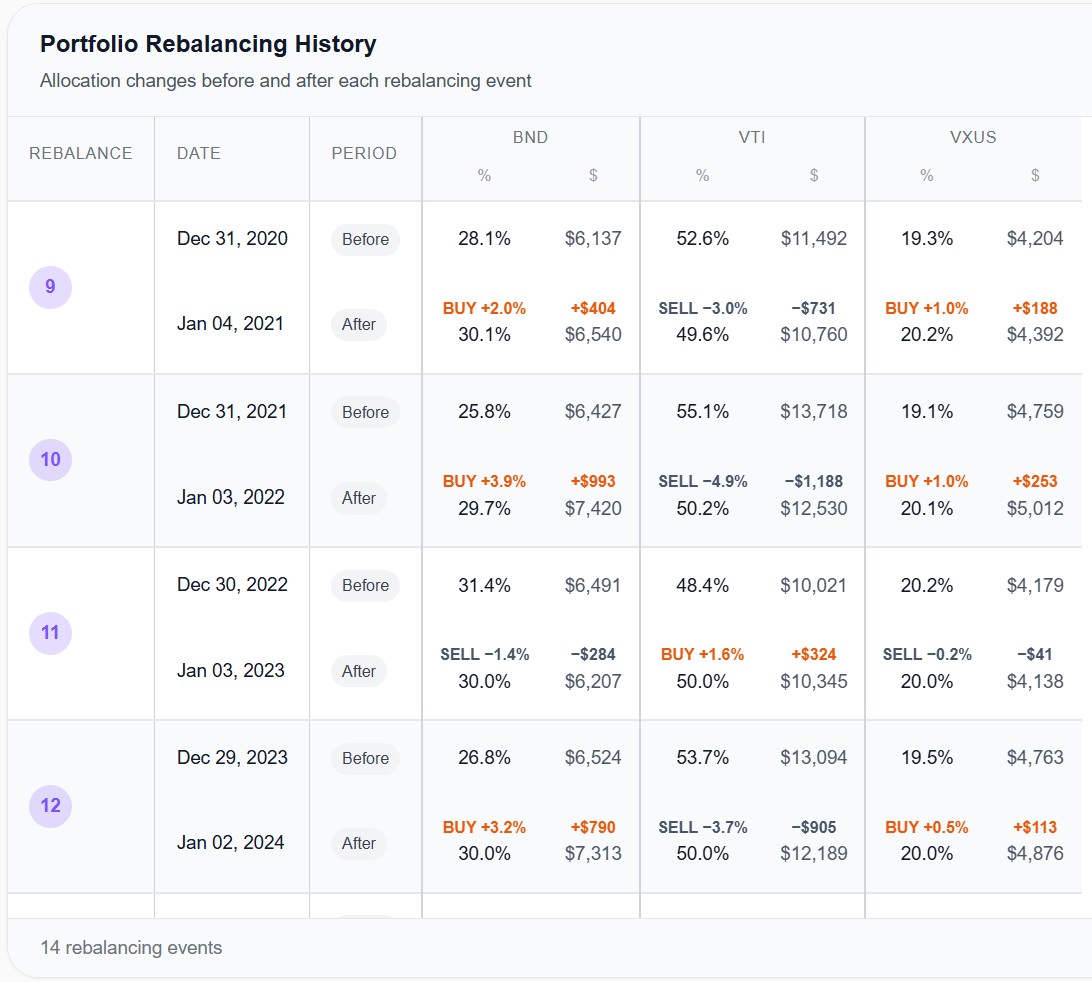
This table shows every rebalancing event the backtest executed. You can see exactly what happened at each annual checkpoint: which assets had drifted above their targets (sell), which had fallen below (buy), and the exact dollar amounts involved.
For example, look at the rebalance on December 30, 2022. After a year where stocks dropped and bonds fell simultaneously, VTI had drifted down to 48.4% (from the 50% target) and BND was up to 31.4%. The rebalance bought VTI and sold BND — essentially buying stocks while they were down. That's the mechanical discipline rebalancing provides, and backtesting lets you see every single instance of it.
You'll compare strategies with data, not opinions
Everyone has an opinion on whether a 60/40 is better than an 80/20, or whether you should rebalance quarterly vs. annually. Backtesting replaces those opinions with numbers. Run both configurations, compare the results, and let the data inform your decision.
The Limitations of Backtesting
Backtesting is powerful, but it has real limitations you need to understand. Being honest about these is what separates informed investors from those chasing past performance.
Past performance does not guarantee future results
This is the most fundamental limitation, and it's not just a legal disclaimer. Markets change. Interest rates shift. New asset classes emerge. A strategy that delivered 12% CAGR over the last 15 years might deliver 6% over the next 15. Backtesting tells you what did happen, not what will happen.
Survivorship bias can distort results
If you backtest an ETF that exists today, you're only testing something that survived. The ETFs and funds that failed, were delisted, or merged aren't in the data. This creates a subtle upward bias — you're testing winners by definition.
Overfitting is a real risk
If you keep tweaking your allocation until you find the combination that performed best historically, you're not discovering a great strategy — you're curve-fitting to past data. The more parameters you optimize, the less likely the results will hold in the future. A good backtest validates a strategy you already believe in, rather than mining for the one that looks best in hindsight.
The start and end dates matter more than you think
A backtest starting in March 2009 (the absolute market bottom) will show spectacular results for almost any equity-heavy portfolio. A backtest starting in October 2007 (just before the financial crisis) will look dramatically different. Always test multiple time periods, and pay more attention to how the portfolio behaved during crises than to the final return number.
Not all backtesting data is created equal
This is a nuance most investors miss. Many backtesting tools use monthly data — 12 data points per year. This means they calculate returns month to month and miss everything that happens in between. The problem? Crashes don't wait for month-end. The COVID crash of March 2020 saw the S&P 500 drop over 30% in just 23 trading days. A monthly data tool might show a drawdown of -20% for that period, while a daily data tool captures the actual -34% drop.
The backtest shown in this article used 3,520 daily data points over 14 years — roughly 252 per year. That's a significant difference in precision, especially for risk metrics like max drawdown and volatility, which are extremely sensitive to data granularity.
Daily Data vs. Monthly Data: Why It Matters
This deserves its own section because it's one of the most misunderstood aspects of portfolio backtesting.
When a backtesting tool uses monthly data, it calculates your portfolio value once per month. Everything that happens between those monthly snapshots — every spike, every crash, every intraday panic — is invisible. The return numbers (CAGR, total return) will be roughly similar regardless of granularity, because the start and end points are the same. But the risk metrics will be dramatically different.
Consider max drawdown. If a portfolio drops 34% over three weeks and then recovers 8% by month-end, a monthly tool might show a drawdown of only -26%. The daily tool shows the real -34%. That's a massive difference when you're trying to understand your actual risk exposure.
The same applies to volatility. Monthly data smooths out the daily noise — but that "noise" is exactly what causes investors to panic and sell at the worst possible time. If your backtest doesn't show it, you're building a risk model that's more optimistic than reality.
This is why experienced investors and financial advisors increasingly prefer daily-resolution backtesting tools. The returns look similar, but the risk picture is fundamentally more accurate.
How to Run Your First Backtest
If you've never backtested a portfolio before, here's a practical step-by-step approach:
Start with a strategy you already believe in. Don't use backtesting to find the "best" portfolio — use it to validate or stress-test one you're already considering. If you're interested in a simple 3-fund approach, backtest that. If you want to compare it against a 60/40, run both.
Use a long time period. Aim for at least 10 years, ideally 15+. You want to capture at least two full market cycles — a bull market and a bear market. A 5-year backtest that only covers 2019–2024 will mostly reflect the post-COVID recovery and tell you very little about how the portfolio handles real stress.
Choose a realistic rebalancing strategy. Most DIY investors don't rebalance monthly. Annual or semi-annual rebalancing is more realistic and often performs comparably. Test what you'll actually do, not what sounds optimal in theory.
Set a meaningful benchmark. The S&P 500 (SPY) is the most common benchmark, and it's a good default. It gives you a reality check: if your diversified portfolio dramatically underperforms SPY over 15 years, you need to understand why — and whether the reduced risk was worth it for your situation.
Focus on risk metrics, not just returns. The first number most people look at is total return. Train yourself to look at max drawdown and Sharpe ratio first instead. A portfolio that returned 300% but had a -45% max drawdown is a fundamentally different experience than one that returned 200% with a -20% drawdown. Which one you can actually stick with matters more than which one "won."
Run multiple scenarios. Change the time period. Shift the allocation by 10%. Switch from annual to semi-annual rebalancing. Good backtesting isn't about finding a single "right" answer — it's about understanding the range of outcomes and the sensitivity of your strategy to different conditions.
Backtesting vs. Other Analysis Methods
Backtesting is one tool in a broader analytical toolkit. Here's how it relates to other common methods:
Backtesting vs. Monte Carlo simulation. Backtesting uses actual historical data — what really happened in the markets. Monte Carlo simulation generates thousands of random scenarios based on statistical assumptions (expected returns, volatility, correlations). Both are useful: backtesting tells you what did happen; Monte Carlo helps you understand the range of what could happen. They're complementary, not competing.
Backtesting vs. paper trading. Paper trading (or forward testing) means running a strategy in real time without real money. Backtesting looks backward; paper trading looks forward. The advantage of paper trading is that it eliminates look-ahead bias. The disadvantage is that it takes months or years to generate meaningful data. Backtesting gives you decades of data instantly.
Backtesting vs. fundamental analysis. Fundamental analysis evaluates a company's financial health — revenue, earnings, cash flow, valuation. Backtesting evaluates how a portfolio of assets performed as a system over time. They answer different questions: fundamentals tell you whether an individual asset is worth owning; backtesting tells you whether a combination of assets works well together.
Common Backtesting Mistakes to Avoid
If you're getting started with backtesting, these are the traps that catch most beginners:
Chasing the best historical return. If you run 50 different allocations and pick the one with the highest CAGR, you've just overfitted to the past. The "winning" portfolio in 2012–2026 might be the worst performer in 2026–2040.
Ignoring the drawdown. A portfolio that returned 15% CAGR with a -50% max drawdown will test your emotional limits in ways that spreadsheets can't prepare you for. If the drawdown scares you in a simulation, it will terrify you with real money.
Using too short a time period. A 3-year backtest is almost meaningless. Markets can do anything over 3 years. You need at least a full bull-bear cycle to draw useful conclusions.
Assuming the backtest accounts for everything. Most backtests don't include taxes, trading commissions, or bid-ask spreads. The real-world results will be slightly worse than what the simulation shows — especially if you're rebalancing frequently in a taxable account.
Testing a portfolio you'll never stick with. If a backtest shows that 100% small-cap value stocks outperformed everything else, but you'd sell in a panic during the first -40% drawdown, that strategy isn't for you. The best portfolio is the one you can actually hold through the bad years.
What to Look for in a Backtesting Tool
Not all backtesting tools are built the same. Here's what matters when choosing one:
Data granularity. Daily data is significantly more accurate than monthly data for risk metrics. If a tool only uses monthly data, your max drawdown and volatility numbers will be understated.
Transparency. Can you see how the calculations are done? Can you verify the data? A good tool shows you the number of data points used, the exact dates, and how dividends and rebalancing are handled.
Rebalancing options. At minimum, you want Buy & Hold and Constant Mix with different frequencies (monthly, quarterly, semi-annual, annual). Threshold-based rebalancing (rebalance only when drift exceeds a set percentage) is a valuable addition.
Risk metrics beyond total return. CAGR and total return are just the starting point. Look for Sharpe ratio, Sortino ratio, max drawdown, volatility, Calmar ratio, and ideally rolling metrics that show how these numbers change over time.
Benchmark comparison. You need to see your portfolio against a reference point. Without a benchmark, you can't tell whether your strategy added value or if you'd have been better off in a single index fund.
You can see how Awalyt approaches each of these — daily data, full rebalancing transparency, and AI-powered analysis — on the backtesting tool page.
The Bottom Line
Portfolio backtesting is not a crystal ball. It won't tell you what the market will do next year, and it won't find you the "perfect" allocation. What it will do is give you a grounded, data-driven understanding of how your chosen strategy has performed through real market conditions — the crashes, the recoveries, the boring sideways years, and the unexpected spikes.
For DIY investors, that understanding is invaluable. It replaces guesswork with evidence. It turns "I think I can handle a downturn" into "I've seen exactly what a -25% drawdown looks like for this portfolio, and I'm okay with it." And it reveals the tradeoffs that every allocation involves — because every portfolio has tradeoffs, and the only question is whether you've seen them before they happen.
The best time to discover that your portfolio drops 30% in a crisis is in a simulation. Not with your actual savings.
Want to test these insights on your own portfolios?
Awalyt is a portfolio analysis platform: backtesting on daily data, fundamental analysis, asset analysis, and AI-powered insights.
Get Started FreeRelated Insights
Backtesting a Portfolio: 6 Common Mistakes and How to Avoid Them [2026]
11 min read
Daily vs Monthly Data in Backtesting — Does It Matter? [2026]
11 min read
Does Rebalancing Actually Improve Returns? We Tested the All Weather Portfolio Over 16 Years [2026]
13 min read