Does Rebalancing Actually Improve Returns? We Tested the All Weather Portfolio Over 16 Years [2026]
Every investing article says you should rebalance your portfolio. Once a year, sell what's gone up, buy what's gone down, bring everything back to your target weights. It's one of those pieces of advice that sounds so obvious that nobody questions it.
But here's the thing nobody tells you: rebalancing often reduces your total return. Not always — but in many real-world scenarios, a portfolio that's never touched outperforms the one that's diligently rebalanced every year.
So why does everyone recommend it? Is it just tradition? Is it wrong?
We ran the numbers on one of the most famous diversified portfolios in investing — Ray Dalio's All Weather Portfolio — to find out exactly what rebalancing does and doesn't do. The answer is more nuanced than either side admits.
Disclaimer: This article is for educational and informational purposes only. It does not constitute investment advice. Past performance does not guarantee future results. Always do your own research before making any investment decisions.
The Portfolio: Ray Dalio's All Weather
The All Weather Portfolio is designed to perform reasonably well across all economic environments — growth, recession, inflation, and deflation. It does this by spreading risk across asset classes that respond differently to economic conditions.
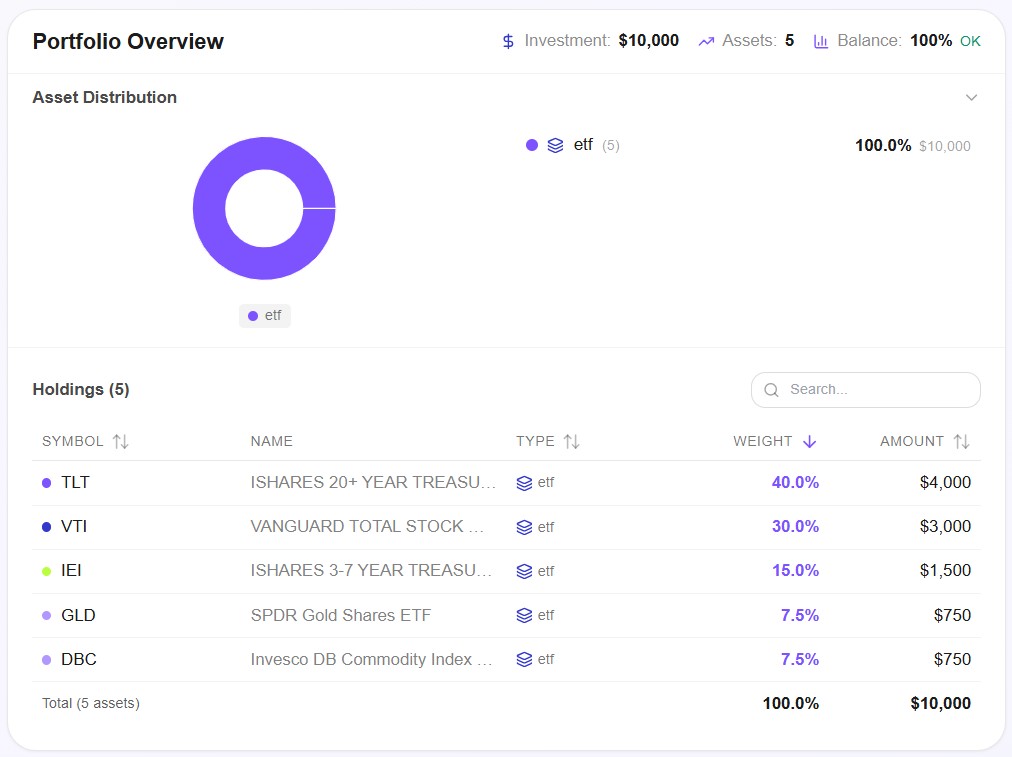
| ETF | Name | Weight | Role |
|---|---|---|---|
| TLT | iShares 20+ Year Treasury Bond | 40% | Long-term bonds |
| VTI | Vanguard Total US Stock Market | 30% | US equities |
| IEI | iShares 3-7 Year Treasury Bond | 15% | Intermediate bonds |
| GLD | SPDR Gold Shares | 7.5% | Gold / inflation hedge |
| DBC | Invesco DB Commodity Index | 7.5% | Commodities |
The allocation is deliberately bond-heavy — 55% in fixed income (TLT + IEI). This isn't a growth portfolio. It's a risk-managed portfolio designed to avoid catastrophic drawdowns while still capturing reasonable returns across market cycles.
This makes it an ideal test case for the rebalancing question. With five asset classes that move in different directions, rebalancing has plenty of opportunity to either add or destroy value.
The Test: Rebalance vs. Don't Touch It
We ran two identical backtests on Awalyt using the same portfolio, same time period, and same benchmark:
- Period: April 2010 to April 2026 — 16 full years
- Initial investment: $10,000
- Benchmark: SPY (S&P 500)
- Data: 4,023 daily data points
The only difference was the strategy:
- Backtest 1: Constant Mix with annual rebalancing — every year, the portfolio is brought back to the target weights
- Backtest 2: Buy & Hold — invest once and never rebalance
Same starting point, same assets, same allocation on day one. Sixteen years later, which approach wins?
The Results: Buy & Hold Returned More
Let's start with the number most people look at first.
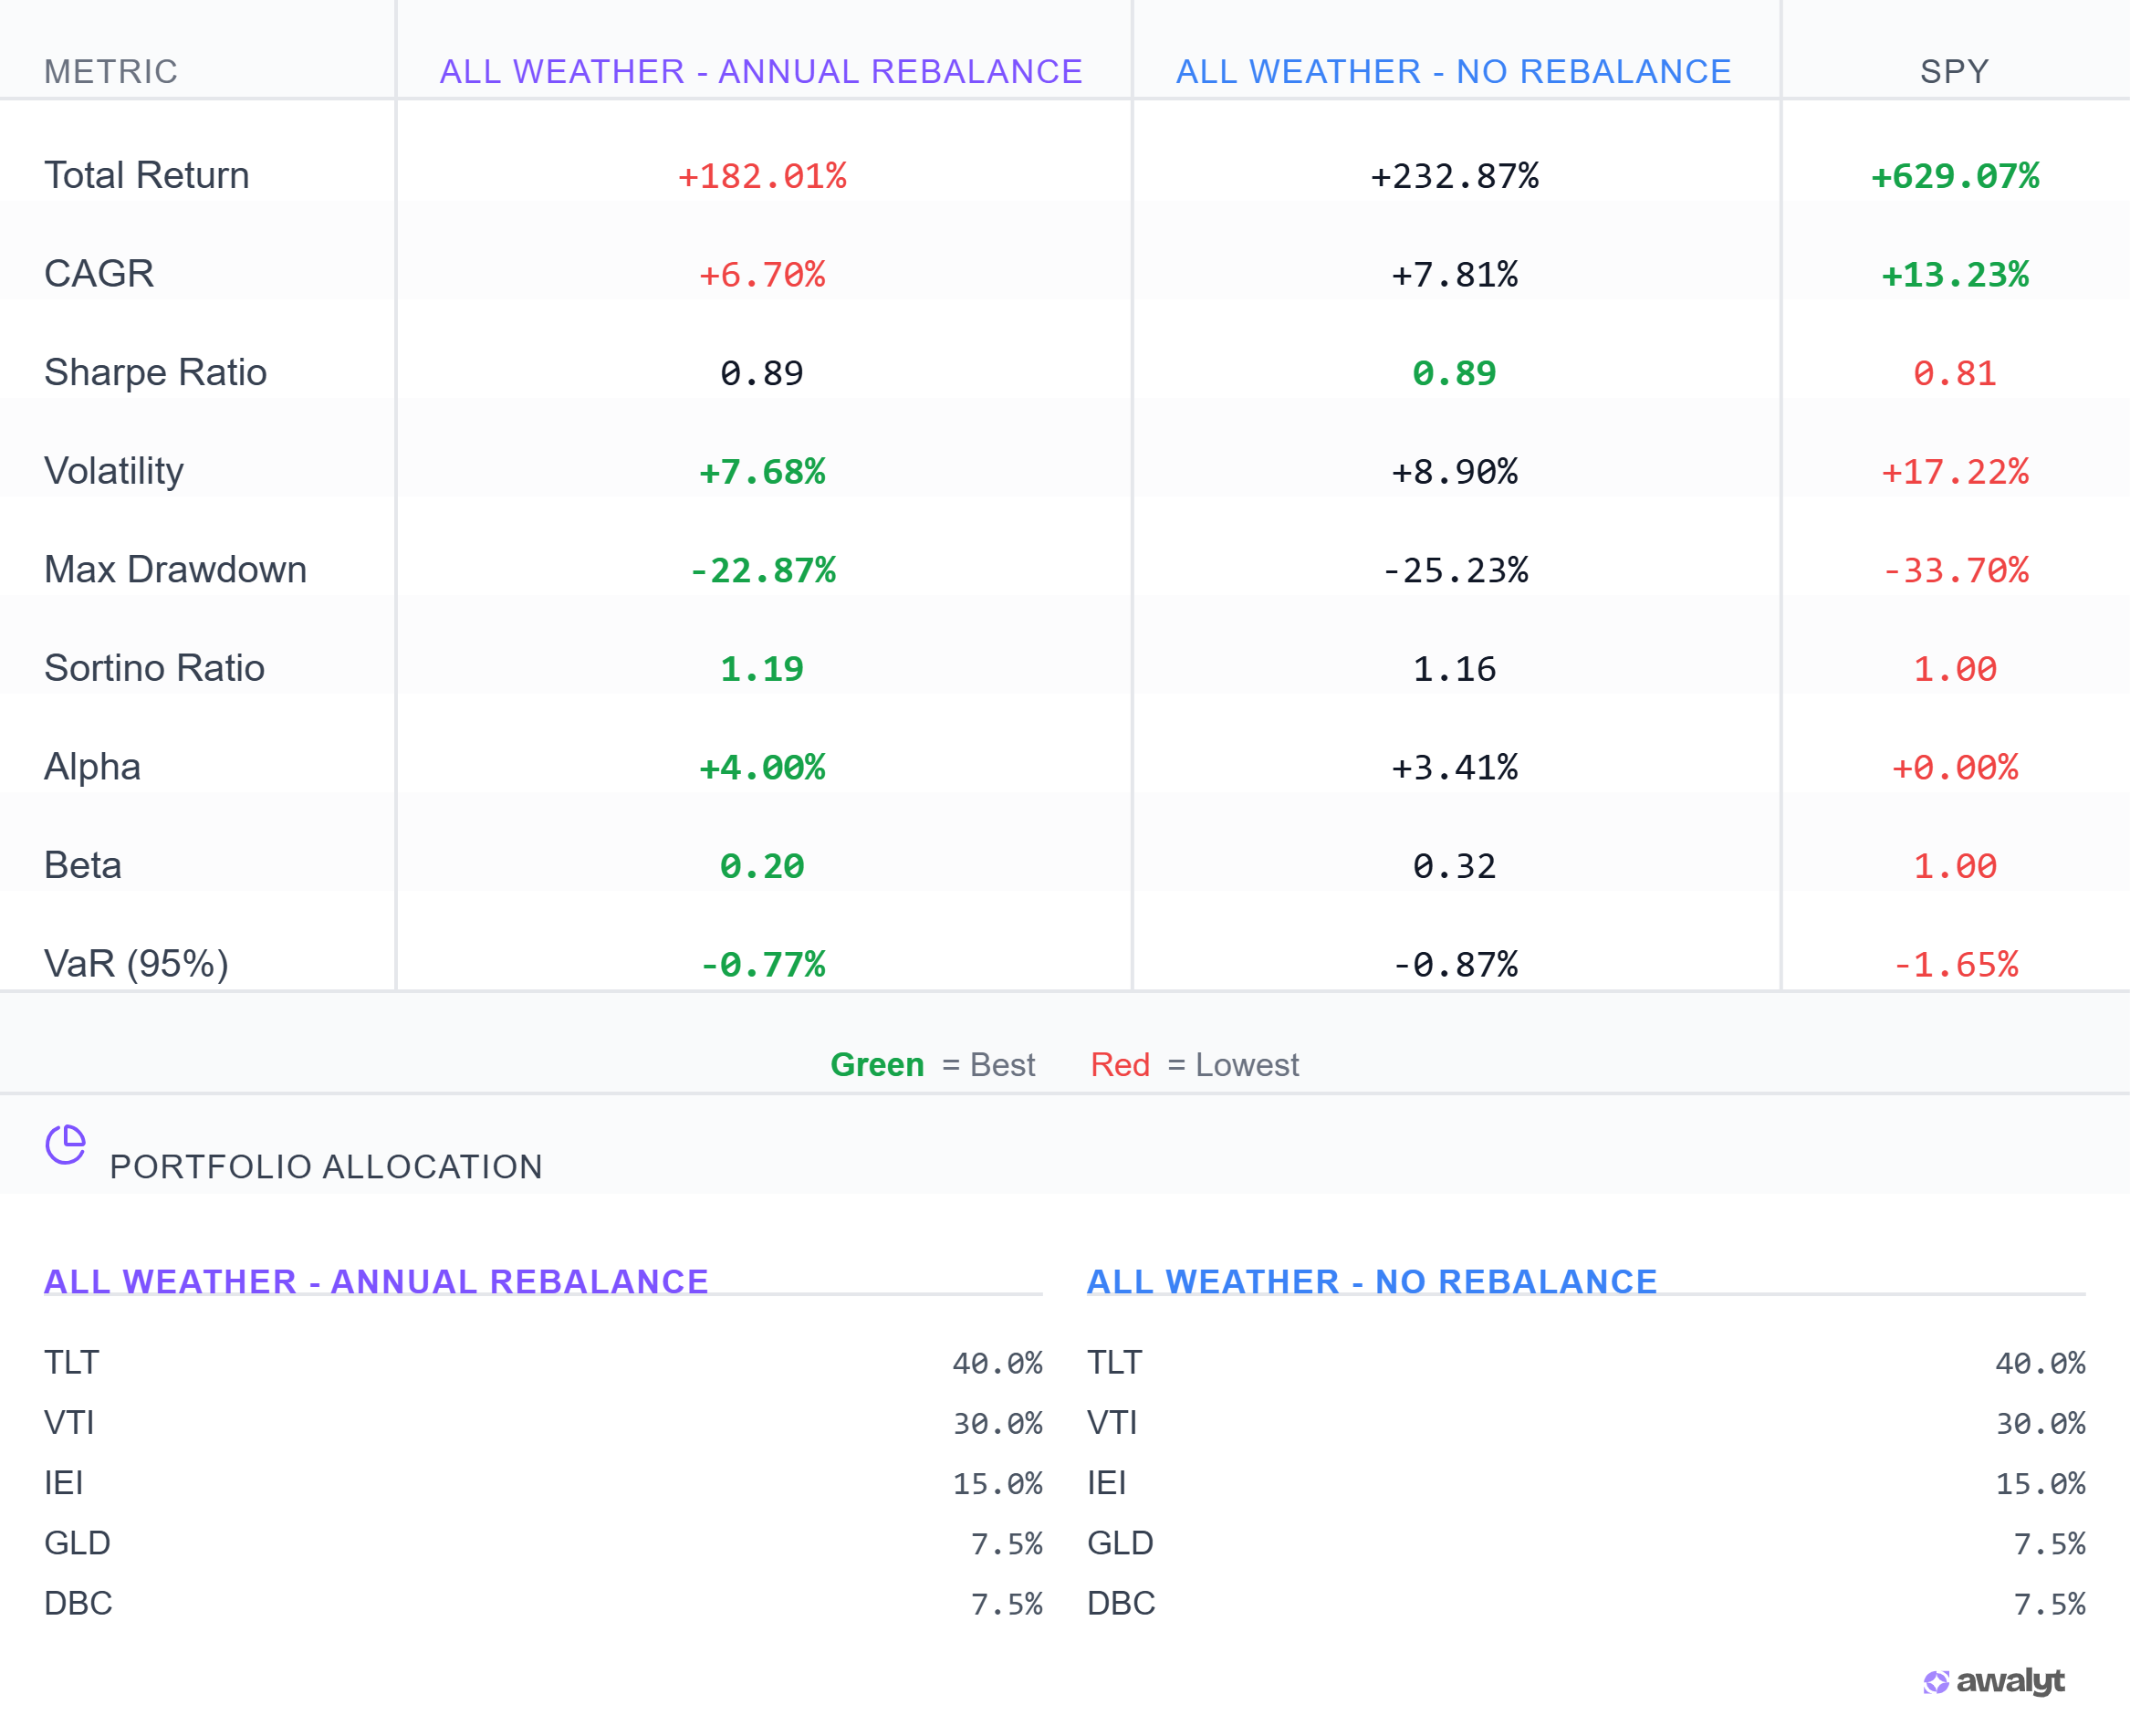
| Metric | Annual Rebalance | No Rebalance | SPY |
|---|---|---|---|
| Total Return | +182.01% | +232.87% | +629.07% |
| CAGR | 6.70% | 7.81% | 13.23% |
| Sharpe Ratio | 0.89 | 0.89 | 0.81 |
| Volatility | 7.68% | 8.90% | 17.22% |
| Max Drawdown | -22.87% | -25.23% | -33.70% |
| Sortino Ratio | 1.19 | 1.16 | 1.00 |
| Alpha | +4.00% | +3.41% | 0.00% |
| Beta | 0.20 | 0.32 | 1.00 |
| VaR (95%) | -0.77% | -0.87% | -1.65% |
The Buy & Hold portfolio returned +232.87% versus the rebalanced portfolio's +182.01%. That's a difference of over 50 percentage points — or about $5,000 on a $10,000 investment. In dollar terms: $33,287 versus $28,201.
If you stopped reading here, you'd conclude that rebalancing costs you money. And in terms of raw return, you'd be right.
But look at the rest of the table. That's where the real story is.
The Sharpe Ratio Tells the Real Story
The most important number in this entire comparison is the Sharpe ratio: 0.89 for both portfolios. Identical.
This means that on a risk-adjusted basis, both strategies delivered exactly the same performance. The Buy & Hold version earned more return — but it took on proportionally more risk to get there. The rebalanced version earned less — but with proportionally less risk.
Think of it this way: the Buy & Hold version is like driving 120 km/h on the highway. The rebalanced version is driving 100 km/h. You arrive later, but you also had a much lower chance of an accident. The "efficiency" of the drive — distance per unit of risk — was the same.
Here's what rebalancing actually changed:
Volatility dropped from 8.90% to 7.68%. That's a 14% reduction in day-to-day portfolio swings. On a $100,000 portfolio, this is the difference between typical daily fluctuations of $890 and $768. Over 252 trading days per year, that smoother ride compounds into a meaningfully different emotional experience.
Max drawdown dropped from -25.23% to -22.87%. On a $100,000 portfolio, that's the difference between watching your account hit $74,770 versus $77,130 at the worst point. Nearly $2,400 of additional loss that rebalancing prevented.
Beta dropped from 0.32 to 0.20. The rebalanced portfolio moved at roughly one-fifth the intensity of the S&P 500. The unrebalanced version drifted to one-third. Why? Because without rebalancing, VTI (the equity component) grew and became an increasingly larger share of the portfolio, pulling the overall beta higher.
Alpha increased from +3.41% to +4.00%. The rebalanced version generated more excess return per unit of market risk, precisely because it kept the equity exposure in check.
What Happens When You Don't Rebalance
The performance comparison chart shows exactly where and why the two strategies diverged:
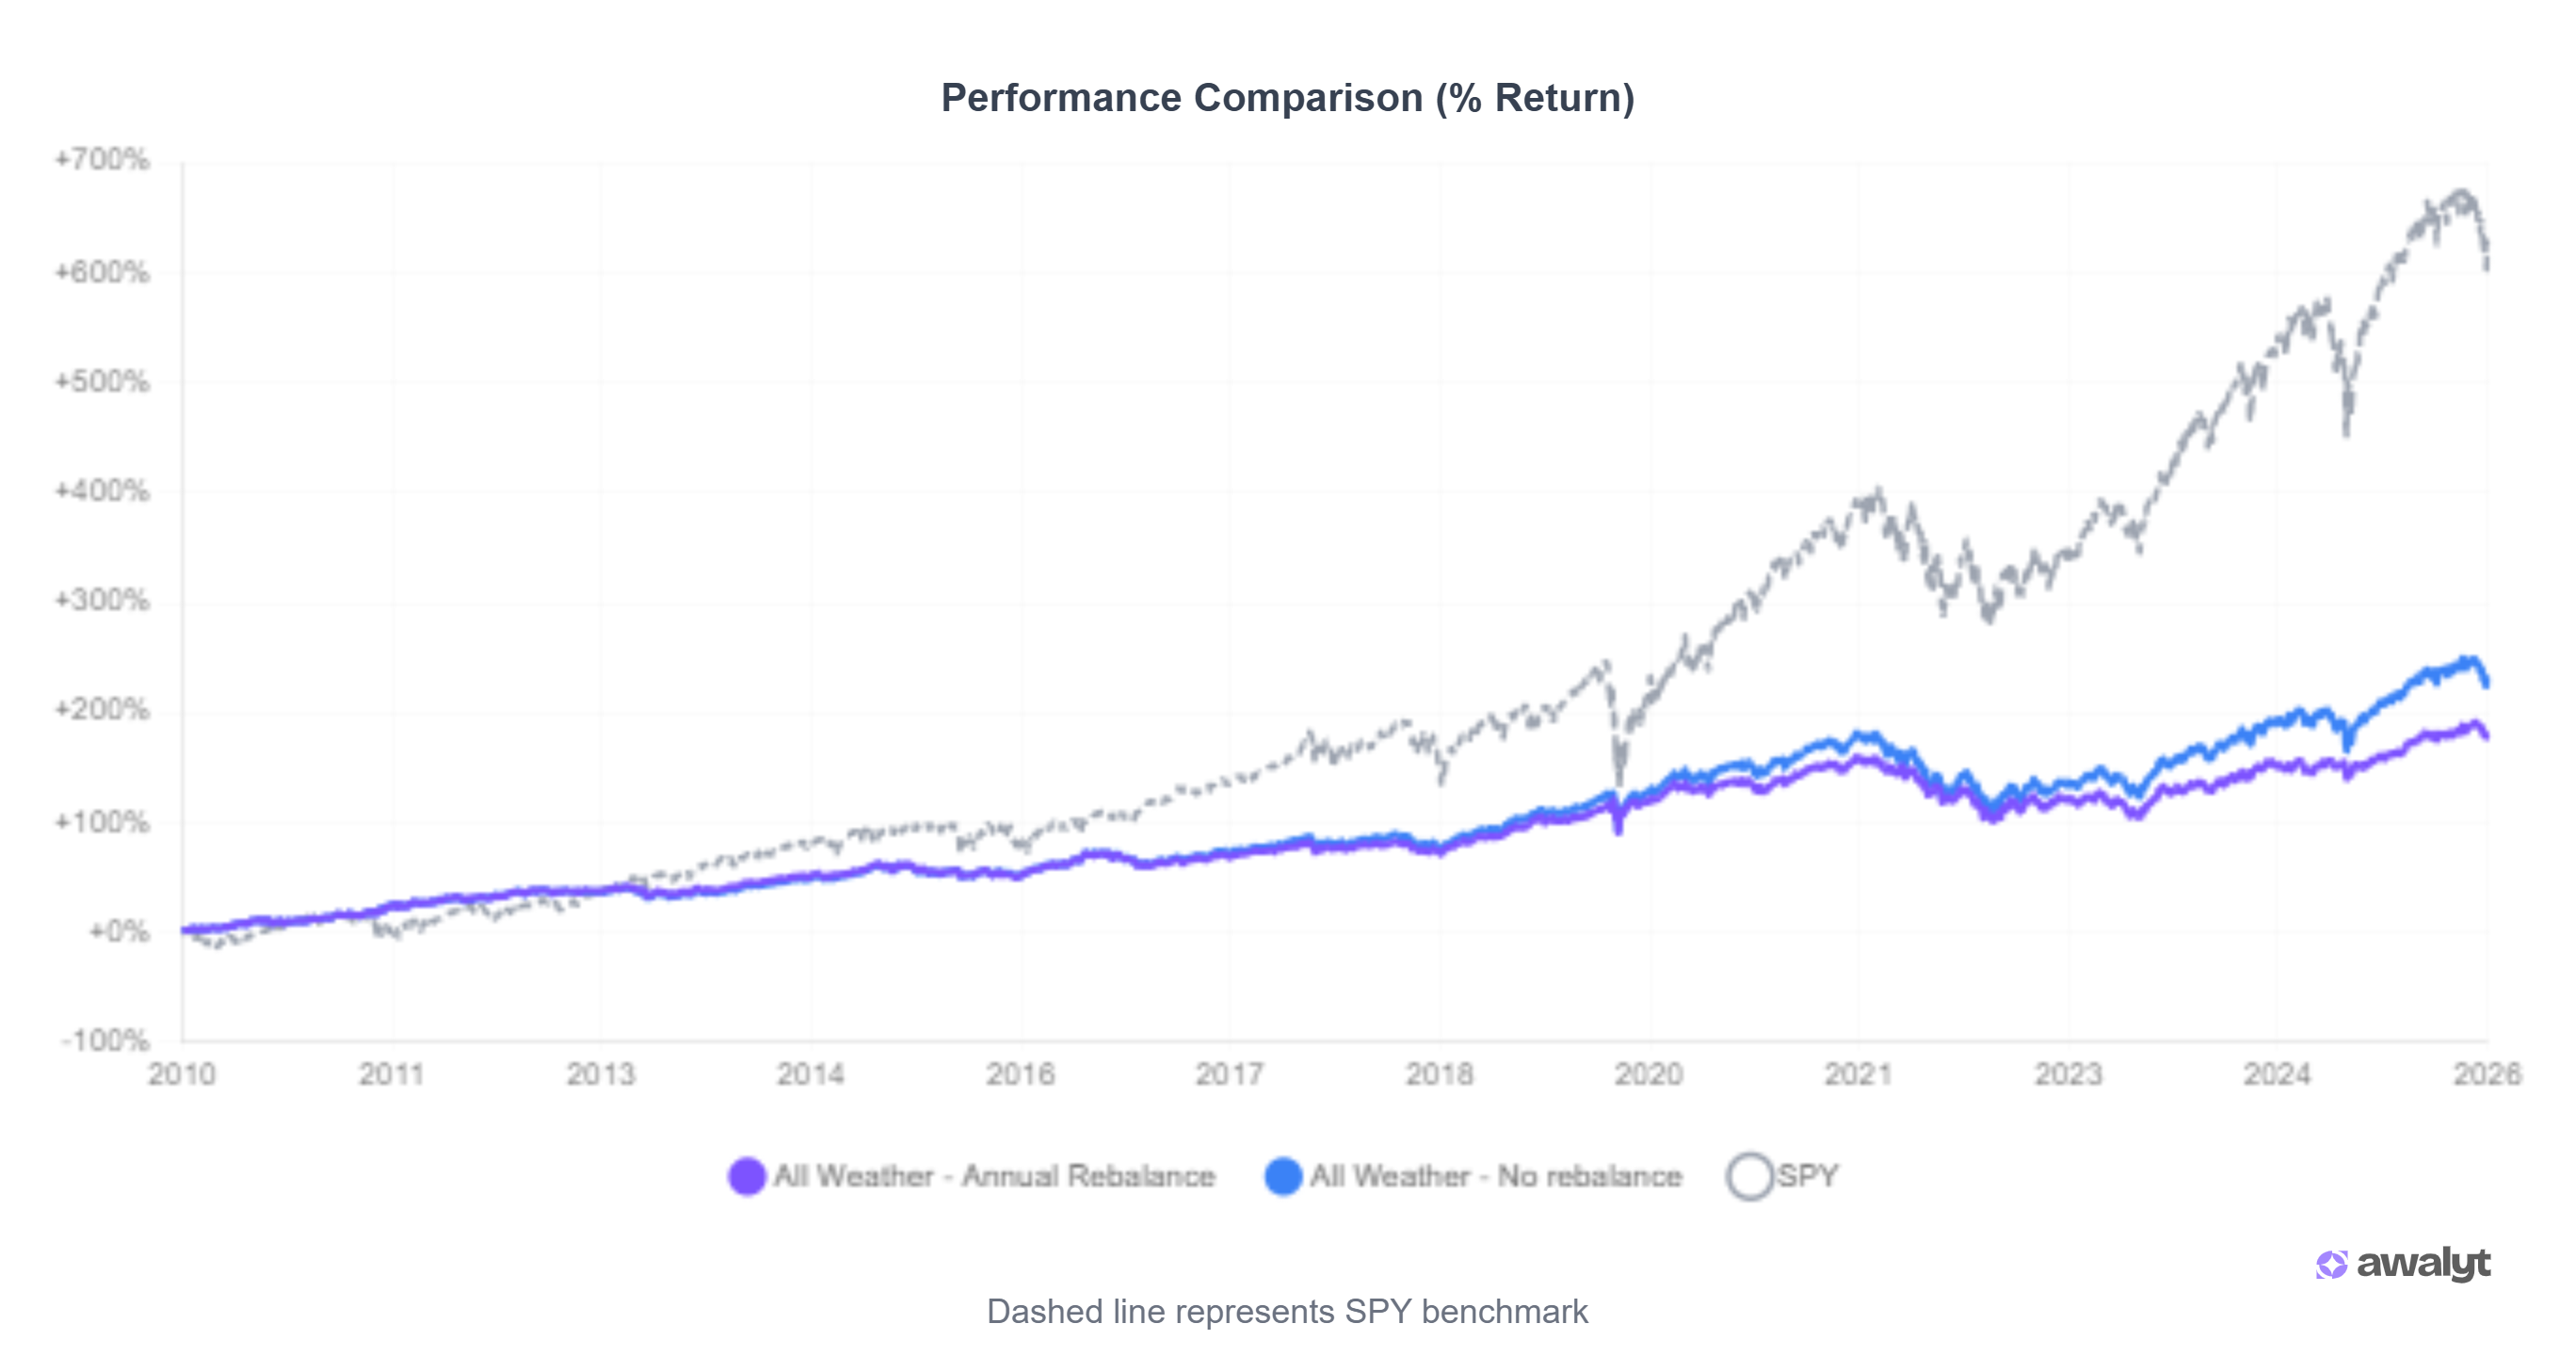
For the first eight years (2010–2018), the two lines are nearly indistinguishable. Both portfolios behave almost identically because the allocation hasn't drifted far from the original weights.
The divergence begins around 2019–2020. By this point, the Buy & Hold portfolio has drifted significantly from its target allocation. VTI, having outperformed bonds over the previous decade, now represents a much larger share of the portfolio than the original 30%. The portfolio is no longer the All Weather allocation — it's become something different, something more equity-heavy.
This equity drift is exactly why the Buy & Hold version returned more. In a period where US stocks massively outperformed bonds and commodities, allowing the equity allocation to grow unchecked naturally led to higher total returns. But it also meant the portfolio was no longer doing what it was designed to do — provide balanced exposure across economic environments.
The 2022 Stress Test: Where Rebalancing Earned Its Keep
The 2022 bear market is where the difference between rebalancing and not rebalancing becomes viscerally clear.
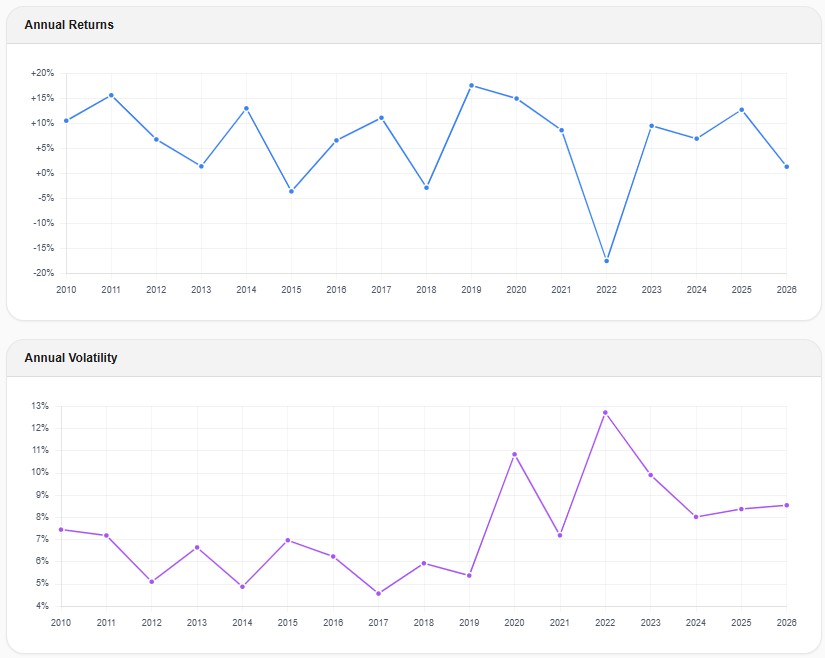
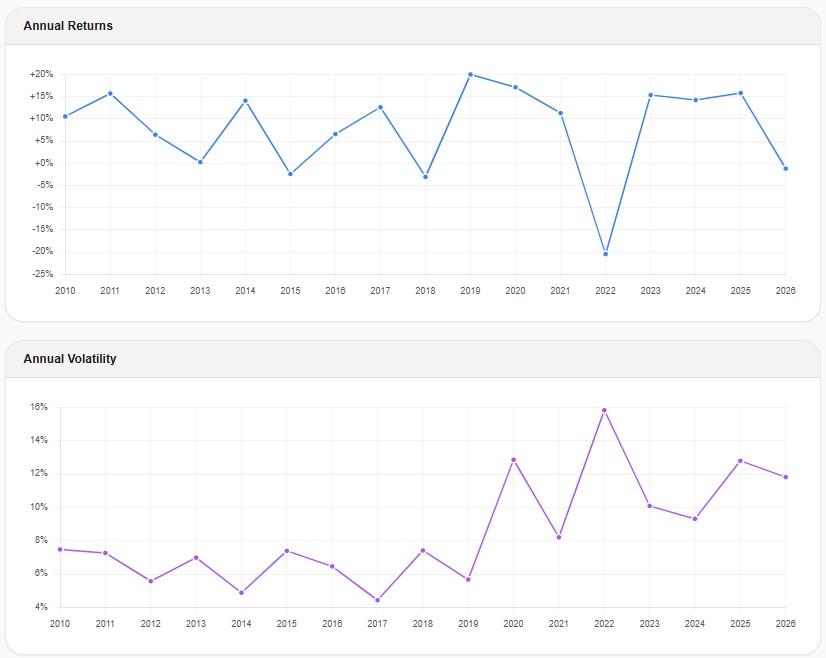
Look at 2022 in both charts. The rebalanced version dropped roughly -18%. The unrebalanced version dropped roughly -22%. That's a 4-percentage-point difference in a single year — and in 2022, where stocks and bonds fell simultaneously, every percentage point of additional drawdown tested investors' resolve.
The volatility charts tell the same story. The rebalanced portfolio's annual volatility peaked at about 13% during 2022. The unrebalanced version hit about 15%. The Buy & Hold portfolio had drifted to a higher equity weight by 2022, which amplified its sensitivity to the stock market selloff.
This is the mechanism that makes rebalancing valuable. It doesn't boost returns — it prevents your portfolio from silently transforming into something riskier than what you originally signed up for.
Inside the Rebalancing Log: What Actually Happens at Each Rebalance
Here's something most backtesting tools never reveal: the specific trades that occur at each rebalancing event.
When a tool says "annual rebalancing," it's executing buy and sell trades at each checkpoint. But most tools treat this as a black box — you see the result, never the transactions. This is a problem because the trades themselves tell you whether the rebalancing is doing something intelligent or just generating turnover.
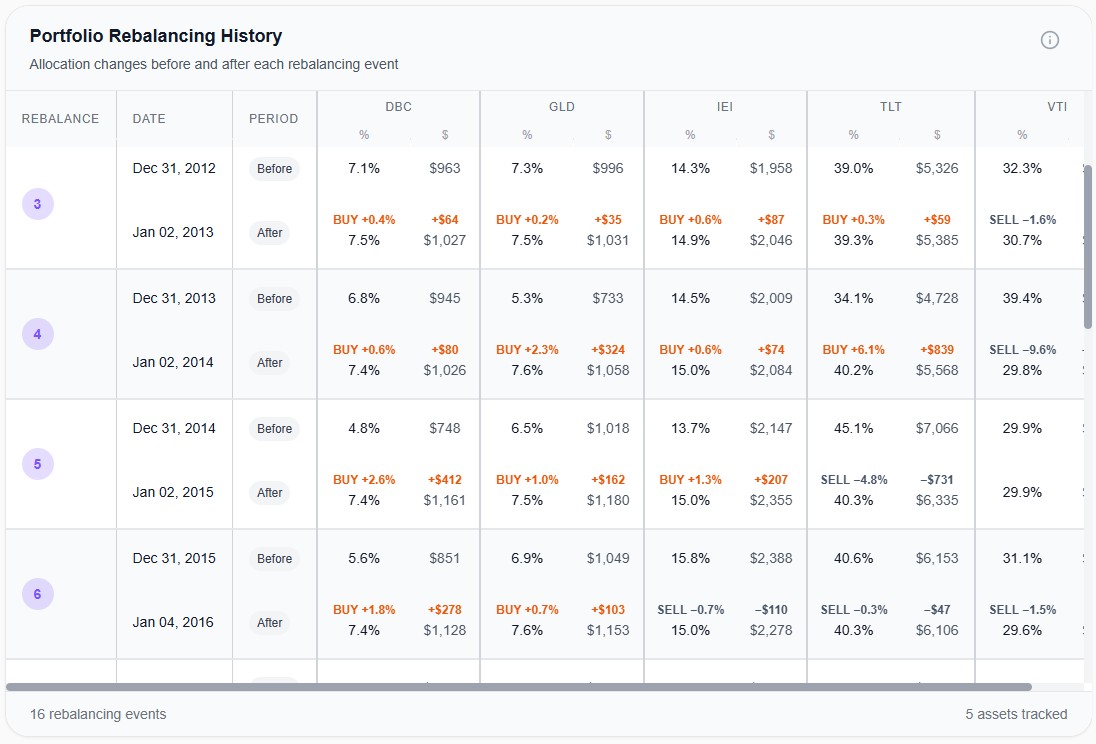
Look at the pattern in this rebalancing history. Every single year, the same thing happens: VTI gets sold, and everything else gets bought.
At the December 2013 rebalance, VTI had drifted from 30% to 39.4% of the portfolio — nearly 10 percentage points above its target. The rebalancing sold $1,317 of VTI (a -9.6% weight reduction) and used that capital to buy TLT (+$839), GLD (+$324), DBC (+$80), and IEI (+$74). It was mechanically selling the asset that had performed best and redistributing into the ones that had lagged.
At the December 2014 rebalance, TLT had grown to 45.1% — over 5 percentage points above its target — because bonds rallied that year. The system sold $731 of TLT and bought DBC (+$412), IEI (+$207), and GLD (+$162). When the top performer shifts, the rebalancing adapts.
This is the "sell high, buy low" mechanism in action. Not as a slogan — as documented transactions with exact dollar amounts. Each trade is small. No single rebalance is dramatic. But over 16 years and 16 rebalancing events, these disciplined adjustments compound into measurably lower risk.
The question is: would you make these trades yourself, without a systematic framework forcing you to? When VTI is up 30% in a year and TLT is down 15%, the emotionally natural thing is to let the winner ride and avoid the loser. Rebalancing does the opposite — and that mechanical discipline is the source of its risk reduction.
Why Did Buy & Hold Return More?
This is the question that trips up most investors, so let's be precise about the mechanism.
The All Weather Portfolio starts at 30% equities (VTI). Over 16 years of stock market outperformance, that 30% allocation grows disproportionately. By 2025, without rebalancing, VTI might represent 45% or even 50% of the portfolio. TLT, meanwhile, having suffered through the worst bond bear market in decades, might have shrunk to 25% or less.
The portfolio is no longer 30/40/15/7.5/7.5. It's become something like 45/25/12/10/8 — a fundamentally different portfolio with much higher equity exposure that just happens to share the same starting point as the original All Weather allocation.
Higher equity exposure in a period where equities significantly outperformed everything else naturally leads to higher total returns. The Buy & Hold version "won" not because avoiding rebalancing is a better strategy, but because it accidentally took on more equity risk during a period where equities happened to do well.
If the next 16 years are different — if bonds outperform, or if equities deliver average returns instead of exceptional ones — the same drift mechanism could easily work in reverse. The Buy & Hold portfolio, having drifted to higher equity, would suffer more in a stock downturn. The rebalanced version, having maintained its defensive allocation, would hold up better.
Rebalancing is not a return strategy. It's a risk management strategy. And the identical Sharpe ratios prove it: the risk-adjusted performance was the same. The only question is whether you prefer higher returns with higher risk, or lower returns with lower risk. Rebalancing gives you the latter.
Both Versions Beat SPY on Risk-Adjusted Metrics
Before dismissing the All Weather Portfolio's lower absolute returns, look at it relative to SPY:
SPY returned +629.07% versus All Weather's +182% (rebalanced) or +232% (unrebalanced). On raw return, it's not even close. But raw return is only half the picture.
SPY's max drawdown was -33.70% — nearly 50% deeper than the rebalanced All Weather's -22.87%. Its volatility was 17.22% — more than double. And the Sharpe ratio? SPY delivered 0.81 versus All Weather's 0.89. The All Weather Portfolio generated better risk-adjusted returns than the S&P 500 over 16 years, despite massively underperforming on total return.
This is why the All Weather Portfolio exists. It's not trying to beat the S&P 500. It's trying to deliver the smoothest possible ride through any economic environment. And on that measure, it delivered — with roughly half the volatility and a third less drawdown than going all-in on US equities.
When Rebalancing Helps Most (and When It Doesn't Matter Much)
Based on this analysis and broader backtesting research, here's when rebalancing makes the biggest difference:
Rebalancing helps most when your portfolio has assets with genuinely different return profiles. The more different your assets behave — stocks vs bonds vs gold vs commodities — the more rebalancing has to work with. It captures the "mean reversion" effect across uncorrelated asset classes, systematically selling high and buying low.
Rebalancing helps most when you need risk consistency over time. If you've chosen a portfolio based on a specific risk tolerance — say, "I can handle a 20% drawdown but not 30%" — rebalancing keeps your portfolio within those bounds. Without it, allocation drift can silently push you beyond your comfort zone.
Rebalancing matters less when your portfolio is highly concentrated in a single asset class. A 90/10 stocks/bonds portfolio doesn't drift as dramatically as a 30/40/15/7.5/7.5 five-asset allocation, simply because there's less diversity to rebalance across.
Rebalancing matters less when the dominant asset class outperforms consistently for long periods. In a sustained equity bull market like 2010–2025, rebalancing keeps pulling money out of the winner. This reduces risk — which is the point — but it also reduces returns in that specific market environment.
The Tax Angle: Rebalancing in Taxable Accounts
There's one dimension this backtest doesn't capture: taxes. Every rebalancing trade in a taxable account is potentially a taxable event. Selling VTI after it's gained 30% means realizing capital gains and paying taxes on that gain.
In a tax-advantaged account (IRA, 401k), rebalancing has no tax cost. Rebalance as often as you want — annually is the standard recommendation, and this backtest supports it.
In a taxable account, the calculus changes. Each rebalancing trade has a tax drag that compounds over time. Some practical approaches to reduce this friction: rebalance by directing new contributions to underweight asset classes rather than selling overweight ones. Use tax-loss harvesting when available. Increase the rebalancing tolerance threshold — rather than rebalancing to exact targets, only rebalance when an asset drifts more than 5% from its target weight.
The Bottom Line
Does rebalancing improve returns? In this 16-year test of the All Weather Portfolio, no. The rebalanced version returned +182% versus +232% for Buy & Hold — a significant gap.
But that's the wrong question. Rebalancing doesn't try to improve returns. It tries to maintain the risk profile you chose when you built your portfolio. And on that measure, it worked precisely as designed: lower volatility (7.68% vs 8.90%), shallower drawdowns (-22.87% vs -25.23%), lower beta (0.20 vs 0.32), and higher alpha (+4.00% vs +3.41%).
The identical Sharpe ratios — 0.89 for both — prove that neither strategy was "better" in absolute terms. They represent different points on the same risk-return tradeoff. Rebalancing gives you a smoother, more predictable ride. Not rebalancing gives you higher returns with higher risk.
The real value of rebalancing isn't in the numbers. It's in the discipline. It forces you to sell what's gone up and buy what's gone down — the opposite of what human psychology wants to do. It prevents your portfolio from silently drifting into something riskier than what you signed up for. And when the next bear market arrives, the difference between a -23% drawdown and a -25% drawdown might be exactly the margin between staying invested and panic-selling at the bottom.
The best time to decide your rebalancing strategy is before you need it — when the data is calm, the charts are flat, and there's no emotion in the decision.
All backtest data shown in this article was generated using Awalyt's daily-granularity backtesting engine, which uses 252 data points per year. The rebalancing history log shows every trade at every rebalance point — a level of transparency most backtesting tools don't provide. Past performance does not guarantee future results. This content is educational and does not constitute financial advice.
Want to test these insights on your own portfolios?
Awalyt is a portfolio analysis platform: backtesting on daily data, fundamental analysis, asset analysis, and AI-powered insights.
Get Started FreeRelated Insights
Daily vs Monthly Data in Backtesting — Does It Matter? [2026]
11 min read
Bogleheads 3-Fund Portfolio vs S&P 500: A 14-Year Backtest with Real Data [2026]
14 min read
What Is Portfolio Backtesting? A Complete Guide for DIY Investors [2026]
12 min read