Test Your Portfolio Strategy Before You Invest a Single Dollar
Simulate any portfolio across years of daily market data. See real performance, real risk, and real rebalancing — not the smoothed-out version other tools show you.
Built for serious investors who want data-driven portfolio decisions.
Most Backtesting Tools Hide Your Real Risk
Here's what most portfolio backtesting tools don't tell you: they run on monthly data — just 12 data points per year. That means the crash that wiped 15% off your portfolio in a single week? Invisible. The volatility spike that would have triggered a panic sell? Smoothed away.
You're making real investment decisions based on a picture that hides 95% of what actually happened.
AWALYT runs on daily market data — 252 data points per year. Every drawdown, every volatility spike, every correlation shift shows up exactly as it happened. No smoothing. No surprises.
What You See with AWALYT Backtesting
Simulate portfolios with 252 data points per year
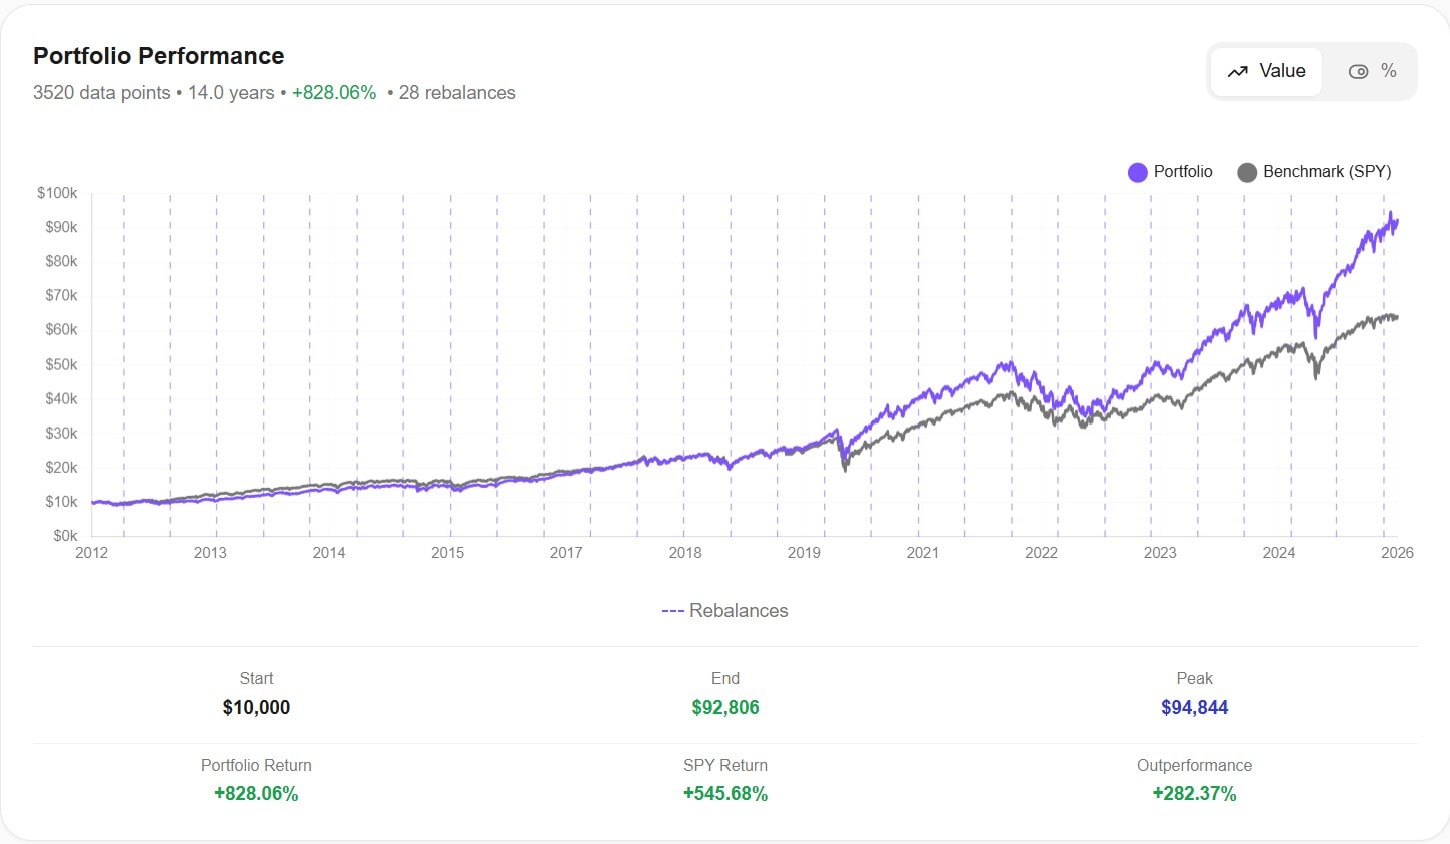
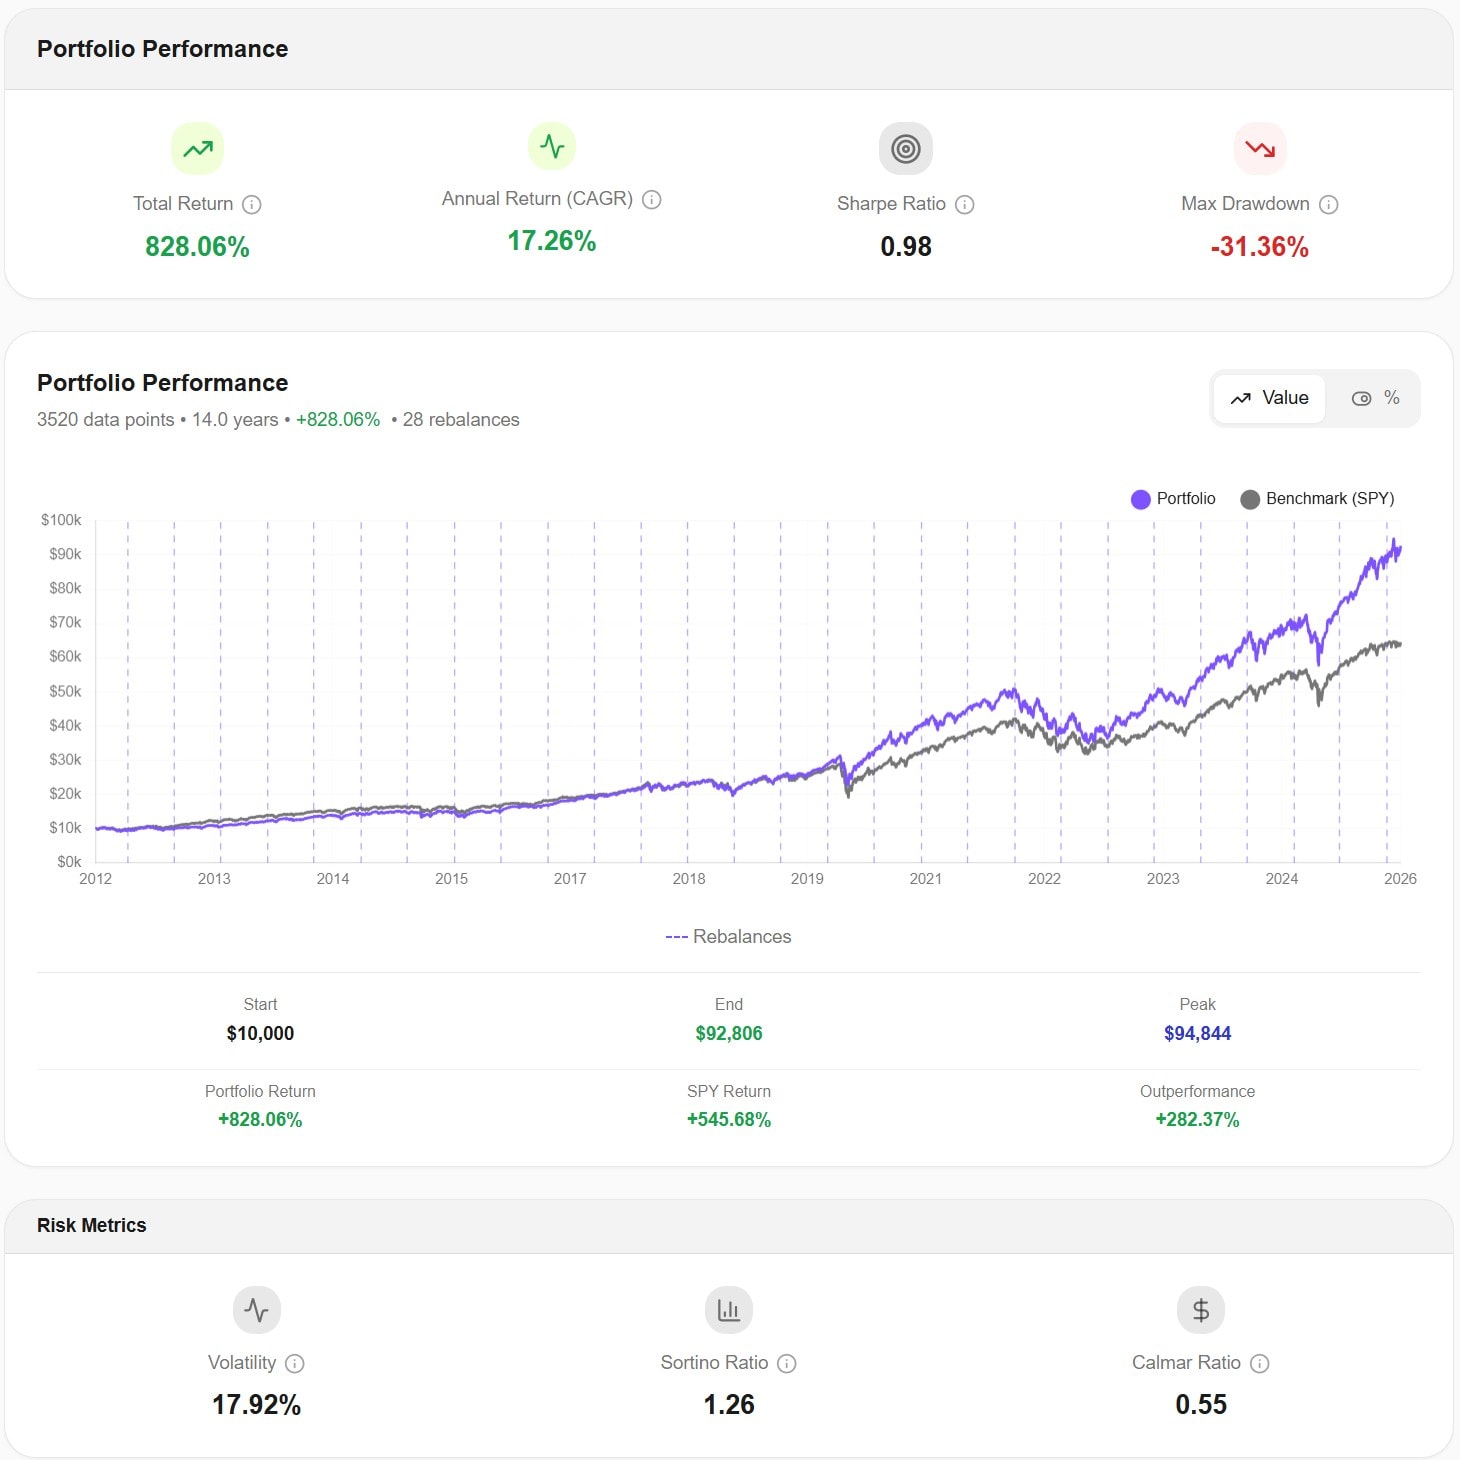
Build any portfolio with ETFs, stocks, or funds. Set your allocation, choose your rebalancing schedule, and run a simulation across years of real daily market data. Compare directly against benchmarks like SPY. See your actual CAGR, total return, peak value — all calculated from daily prices, not monthly approximations.
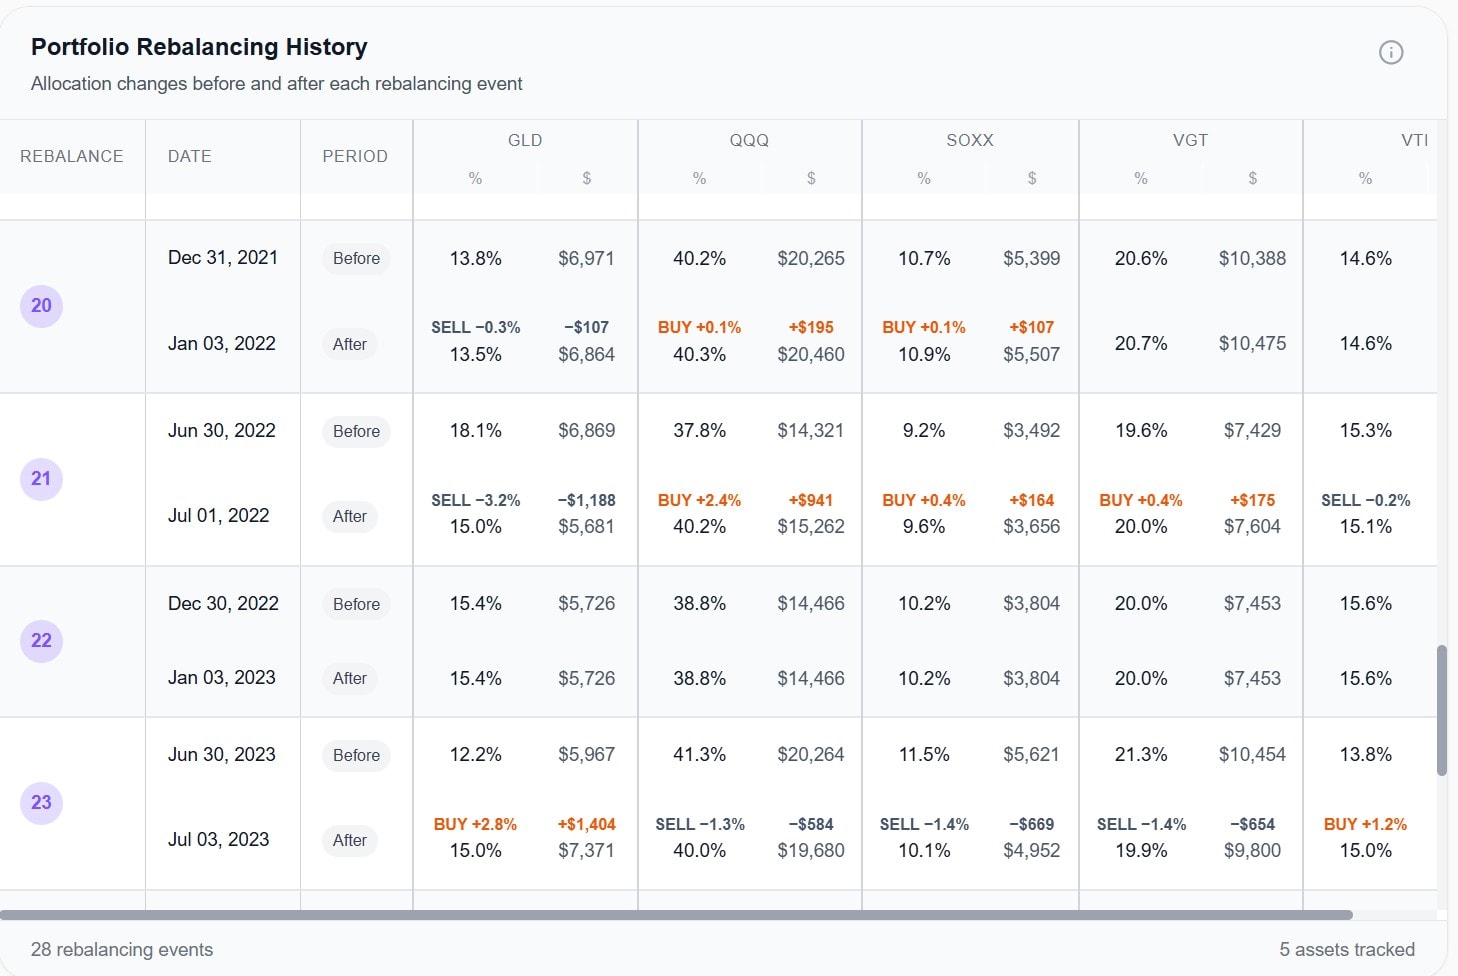
See every buy and sell at every rebalance
Most tools show you the end result. AWALYT shows you the journey. Every rebalancing event is logged with exact dollar amounts bought and sold for each asset — before and after. Understand the true operational cost of maintaining your strategy, and evaluate whether your rebalancing frequency is actually helping or hurting.
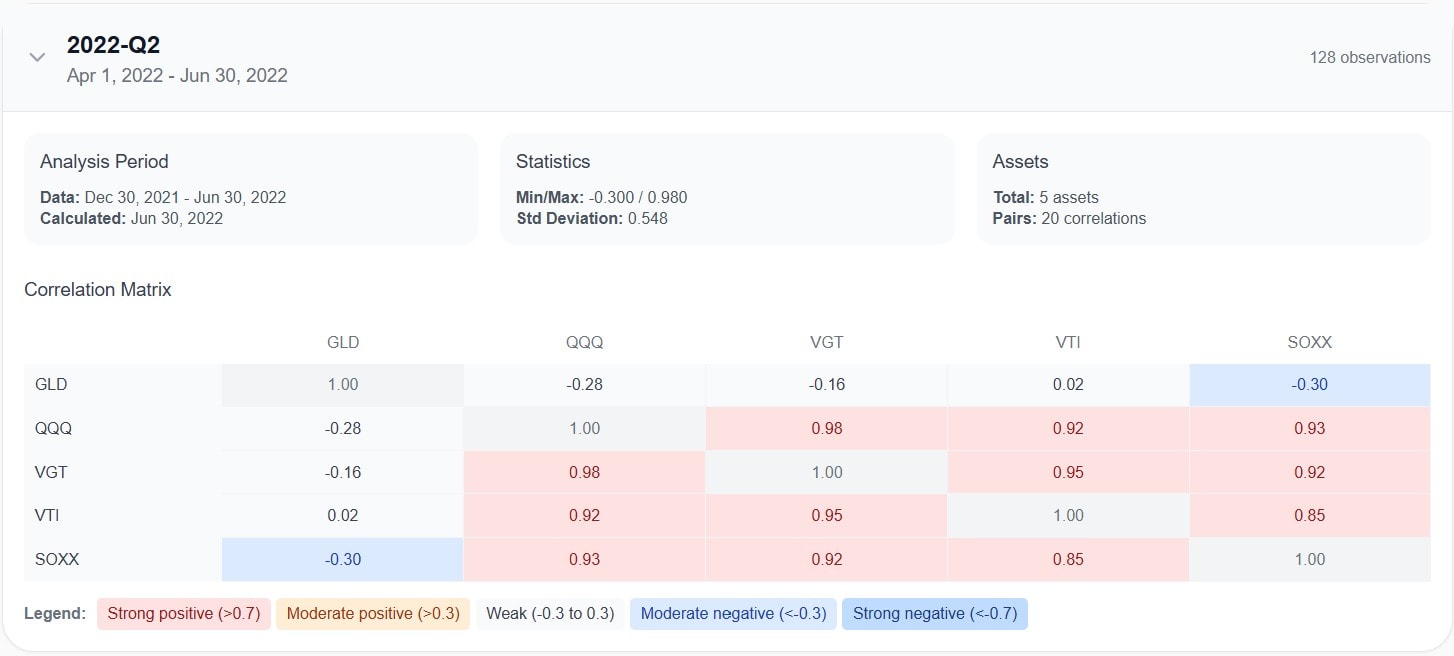
Watch your diversification change over time
A static correlation number is misleading. Asset correlations shift every quarter — and they tend to converge exactly when you need diversification the most. AWALYT calculates correlation matrices for every quarter in your backtest period, so you can see when your "diversified" portfolio was actually moving in lockstep.
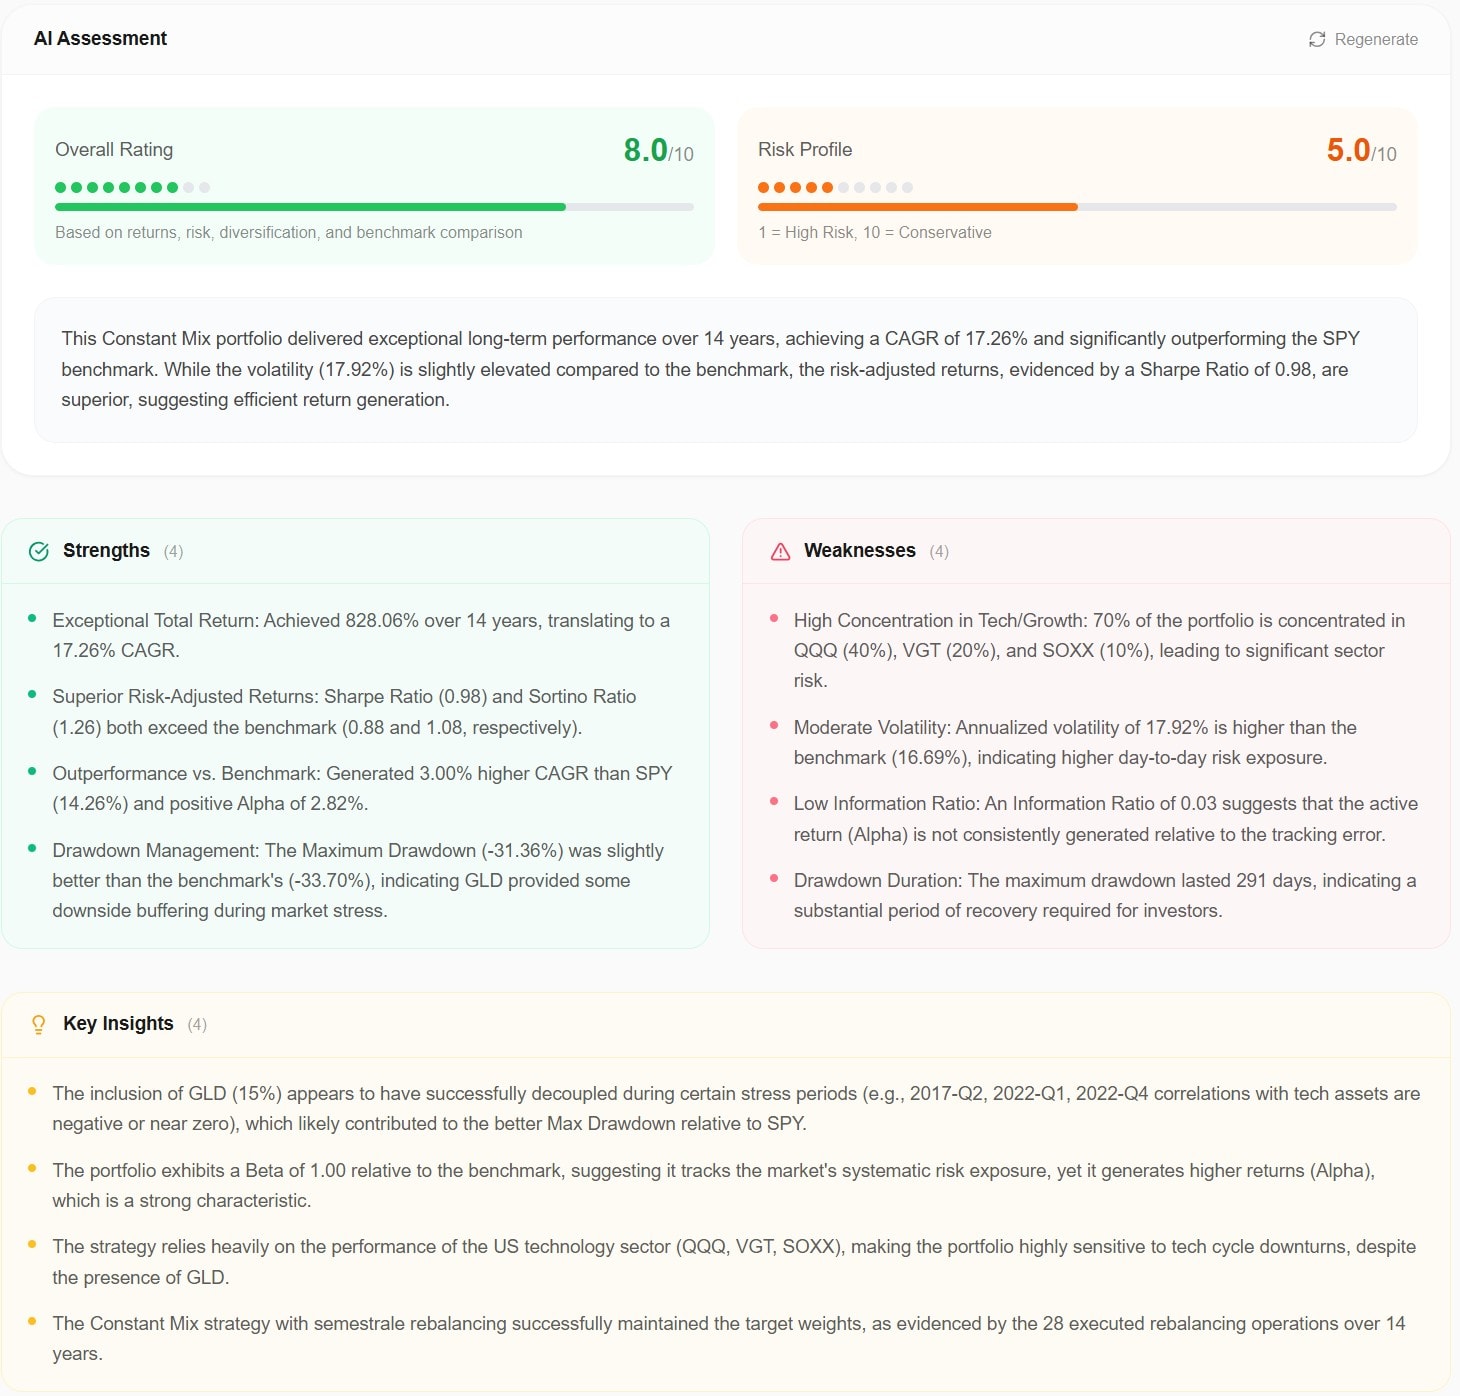
AI that explains your data, not makes it up
AWALYT's integrated AI reads the actual output of your backtest — real returns, real risk metrics, real correlations — and delivers a clear summary of strengths, weaknesses, and key insights. No generic advice. No hallucinated numbers. Every word is grounded in your actual simulation data.
Start Backtesting in 3 Steps
Build Your Portfolio
Choose your assets (ETFs, stocks, funds), set the allocation percentages, and pick your rebalancing frequency — monthly, quarterly, annually, or custom.
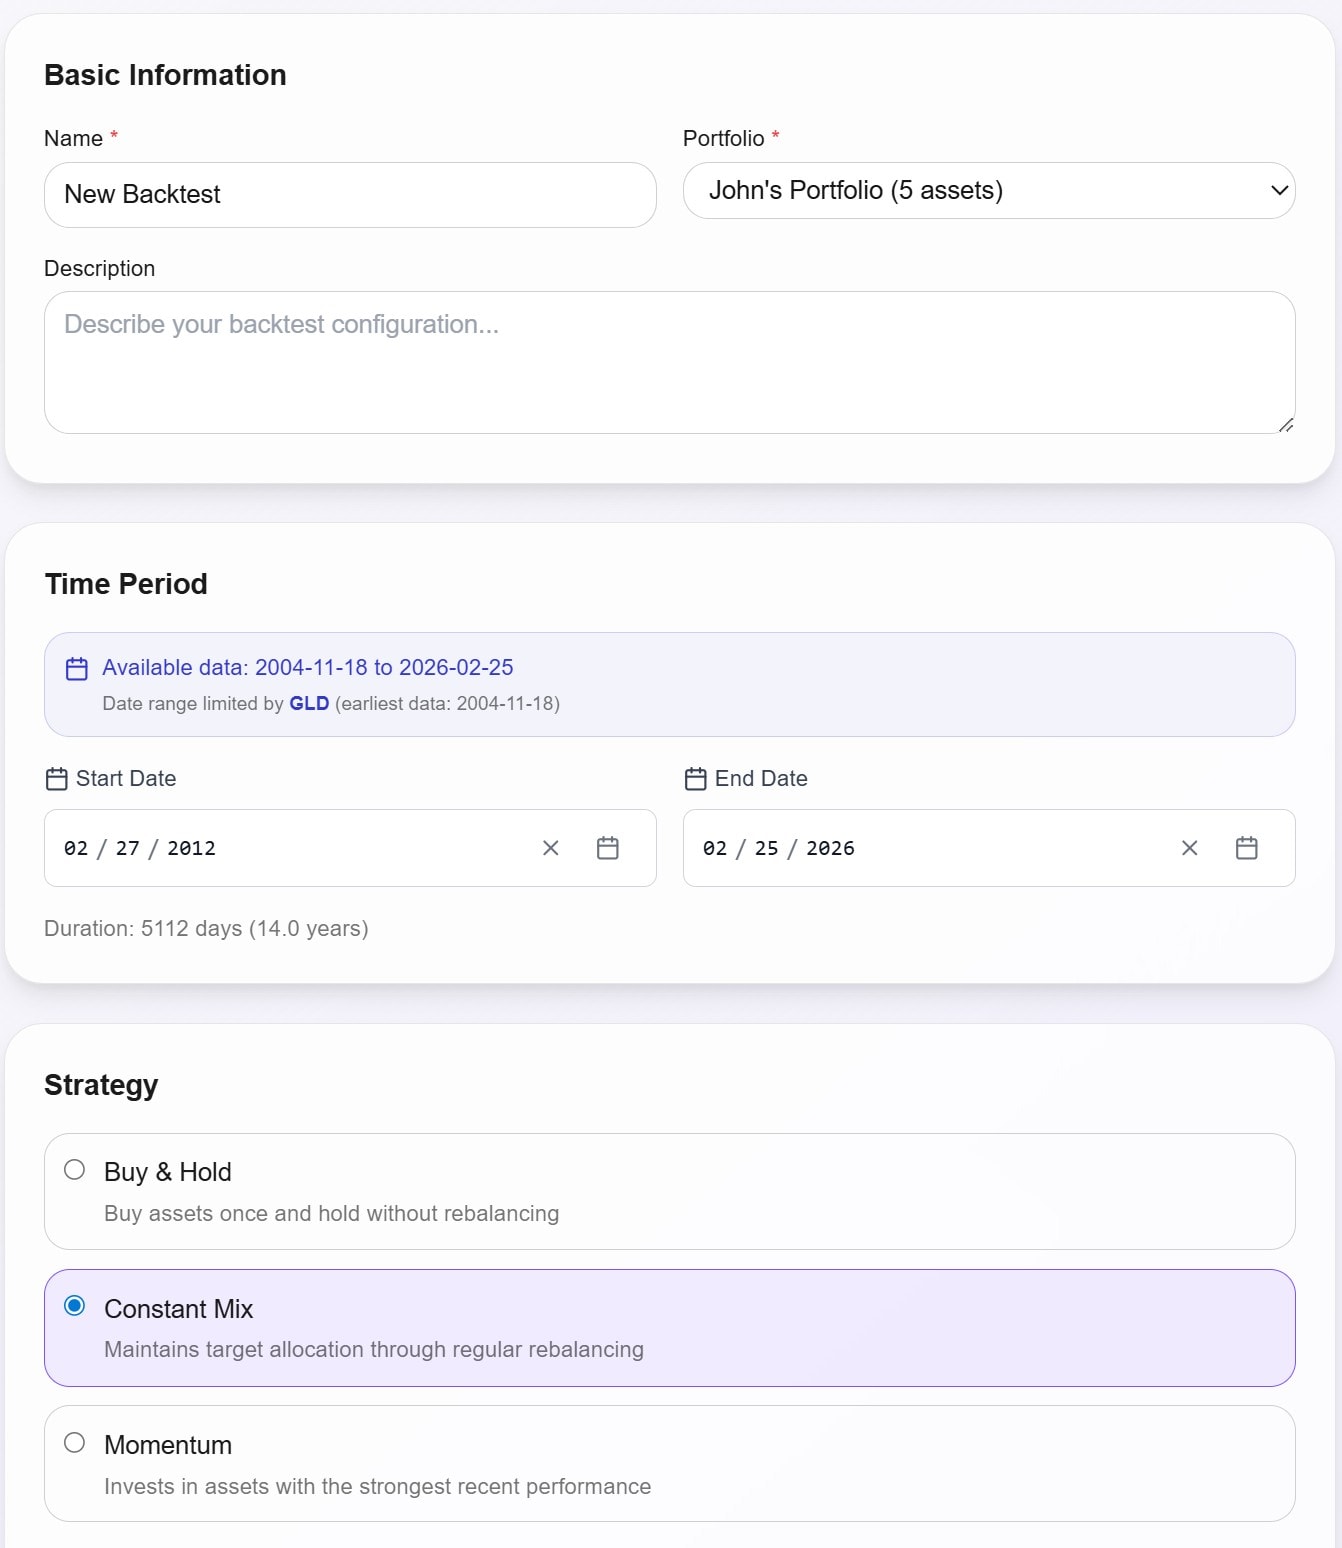
Run the Simulation
AWALYT processes years of daily market data and generates a complete performance and risk profile: CAGR, volatility, max drawdown, Sharpe ratio, alpha, beta, and more.
Analyze and Compare
Review detailed rebalancing logs, quarterly correlation shifts, and AI-generated insights. Compare multiple strategies side by side to find what actually works.
Why Investors Switch to AWALYT
| What Matters | Other Tools | AWALYT |
|---|---|---|
| Data granularity | Monthly (12 pts/year) | Daily (252 pts/year) |
| Rebalancing detail | Final allocation only | Full buy/sell log at every rebalance |
| Correlation analysis | One static matrix | Quarterly matrices across entire period |
| AI insights | None or generic | AI grounded in your actual backtest data |
| Risk metrics | Based on smoothed monthly returns | Based on true daily volatility |
252
Daily data points per year
All-in-one
Complete investment toolkit
Full Suite
Risk & performance analytics
“Built by an investor, for investors. AWALYT was created to solve the exact frustration its founder experienced: making portfolio decisions with incomplete data.”
Frequently Asked Questions
Yes — Awalyt has a Free plan, free forever, no credit card. Premium is $119/year with everything included.
You can build portfolios with ETFs, mutual funds, and individual stocks. Our asset universe is continuously expanding.
Monthly data uses only 12 points per year, which hides intra-month volatility, true drawdown depth, and real risk. Daily data (252 points/year) shows you what actually happened — including the worst days that monthly tools average away.
AWALYT's AI is not a general chatbot. It reads the actual numerical output of your backtest and explains it. It cannot hallucinate because it works exclusively with your real simulation data.
Portfolio Visualizer uses monthly data, has no AI analysis, doesn't show detailed rebalancing logs, and provides only a static correlation view. AWALYT uses daily data, shows every rebalancing transaction, tracks correlation changes quarterly, and includes AI-powered analysis grounded in your data.
Stop guessing. Start testing.
Create a free account and run your first backtest today.
Get Started Free