Bogleheads 3-Fund Portfolio vs S&P 500: A 14-Year Backtest with Real Data [2026]
The Bogleheads 3-Fund Portfolio is one of the most recommended investment strategies on the internet. Three low-cost index funds — US stocks, international stocks, and bonds — and you're done. Simple, diversified, and backed by decades of passive investing philosophy.
But how does it actually perform? Not in theory. Not in a Bogleheads forum post. In a real backtest, with daily data, across 14 years that include a global pandemic crash, the worst bond market in a generation, and one of the strongest US bull runs in history.
And more importantly: how does it compare to just buying the S&P 500 and doing nothing else?
We ran the numbers. Here's everything the data shows — the good, the bad, and the parts that most 3-Fund articles never talk about.
Disclaimer: This article is for educational and informational purposes only. It does not constitute investment advice. Past performance does not guarantee future results. Always do your own research before making any investment decisions.
The Portfolio
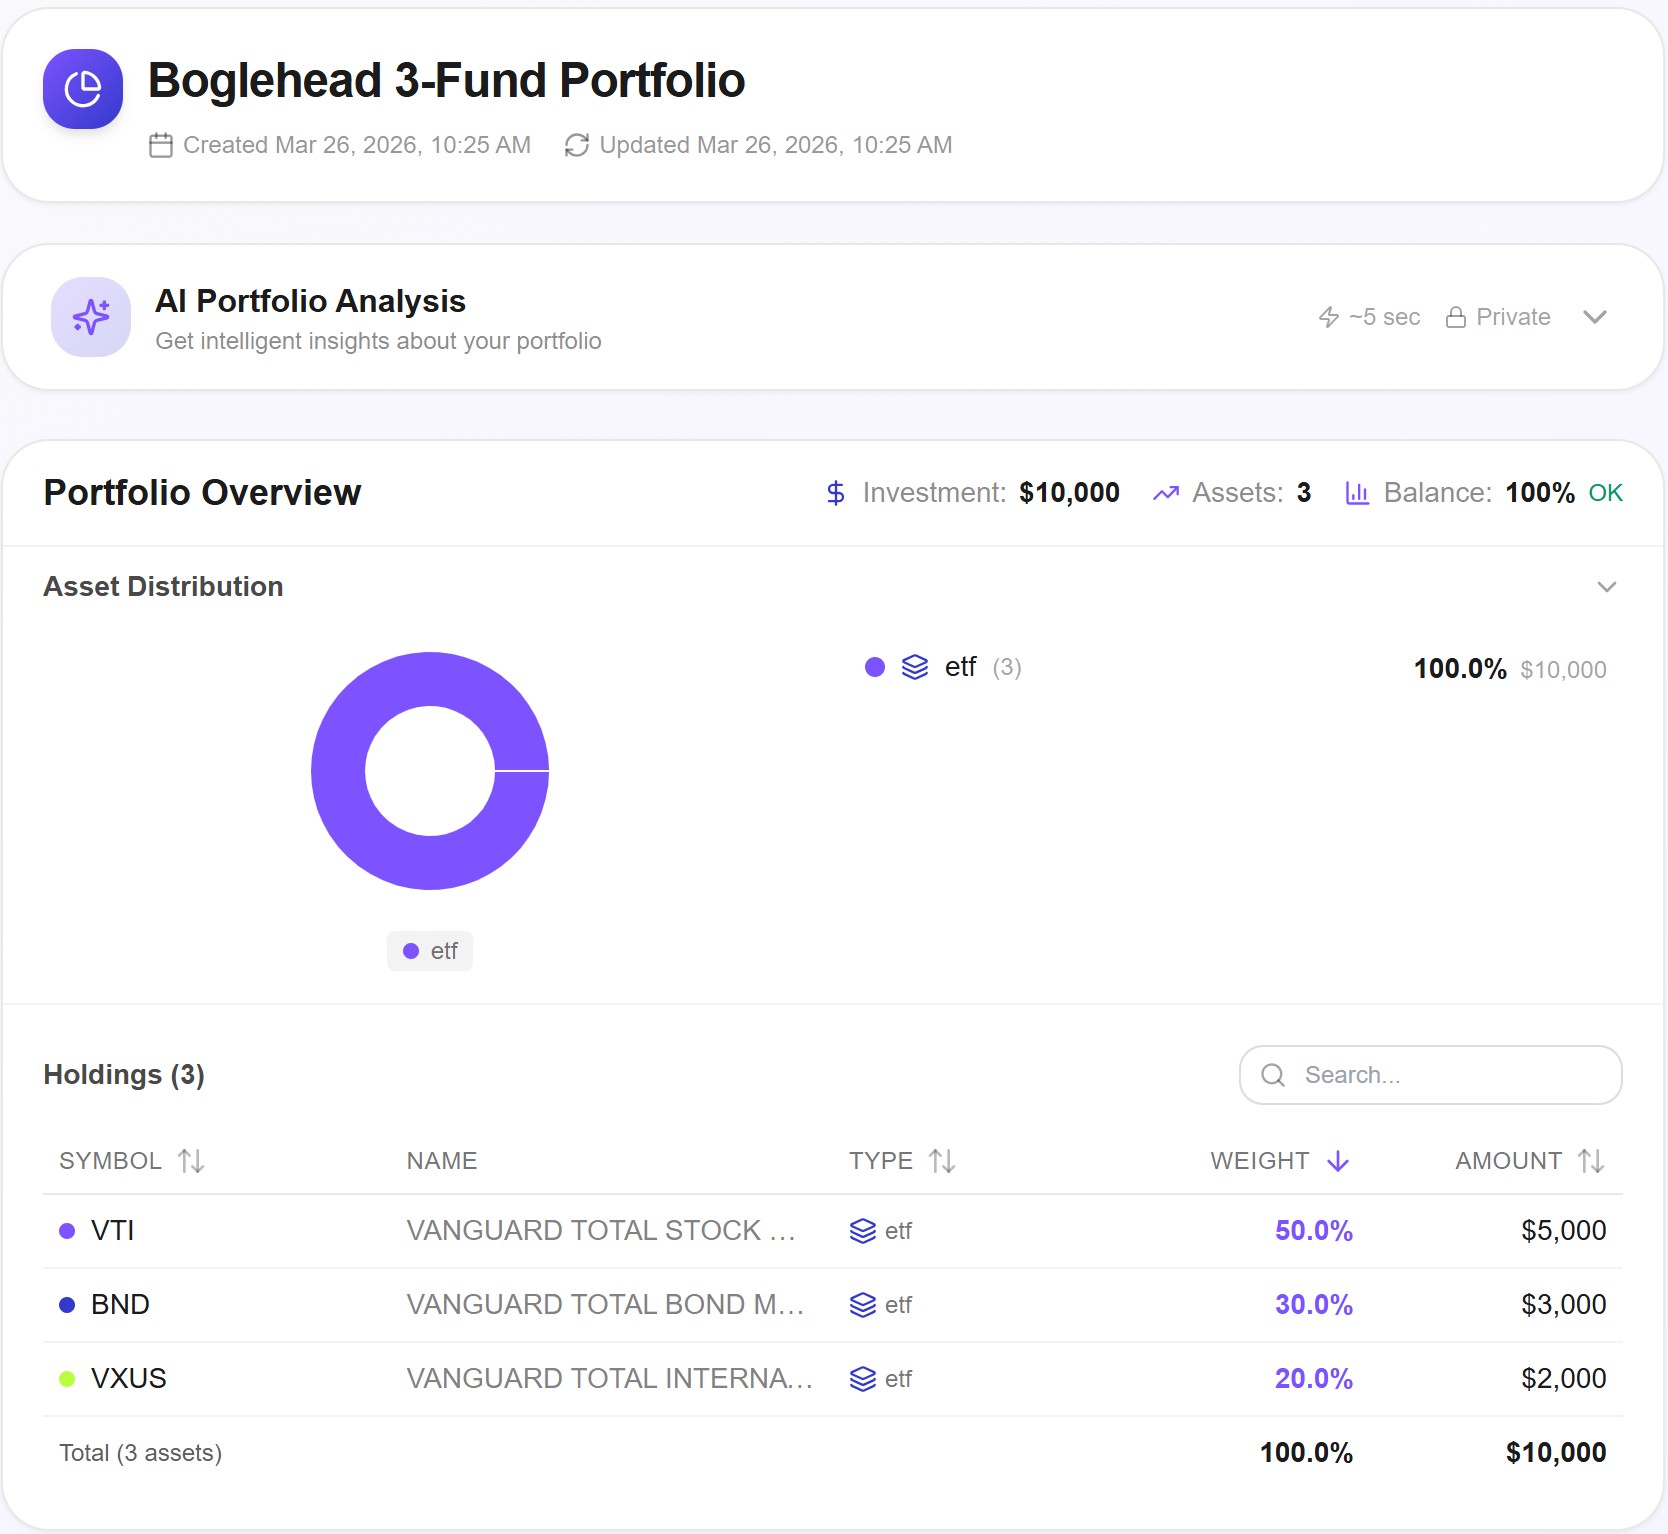
The Bogleheads 3-Fund Portfolio doesn't have a single official allocation — investors choose their own split based on risk tolerance and time horizon. For this backtest, we used a common moderate allocation:
- VTI (Vanguard Total US Stock Market) — 50%
- BND (Vanguard Total Bond Market) — 30%
- VXUS (Vanguard Total International Stock) — 20%
This gives you exposure to the entire US stock market, the global bond market, and developed + emerging international equities. Total cost: a blended expense ratio of roughly 0.05%.
The Backtest Setup
We backtested this portfolio on Awalyt using the following configuration:
- Period: March 26, 2012 to March 25, 2026 — 14 full years
- Initial investment: $10,000
- Strategy: Constant Mix with annual rebalancing (5% drift tolerance)
- Benchmark: SPY (S&P 500 ETF)
- Data: 3,520 daily data points (252 per year)
Why 14 years? Because it captures multiple complete market cycles: the post-2012 bull run, the late-2018 correction, the 2020 COVID crash and recovery, the 2022 bear market where stocks and bonds fell together, and the 2023–2025 recovery. It's long enough to be meaningful, and every data point in the backtest corresponds to an actual trading day.
The Results: Performance
Let's start with the headline numbers.
Here are the key metrics:
| Metric | 3-Fund Portfolio | SPY (Benchmark) |
|---|---|---|
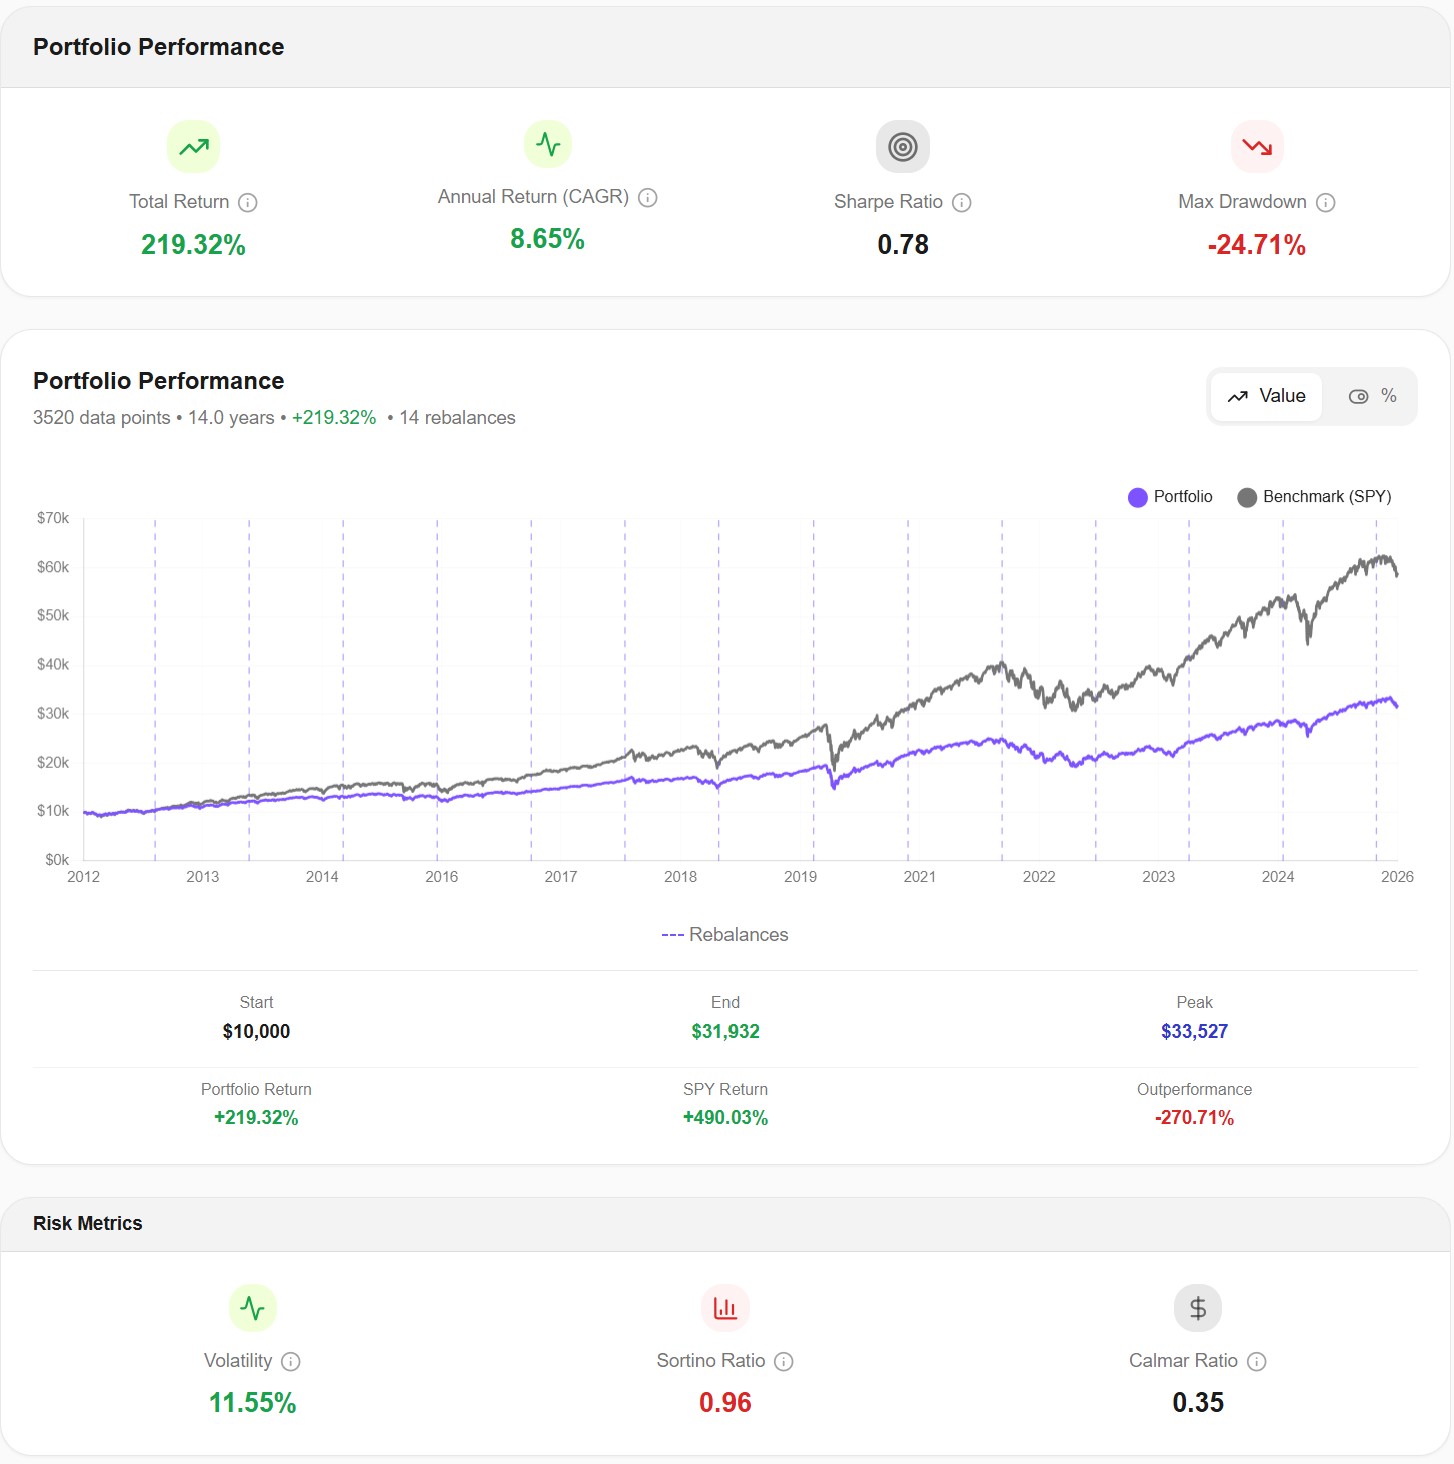
| Total Return | +219.32% | +490.03% |
| CAGR | 8.65% | 13.52% |
| Final Value | $31,932 | $59,003 |
| Peak Value | $33,527 | — |
| Max Drawdown | -24.71% | -33.70% |
| Volatility | 11.55% | 16.70% |
| Sharpe Ratio | 0.78 | — |
| Sortino Ratio | 0.96 | — |
| Calmar Ratio | 0.35 | — |
The first thing that jumps out is the return gap. The S&P 500 returned more than double what the 3-Fund Portfolio did. Over 14 years, that's the difference between $31,932 and $59,003 on a $10,000 investment. That's $27,071 left on the table.
But before you close this article and go all-in on SPY, look at the risk side of the table.
The 3-Fund Portfolio's max drawdown was -24.71% versus SPY's -33.70%. That's a 9-percentage-point difference in the worst-case scenario. In real dollars on a $100,000 portfolio, that's the difference between losing $24,710 and losing $33,700 at the bottom. Nearly $9,000 of additional pain.
Volatility tells the same story: 11.55% for the 3-Fund vs 16.70% for SPY. The diversified portfolio delivered a meaningfully smoother ride year to year.
The Sharpe Ratio of 0.78 tells you that while the 3-Fund didn't match SPY's raw returns, it was reasonably efficient at converting risk into return. The Sortino Ratio of 0.96 — which only penalizes downside volatility — is even more favorable, suggesting the portfolio did a good job of limiting the kind of volatility that actually hurts.
The takeaway: the 3-Fund Portfolio didn't win on returns. It wasn't designed to. It was designed to deliver solid returns with significantly less risk, and the backtest confirms that it did exactly that.
Year by Year: The Story Behind the Average
Averages hide everything interesting. Here's what happened year by year.
A few things stand out:
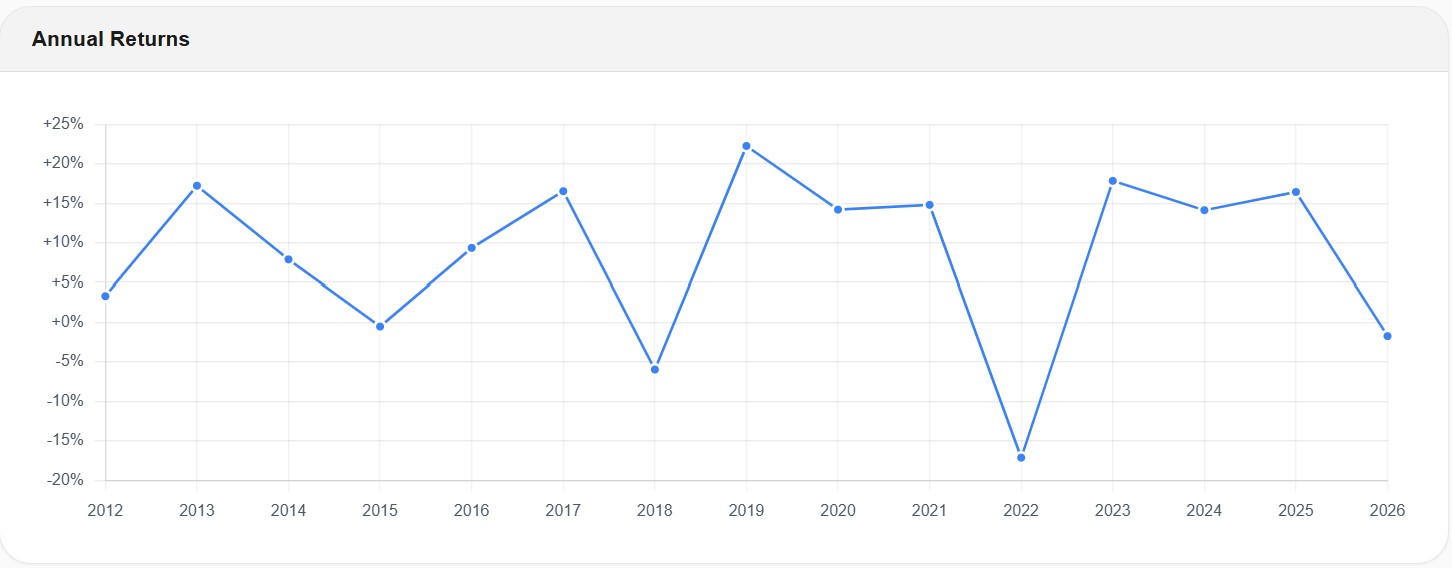
2013 was the best year at roughly +17%. Global markets were recovering from the European debt crisis, and all three asset classes contributed positively.
2018 was the first real test. The portfolio returned around -6% as rising interest rates and US-China trade tensions hit both stocks and bonds. Not catastrophic, but a taste of what was to come.
2019 was the standout at approximately +21%. One of those years where everything works — US stocks rallied hard, international caught a tailwind, and bonds held steady.
2020 is the year that defines risk tolerance. The portfolio ended the year up around +14%, but that number hides the COVID crash in March where the portfolio dropped sharply before recovering. The annual return looks fine. The daily experience was terrifying.
2022 was the defining year for the 3-Fund strategy. The portfolio dropped approximately -17%. This was the year stocks and bonds fell simultaneously — the very thing that the 3-Fund approach relies on not happening. We'll dig deeper into this in the correlation section below, because this is where the real story is.
2023–2025 saw a strong recovery, with returns between +13% and +16% each year as markets normalized.
Volatility: The COVID Spike and What It Tells You
Risk isn't a number. It's a feeling. And volatility is the best proxy for what that feeling looks like, year by year.
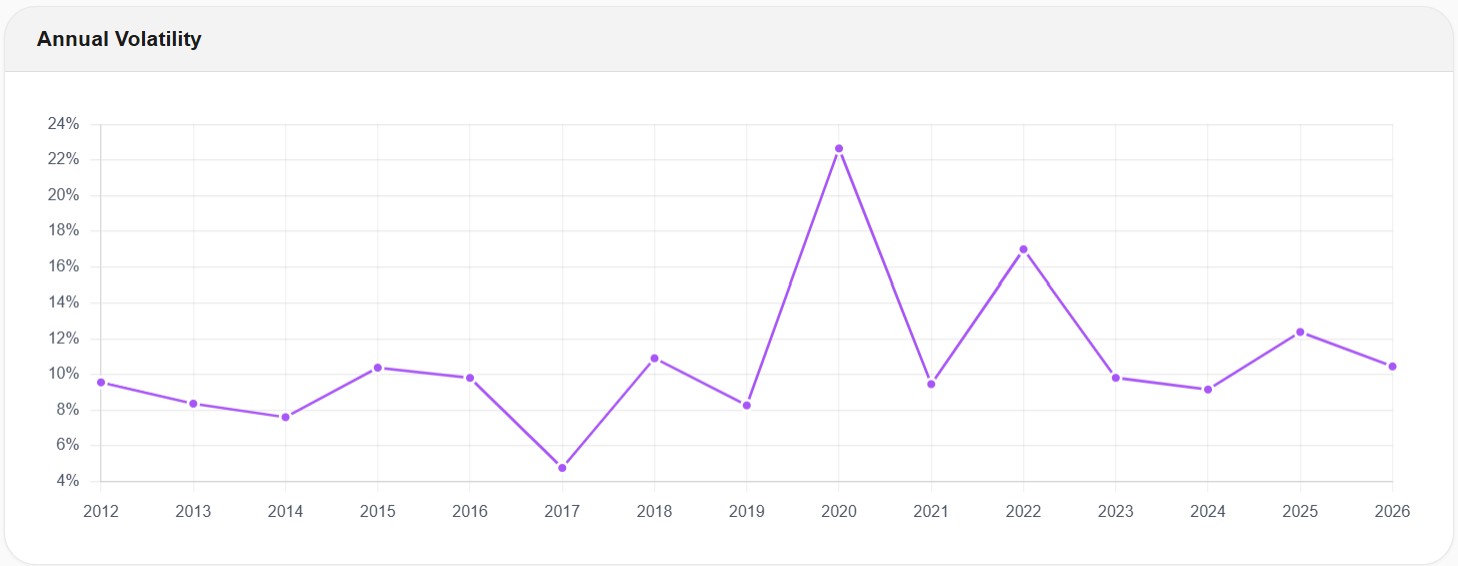
From 2012 to 2019, the 3-Fund Portfolio's annual volatility stayed in a comfortable band between 5% and 11%. The lowest point was 2017 at roughly 5% — a historically calm year for markets globally.
Then 2020 happened. Volatility spiked to over 22% — nearly three times the portfolio's normal level. That's the COVID crash showing up in the data. Even though the year ended positively, the daily experience was wild. This is a diversified, bond-heavy portfolio, and it still saw its volatility triple in a single year.
By 2023, volatility settled back to around 9%, and 2024 was roughly the same. But the 2020 spike is a critical data point for anyone considering this strategy: even a conservative, diversified portfolio can get violent during a genuine crisis.
This is also exactly why daily data matters in backtesting. A monthly data tool would show 2020 as a moderately volatile year. Daily data reveals the real magnitude of the swings.
The Correlation Story: When Diversification Broke Down
This is the section that makes this backtest different from every other 3-Fund analysis you'll read online. Most articles tell you bonds and stocks are negatively correlated — when stocks go down, bonds go up, cushioning the fall. That's the entire premise of the 3-Fund strategy.
But is it always true? The data says no.
2018: Diversification Working as Designed
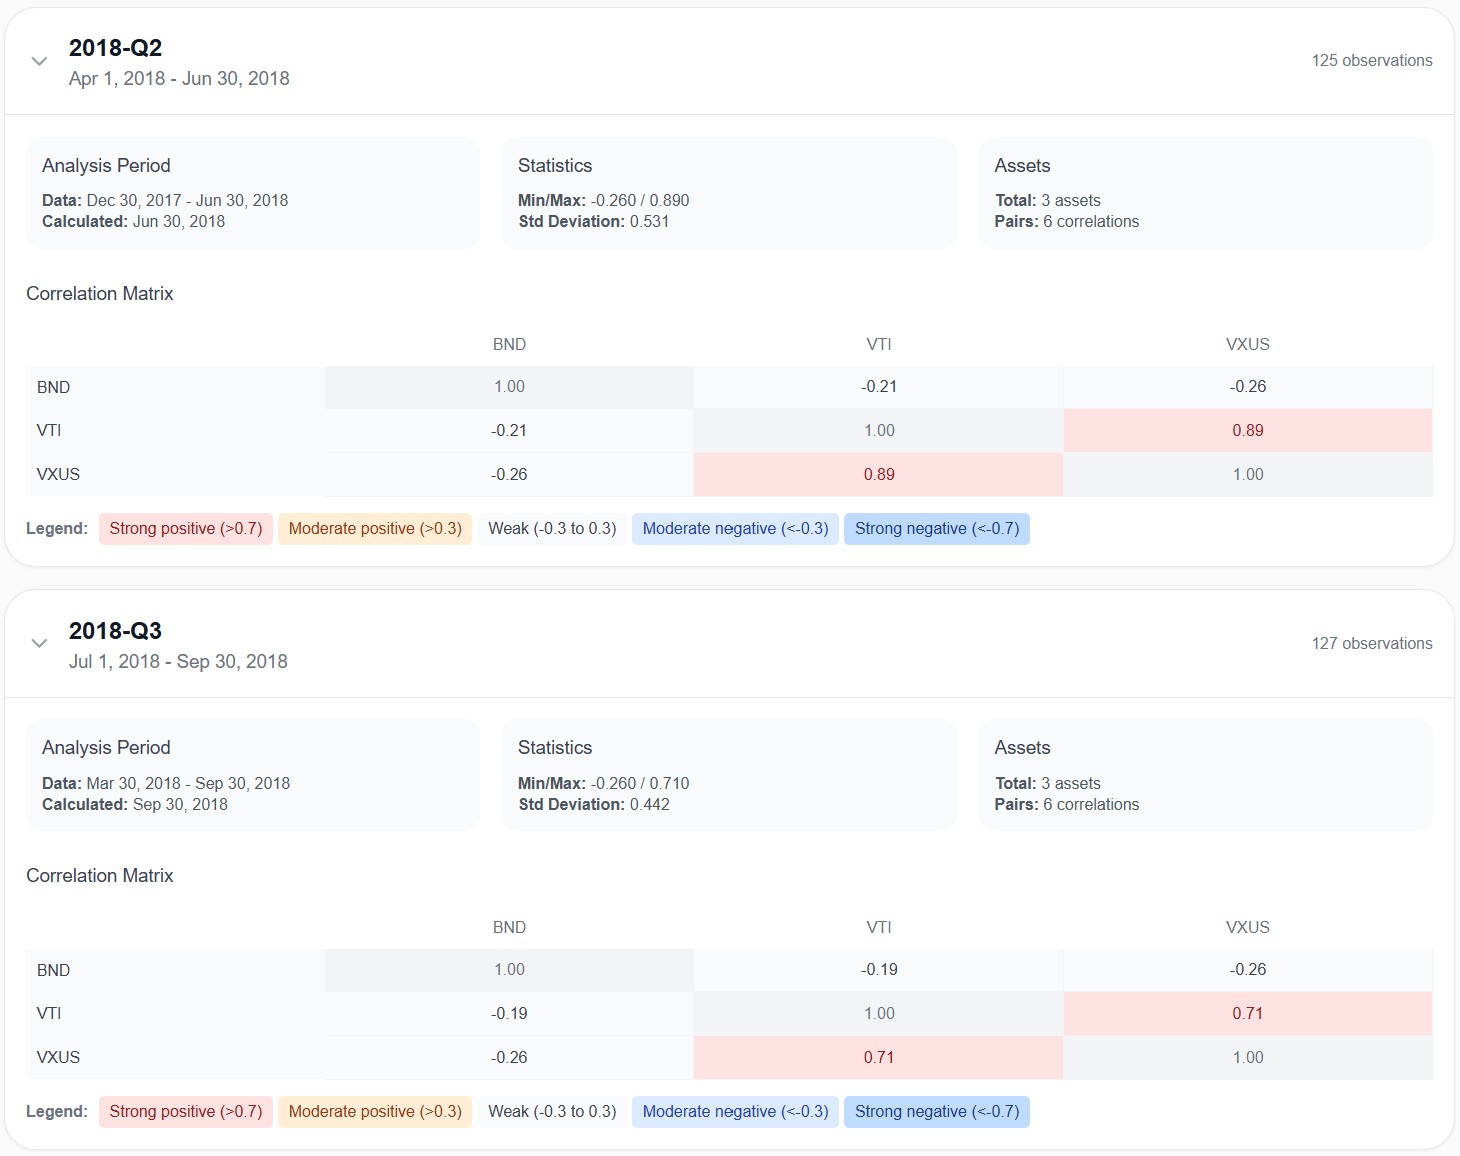
In Q2 2018, the correlation between BND and VTI was -0.21 — moderately negative. When US stocks dropped, bonds tended to rise. That's exactly what you want. BND and VXUS showed a similar negative relationship at -0.26.
This is the 3-Fund Portfolio doing what it's supposed to do. Bonds act as a counterweight, absorbing shocks when equities sell off.
Meanwhile, VTI and VXUS were correlated at 0.89 — almost perfectly moving together. This is important: your US and international stock holdings are highly correlated. The real diversification in a 3-Fund Portfolio doesn't come from splitting stocks geographically. It comes from bonds.
2022: The Year Diversification Failed
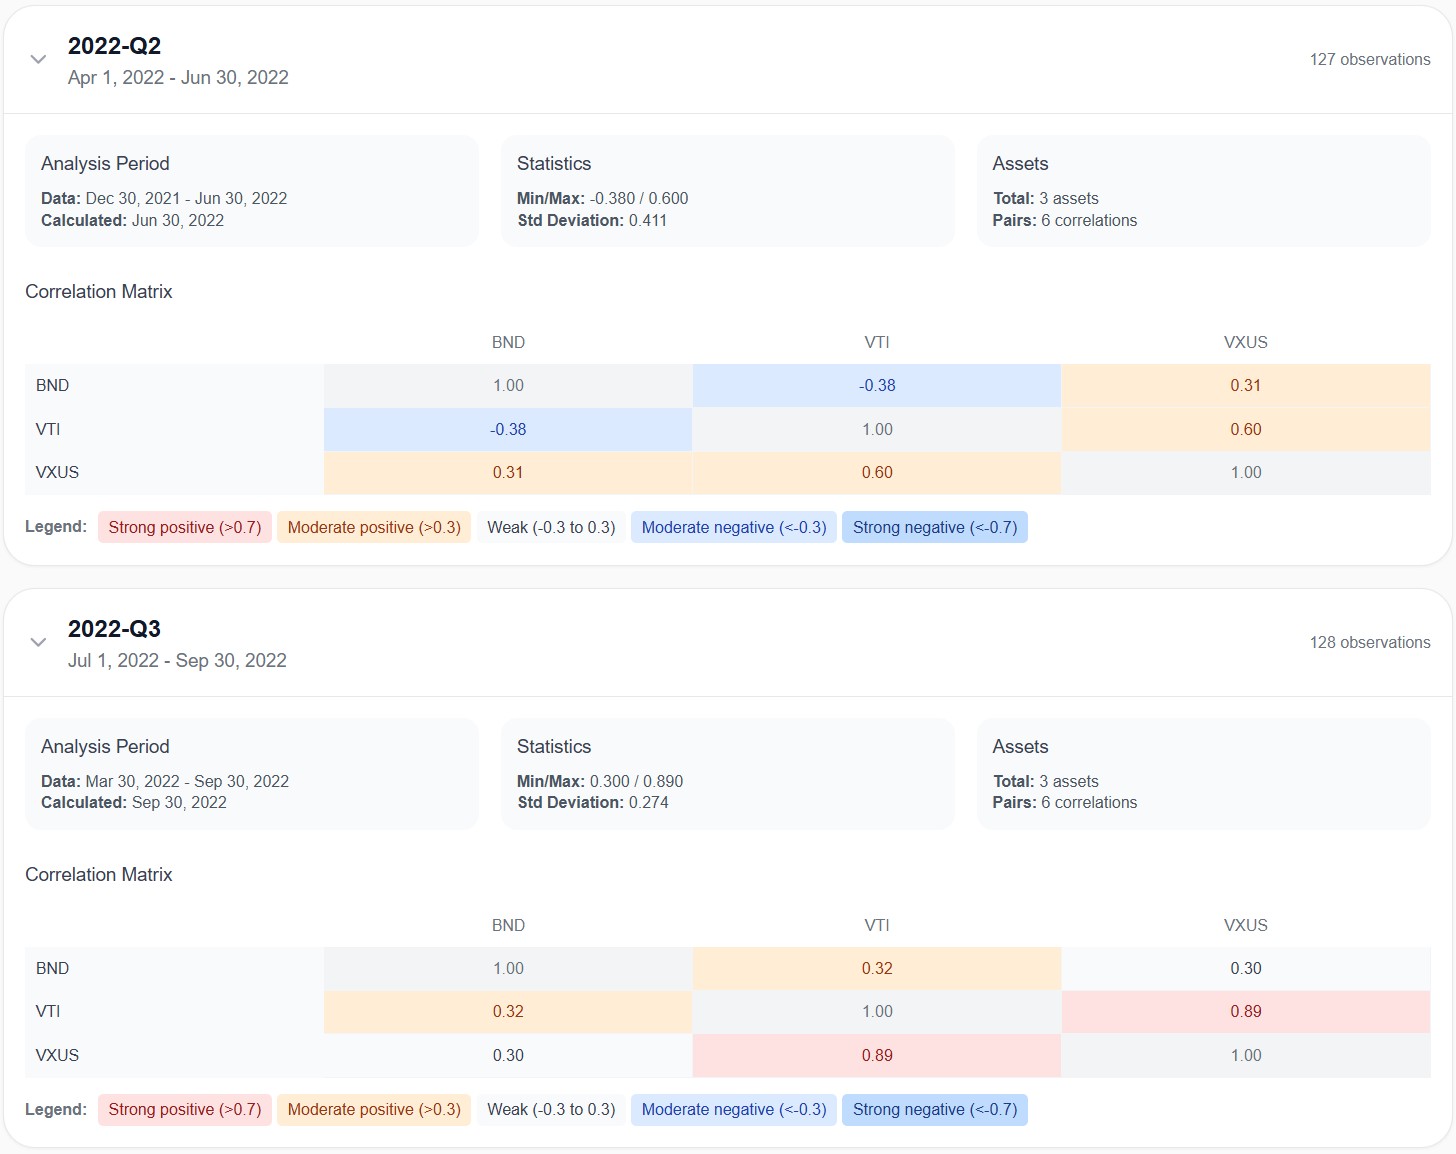
Now look at what happened in 2022. In Q2, the BND-VTI correlation was -0.38 — still negative, actually more negative than usual. Bonds were still doing their job in the first half of the year.
But by Q3 2022, the BND-VTI correlation flipped to +0.32. Positive. Bonds and stocks were now falling together. The cushion was gone. BND-VXUS also went positive at +0.30.
This is the scenario that 3-Fund investors rarely think about but absolutely need to understand: when the Fed aggressively raises interest rates, bond prices drop (interest rates and bond prices move inversely). At the same time, higher rates pressure stock valuations. The result? Everything falls together, and the portfolio's main risk management mechanism — bond diversification — stops working.
The -17% return in 2022 wasn't just bad luck. It was a structural failure of the correlation assumptions that the entire strategy relies on. It doesn't mean the strategy is broken — correlations normalized again in 2023 — but it means investors need to understand that diversification is not guaranteed in every market environment.
This kind of analysis is impossible with tools that only show you a single, static correlation number. You need quarterly correlation tracking to see how relationships shift during stress periods — which is exactly what this backtest provides.
AI Assessment: A 7.0 Out of 10
After running the full backtest, we used Awalyt's AI assessment feature to get an automated analysis of the portfolio's strengths and weaknesses. The AI reads the actual backtest data — returns, risk metrics, correlations, rebalancing history — and generates an evaluation grounded entirely in the numbers.
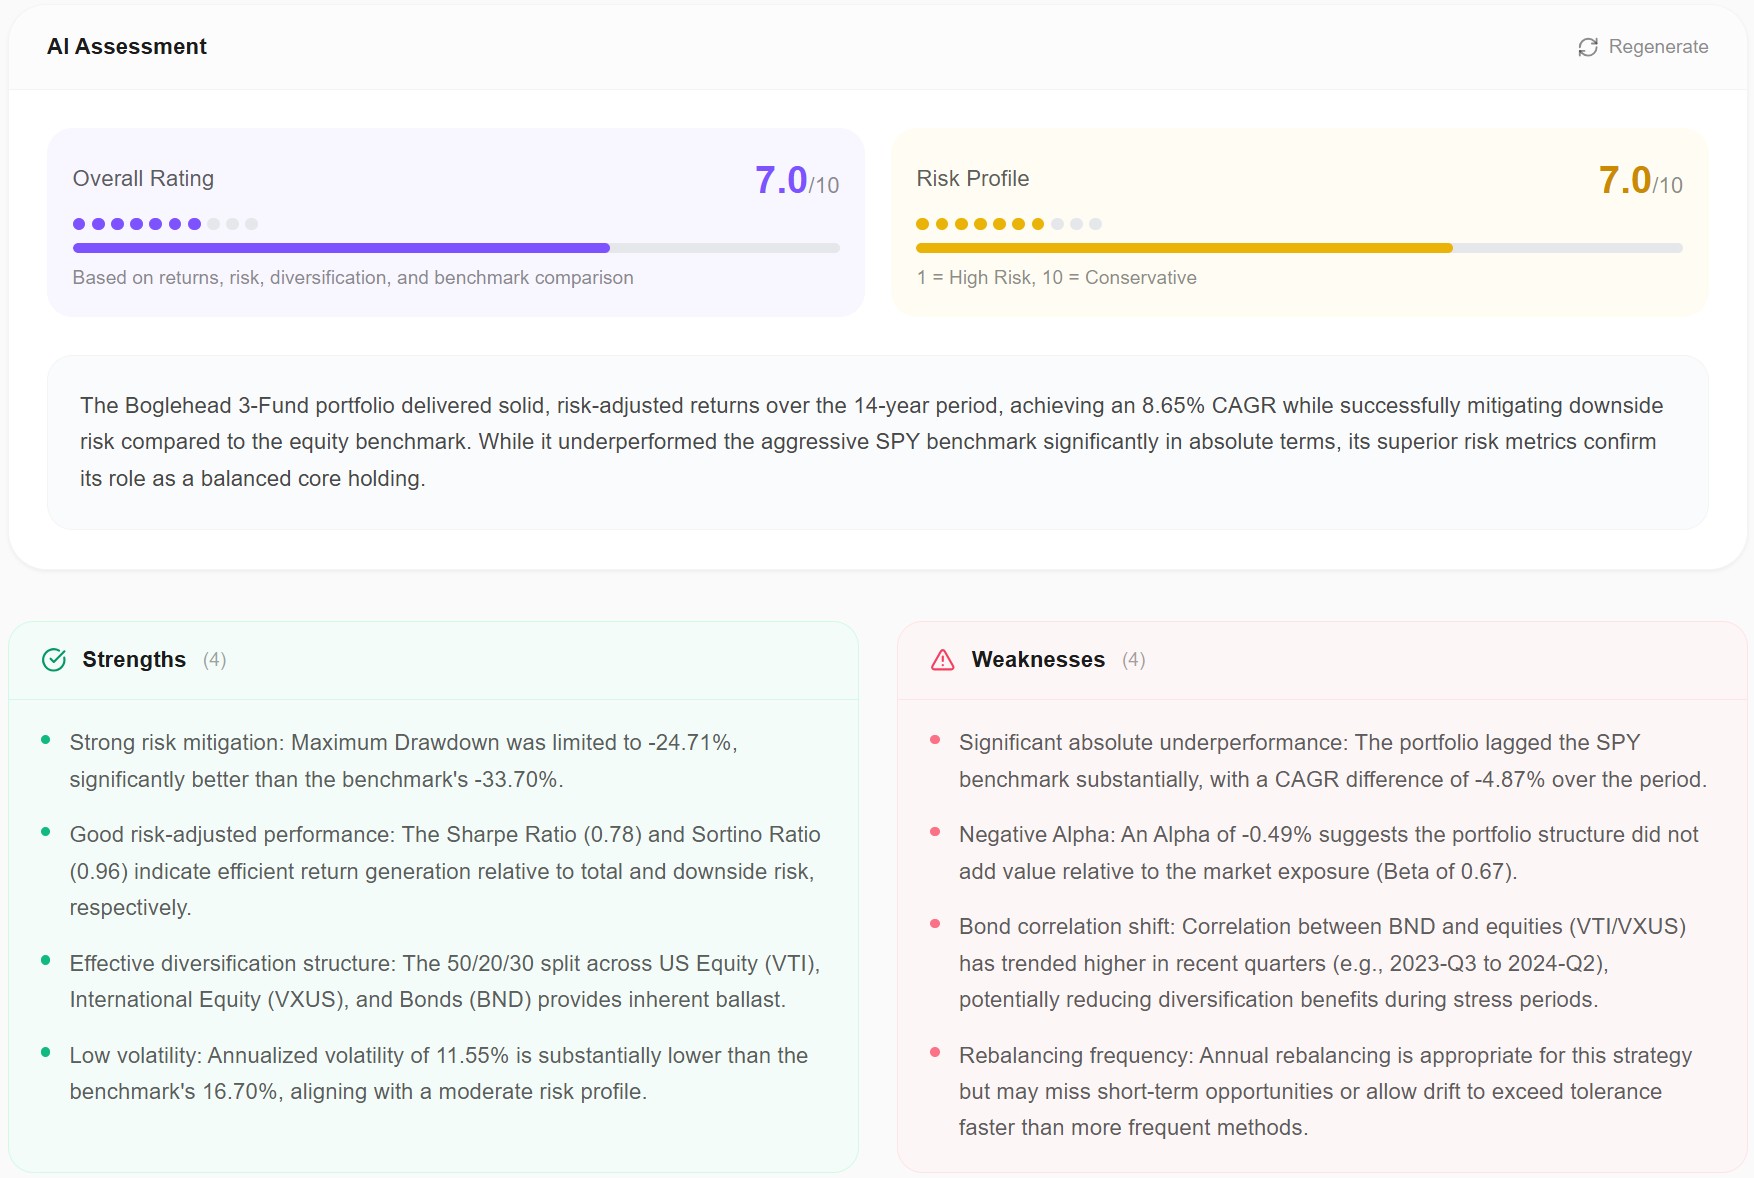
Overall Rating: 7.0/10 — a solid portfolio, not exceptional.
Risk Profile: 7.0/10 (where 10 = most conservative) — moderate risk, leaning conservative.
What the AI Identified as Strengths
Strong risk mitigation. Maximum drawdown was limited to -24.71%, significantly better than SPY's -33.70%. If protecting capital during downturns is a priority, the 3-Fund delivered.
Good risk-adjusted performance. The Sharpe Ratio (0.78) and Sortino Ratio (0.96) indicate the portfolio generated respectable returns relative to the amount of risk taken. You didn't get the highest returns, but you didn't take excessive risk to get them either.
Effective diversification structure. The 50/20/30 split across US equity, international equity, and bonds provides inherent ballast. No single asset class dominates to the point of making the portfolio fragile.
Low volatility. At 11.55%, annualized volatility was substantially lower than SPY's 16.70%. This translates to a smoother ride — fewer days where you log in and see a number that makes your stomach drop.
What the AI Identified as Weaknesses
Significant benchmark underperformance. The portfolio trailed SPY by nearly 5 percentage points in CAGR (8.65% vs ~13.52%). Over 14 years with compounding, that gap becomes enormous.
Negative alpha. An alpha of -0.49% suggests the portfolio structure didn't add value relative to its market exposure (beta of 0.67). You took less risk than the market, but the return reduction was proportionally larger than the risk reduction.
Bond correlation shift. The AI flagged the 2022–2024 period where bond-equity correlations trended higher, reducing the diversification benefit during the exact moments when you need it most.
Rebalancing frequency. Annual rebalancing is appropriate for this strategy but may miss short-term opportunities. During fast-moving markets, a year is a long time for allocations to drift before being corrected.
Is the 3-Fund Portfolio Worth It If SPY Beats It by So Much?
This is the question every investor reading this article is asking. And the honest answer is: it depends entirely on you.
If you can genuinely sit through a -34% drawdown without selling — not hypothetically, but actually watch $100,000 become $66,000 and do nothing — then SPY has historically delivered higher returns. A single-fund, 100% equity approach is simpler and has beaten the 3-Fund over this particular 14-year window.
But most investors overestimate their risk tolerance. The data consistently shows that retail investors sell at market bottoms, not because they're irrational, but because a -34% decline feels catastrophic when it's happening to your actual savings. The 3-Fund Portfolio's shallower drawdowns and lower volatility make it easier to hold through the bad years — and holding through the bad years is what generates the compounding that builds wealth.
There's also the recency bias problem. The last 14 years have been dominated by US large-cap growth stocks. International stocks and bonds both underperformed US equities significantly. That's not guaranteed to continue. In the 2000–2009 "lost decade" for US stocks, international equities and bonds both outperformed the S&P 500. The 3-Fund Portfolio is built for the long term, not for any specific market regime.
Who Should Use the 3-Fund Portfolio
Based on what the backtest shows, the 3-Fund Portfolio makes the most sense for:
Investors who prioritize not losing money over maximizing returns. If your primary goal is growing wealth steadily without dramatic drawdowns, the risk metrics support this strategy.
Investors with a medium-to-long time horizon (10+ years) who want simplicity. Three funds, annual rebalancing, total cost under 0.05%. It doesn't get simpler than this.
Investors who might panic-sell during a crash. If a -34% drawdown would cause you to sell, you're better off with the 3-Fund's -25% drawdown and lower volatility. The best strategy is one you can actually stick with.
Retirees or near-retirees who need capital preservation alongside growth. The 30% bond allocation provides income and cushioning that an all-equity portfolio doesn't offer.
Who Should Consider Alternatives
Young investors with a 30+ year horizon and genuine high risk tolerance. If you truly won't sell during a crash and have decades to recover, the return gap between the 3-Fund and SPY is significant. Over 30 years, that CAGR difference compounds into a very large dollar amount.
Investors who are aware of the correlation risk. As 2022 showed, the bond diversification benefit can temporarily disappear during interest rate hikes. If you understand this risk and have a plan for it, more aggressive allocations may suit you.
The Bottom Line
The Bogleheads 3-Fund Portfolio did exactly what it was designed to do over 14 years: deliver solid, positive returns with meaningfully less risk than the broader market. It turned $10,000 into $31,932 with a maximum drawdown of -24.71% and annual volatility of 11.55%.
It also underperformed the S&P 500 by a wide margin — roughly $27,000 on a $10,000 investment. That's the cost of diversification and downside protection over a period dominated by US large-cap stocks.
The 2022 correlation breakdown is the most important finding in this backtest. For a few quarters, the fundamental assumption behind the strategy — that bonds cushion equity declines — stopped being true. It recovered, but any 3-Fund investor needs to understand that this can happen and be prepared for it.
The data doesn't tell you whether this portfolio is "good" or "bad." It tells you exactly what the tradeoffs are. And now you have the numbers to decide whether those tradeoffs match your goals, your time horizon, and — most importantly — your ability to stay invested when things get uncomfortable.
If you want to run your own version of this backtest with a different allocation — maybe 60/20/20, or 40/40/20, or without international stocks entirely — you can do that on the backtesting tool page using daily data for the same level of precision shown in this article.
Want to test these insights on your own portfolios?
Awalyt is a portfolio analysis platform: backtesting on daily data, fundamental analysis, asset analysis, and AI-powered insights.
Get Started FreeRelated Insights
Does Rebalancing Actually Improve Returns? We Tested the All Weather Portfolio Over 16 Years [2026]
13 min read
What Is Portfolio Backtesting? A Complete Guide for DIY Investors [2026]
12 min read
Daily vs Monthly Data in Backtesting — Does It Matter? [2026]
11 min read