Backtesting a Portfolio: 6 Common Mistakes and How to Avoid Them [2026]
Backtesting is one of the most powerful tools a retail investor has. Done well, it lets you validate an investment strategy against real historical data before risking a single dollar. Done badly, it does something worse than nothing: it gives you false confidence in a strategy that was never going to work.
And here's the uncomfortable truth — most backtests you'll see online, and most backtests people run themselves, are done badly. Not because the math is wrong. The math is almost always right. The problem is in the setup: the time period chosen, the granularity of the data, which metrics are reported, and what the backtest is implicitly assumed to prove.
This article walks through the six most common backtesting mistakes I see among DIY investors, and shows you how to avoid each one.
Disclaimer: This article is for educational and informational purposes only. It does not constitute investment advice. Past performance does not guarantee future results. Always do your own research before making any investment decisions.
Mistake #1 — Overfitting: Building a Strategy That Already Knows the Answer
Overfitting is the single most dangerous mistake in backtesting, and it's also the easiest one to make without realizing it.
Here's how it happens. You sit down to build a portfolio. You know the last 10 years of market history. You know semiconductors had an extraordinary run. You know US tech outperformed international stocks by a wide margin. You know gold rallied. Armed with that knowledge, you start building your allocation — and you naturally gravitate toward the assets you already know did well.
Then you backtest it. And of course, it looks incredible.
A real example: imagine someone in early 2024 building a portfolio that is 60% SOXX (semiconductor ETF), 30% QQQ (Nasdaq 100), and 10% GLD (gold). They backtest it over 2014–2024. The CAGR is stunning. The Sharpe ratio looks elite. They conclude: "This is my strategy."
But that's not a strategy — that's a list of the assets that already won. There was no thesis beforehand. The portfolio was constructed because we knew semiconductors and tech had compounded at extraordinary rates. The backtest isn't validating an idea; it's reflecting the idea back at us.
The moment you change the period — say 2000–2010, which included the dot-com crash and a lost decade for tech — that same portfolio falls apart. Semiconductors were decimated. The Nasdaq took 15 years to recover its 2000 peak. The "strategy" reveals itself as curve-fitting to one favorable window.
How to avoid overfitting
- Start with a thesis, then test it. The correct order is: "I believe diversification across asset classes reduces drawdowns → let me backtest a diversified portfolio to verify." The wrong order is: "Let me try different allocations until the Sharpe ratio is high."
- If your strategy needs highly specific weights to work (say 37% of this, 18% of that), it probably doesn't work. Real strategies are robust to small changes in allocation. If shifting 5% between assets destroys the results, you're not looking at a strategy — you're looking at a fragile arrangement of historical winners.
- Test your strategy across multiple independent time windows. If it only works in one specific period, that's your answer.
Mistake #2 — Running Backtests That Are Too Short
A 2-year or 5-year backtest tells you almost nothing. It's one of the most common mistakes I see, especially on forums and YouTube, where people proudly share "3-year backtests" of their favorite strategy.
The problem is simple: short periods don't contain enough variety. Markets go through cycles — growth phases, recessions, interest rate changes, inflation shocks, geopolitical events. A 3-year window might capture exactly one cycle. Or worse, it might capture only the tail end of an expansion and tell you nothing about what happens during a contraction.
A backtest of "growth stocks 2020–2022" will look radically different from "growth stocks 2022–2024", which will look different again from "growth stocks 2000–2003". None of those three backtests, taken alone, tells you whether growth stocks are a good long-term holding. They each capture a slice of a much more complex picture.
What a "long enough" backtest looks like
As a rule of thumb, I aim for at least 10 years, and ideally 15–20 years or more. Longer is almost always better, with one caveat: some instruments simply don't have that much history (many modern ETFs launched in the 2010s). When that's the case, you can often backtest the underlying index going back further, or use a proxy ETF that tracks the same exposure with a longer track record.
Here's what a 14-year backtest looks like in practice — the Core Portfolio from our Core + Satellite strategy guide tested over 2012–2026:
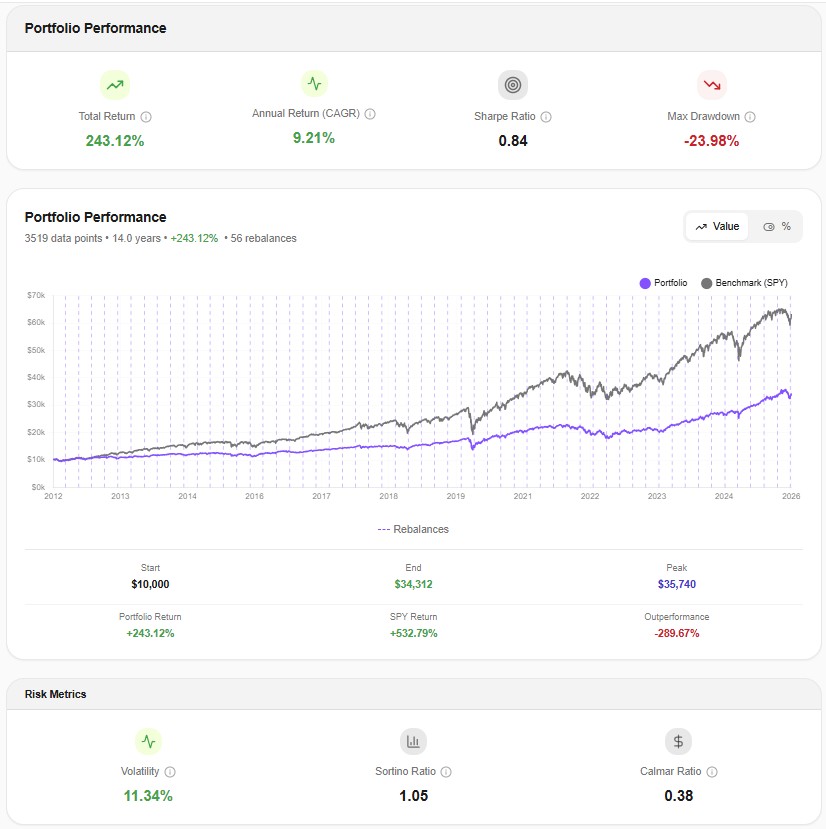
This period covers a full cycle: the post-GFC recovery, the 2015 mini-correction, the 2018 volatility shock, the 2020 COVID crash, the 2022 bond-and-stock double drawdown, and the 2023–2025 recovery. That's the kind of data variety a backtest needs to mean something.
Mistake #3 — Testing Only Favorable Periods (Skipping the Stress Test)
This one is related to Mistake #2 but distinct. Even a 10-year backtest can be misleading if that particular decade was mostly bull market. A backtest of 2013–2023 looks beautiful for almost any reasonable portfolio — because that decade was dominated by one of the longest bull runs in modern history.
The real test of a strategy is not how it performs on average. It's how it performs during the worst periods. Those are the moments that determine whether you stay invested or panic-sell at the bottom — which is, in the end, what actually drives your long-term returns.
Stress-testing in practice
When you backtest a portfolio, always actively look at how it behaved during the known crisis windows:
- 2000–2002: dot-com crash
- 2008–2009: global financial crisis
- March 2020: COVID shock
- 2022: simultaneous stock and bond drawdown driven by rate hikes
If your backtesting tool gives you yearly returns, the crisis years should jump out at you immediately. Here's what that looks like for the Core Portfolio:
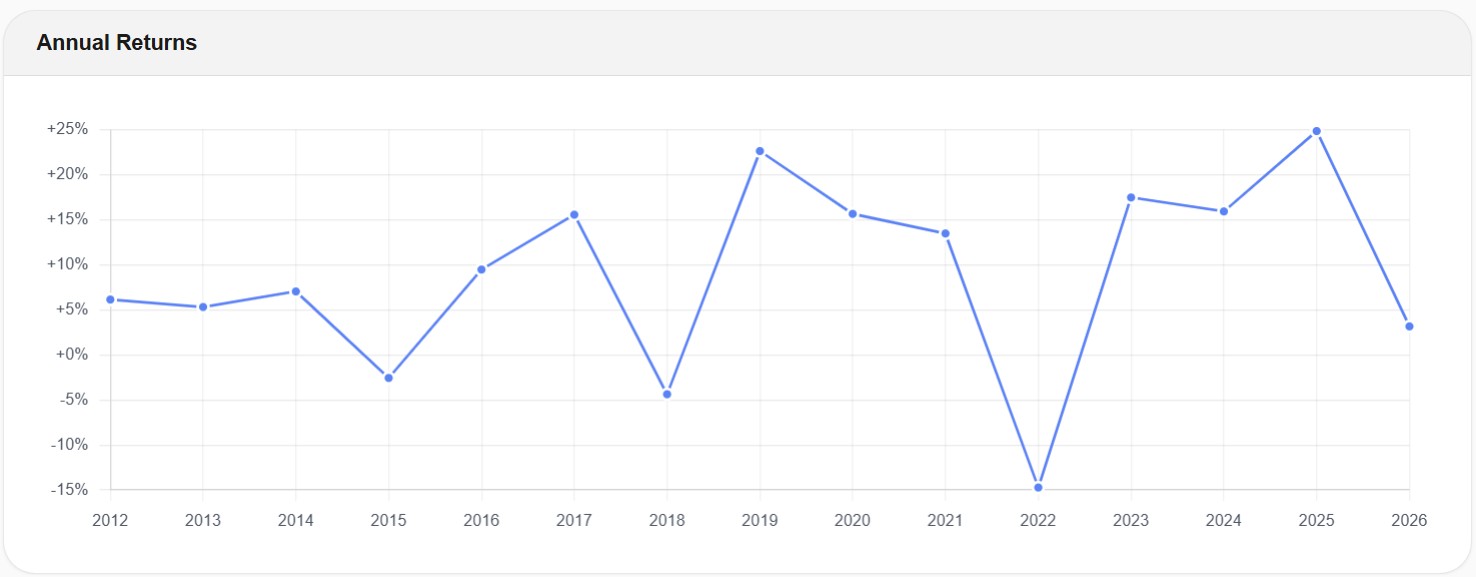
You can see 2018 (-4.3%) and especially 2022 (-14.8%) standing out — those are the stress-test years. A well-diversified portfolio doesn't need to be positive in every year. What it needs to do is recover. The Core rebounded with +17.4% in 2023 and has been steadily positive since. That behavior — moderate drawdown, timely recovery — is what you're actually testing for.
The lesson: when you look at a backtest, don't just stare at the total return line. Zoom into the worst years. That's where you find out if the strategy is real.
Mistake #4 — Using Monthly Data Instead of Daily Data
This is the mistake almost no one talks about, and it's the one that can quietly invalidate an entire backtest.
Most free backtesting tools — including many of the widely-used ones — run on monthly data. That means they use 12 data points per year. A full year of market activity gets compressed into 12 numbers: one for January, one for February, and so on.
Daily data uses roughly 252 data points per year (the number of trading days). That's over 20 times more granular.
Why this matters
Monthly data systematically hides intra-month volatility. Consider March 2020: the S&P 500 opened around 3,000, crashed to 2,237 on March 23, and closed the month near 2,584. If you only look at monthly closes, you see a month where the index dropped around 13%. Uncomfortable, but survivable.
If you look at daily data, you see something very different: an intra-month drawdown of roughly -34% from the February peak. That's the number that actually matters — because that's the number your investor psychology had to survive in real time. That's the number that determines whether you held on or capitulated.
A monthly backtest will under-report max drawdown, under-report realized volatility, and give you Sharpe and Sortino ratios that look better than what you would have actually experienced. It's not a small distortion. For a volatile portfolio in a crisis period, the gap between "monthly-data max drawdown" and "daily-data max drawdown" can be 10–15 percentage points.
This is one of the reasons we built Awalyt's backtesting tool on daily data from day one. Every backtest runs on 252 points per year instead of 12. When you see the -23.98% max drawdown for the Core Portfolio above, that's the real number — measured on the actual worst day, not smoothed by monthly averaging. If you're going to backtest a strategy before committing real money, you want to see the real risk, not a comforting approximation of it.
If you're currently using Portfolio Visualizer or a similar monthly-data tool, we put together a detailed side-by-side comparison in our Awalyt vs. Portfolio Visualizer breakdown, showing exactly how granularity affects the reported numbers.
Mistake #5 — Looking Only at Returns, Ignoring Risk Metrics
Ask most investors how a backtest went, and they'll tell you the total return. Maybe the CAGR if they're being thorough. That's it.
But returns, in isolation, are almost meaningless. Two portfolios with identical CAGRs can deliver completely different experiences to the investor holding them. One might get there with a smooth ride and a -15% max drawdown. The other might get there through a -45% drawdown that made you question everything you believed about investing. Same return, wildly different realities.
A proper backtest report should include, at minimum:
- CAGR — annualized return
- Volatility (standard deviation) — how much the portfolio bounces around
- Max drawdown — the worst peak-to-trough decline, ever
- Sharpe ratio — return per unit of total risk
- Sortino ratio — return per unit of downside risk (arguably more relevant)
- Correlation matrix — how your assets actually moved relative to each other
- Benchmark comparison — vs. a simple alternative like SPY or a 60/40 portfolio
Correlations in particular get ignored, and they shouldn't. An investor might build what looks like a diversified portfolio — US stocks, international stocks, REITs — and assume they're well protected. But during stress periods, correlations between risk assets often spike toward 1.0, and the diversification they thought they had quietly disappears.
Here's a real example from the Core Portfolio during Q3 2022, one of the toughest market periods of the last decade:
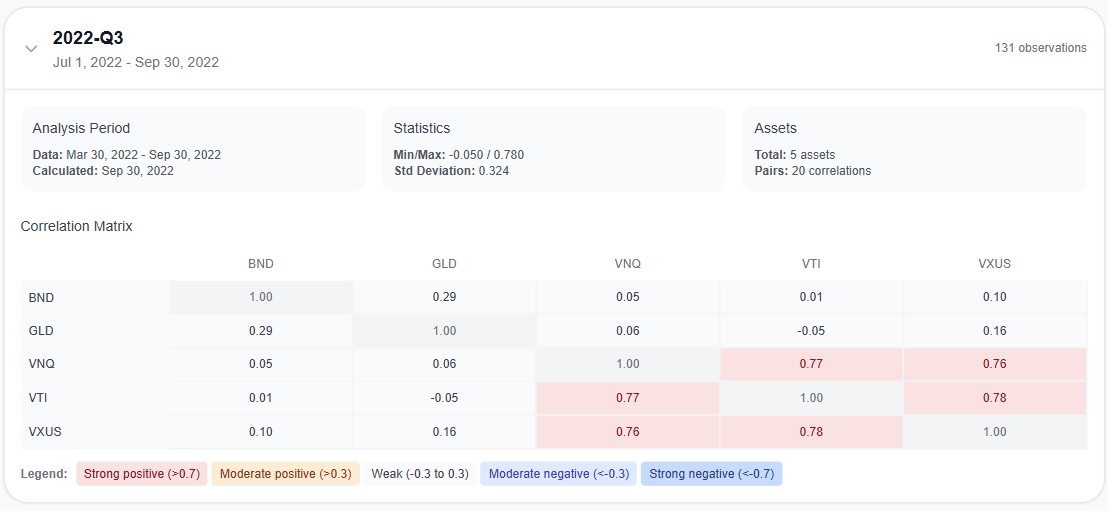
Look at what's revealed here. During that stress window, VTI (US stocks), VXUS (international stocks), and VNQ (REITs) all correlated strongly with each other — values of 0.76 to 0.78. That's three "different" asset classes basically moving as one during a crisis. The true diversifiers were BND (bonds) and GLD (gold), which showed near-zero correlation to the equity block.
This is information a returns-only backtest would completely hide. And it's the kind of information that changes how you think about what "diversified" actually means.
Mistake #6 — Treating Backtests as Predictions of the Future
This last one is more philosophical, but it's arguably the most important. Because even if you avoid every mistake above — even if you run a clean, long, daily-data, multi-regime, risk-aware backtest — you can still misuse the result by treating it as a forecast.
A backtest tells you what would have happened. It does not tell you what will happen. The two are related, but they are not the same thing, and conflating them is one of the fastest ways to get hurt in markets.
Here's the correct mental model. A backtest is a stress test for a strategy — a way of asking questions like:
- How volatile was this portfolio historically? Can I emotionally handle that?
- How deep did it draw down at its worst? Would I have held through that?
- How long did recovery take? Can I stomach a 3-year recovery period?
- How did it behave relative to my benchmark during different regimes?
These are all questions about behavior and risk, not about future returns. When you use a backtest to answer those questions, it's one of the most useful tools in retail investing. When you use it to answer "how much will this make me next year?", you're using the wrong tool for the job.
The people who get the most out of backtesting are the ones who use it to build conviction — not conviction in specific return numbers, but conviction in how a strategy behaves under pressure. That conviction is what lets you hold on through the 2020s and 2022s of the world, instead of selling at the bottom and missing the recovery.
The Checklist: Backtesting Done Right
Before you trust any backtest — your own or someone else's — run through this:
- Is there a thesis first, or was the portfolio reverse-engineered from known winners? (Avoid Mistake #1)
- Does the backtest cover at least 10–15 years? (Avoid Mistake #2)
- Does it include at least one major crisis period? (Avoid Mistake #3)
- Is it running on daily data, or is it smoothing reality with monthly points? (Avoid Mistake #4)
- Does it report max drawdown, volatility, Sharpe, Sortino, and correlations — not just return? (Avoid Mistake #5)
- Am I using it to understand risk and behavior, or am I using it as a forecast? (Avoid Mistake #6)
If your backtest clears all six, it won't tell you the future — nothing does. But it will give you something nearly as valuable: a grounded, evidence-based understanding of how your strategy is likely to behave when markets get difficult. And that is the foundation for making investment decisions you can actually stick with.
Want to test these insights on your own portfolios?
Awalyt is a portfolio analysis platform: backtesting on daily data, fundamental analysis, asset analysis, and AI-powered insights.
Get Started FreeRelated Insights
What Is Portfolio Backtesting? A Complete Guide for DIY Investors [2026]
12 min read
Core + Satellite Portfolio Strategy: How to Build a Portfolio That Grows AND Protects Your Money [2026]
10 min read
How to Check ETF Overlap for Free (VOO vs QQQ) [2026]
9 min read