AWALYT vs Portfolio Visualizer
See What Monthly Data Has Been Hiding
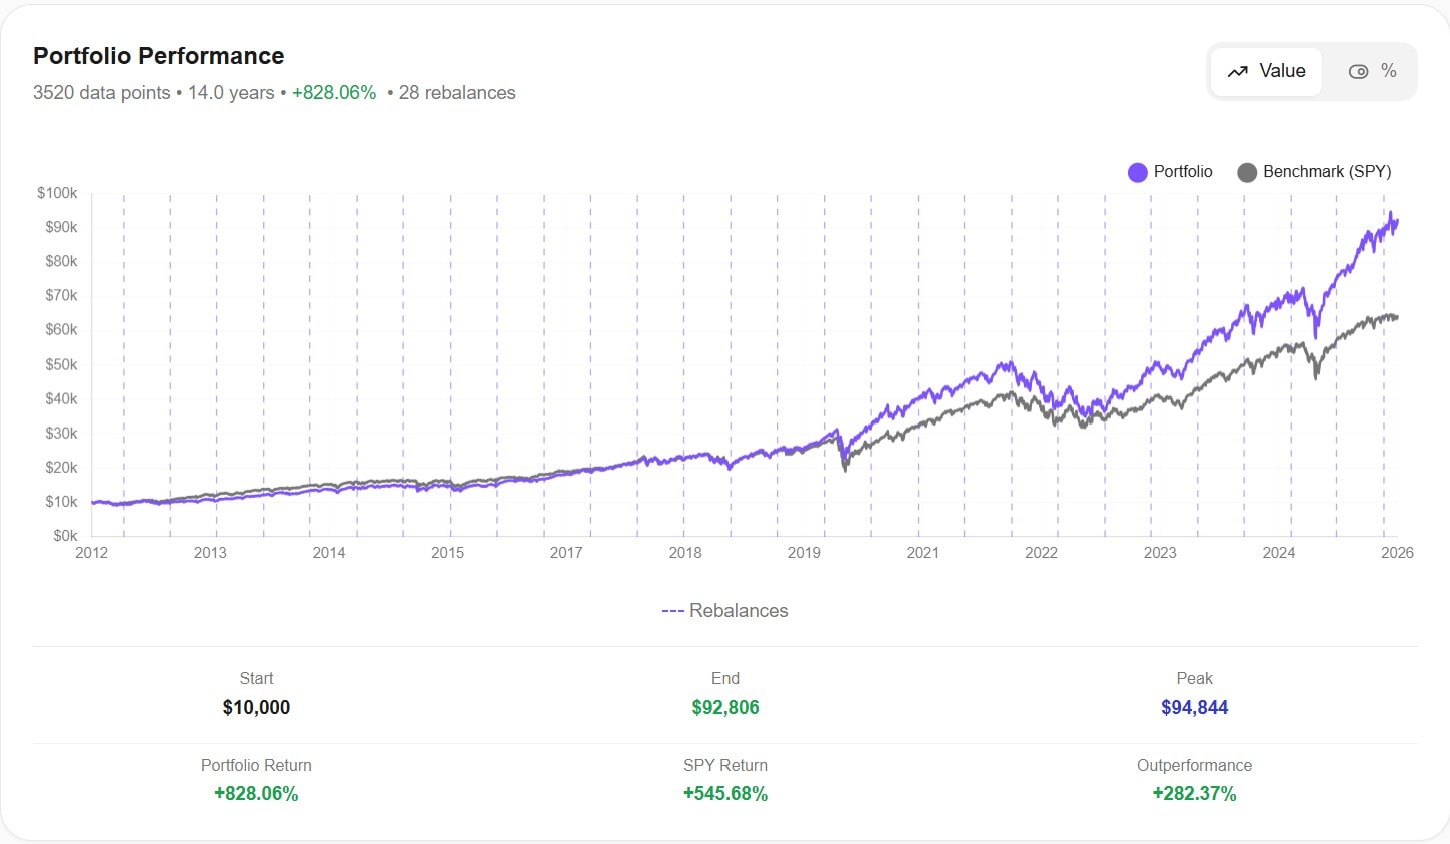
Portfolio Visualizer has been the standard for portfolio backtesting since 2013. But monthly data means you're only seeing 5% of the picture. AWALYT uses daily data — 252 points per year — so you see the real risk, the real drawdowns, and the real performance.
Side-by-Side Comparison
| Feature | Portfolio Visualizer | AWALYT |
|---|---|---|
| Data Granularity | Monthly (12 pts/year) | Daily (252 pts/year) |
| Free Backtest History | Limited to 10 years | Full available history |
| Pricing | Free (limited) / $30–$55/month | Free, or $119/year all-in |
| Max Assets | 15 assets | No limit |
| Rebalancing Detail | Final allocation only | Full buy/sell log at every rebalance |
| Correlation Analysis | Single static matrix | Quarterly matrices across entire period |
| AI Analysis | Basic / generic | Grounded in your actual backtest data |
| Fundamental Analysis | Not available | Full module included |
| Drawdown Accuracy | Understated (monthly smoothing) | True daily drawdowns |
| User Interface | Recently redesigned (criticized) | Clean, modern, intuitive |
| Monte Carlo Simulation | Yes | On roadmap |
| Portfolio Optimization | Yes | On roadmap |
| Factor Regression | Yes | On roadmap |
Where AWALYT Outperforms Portfolio Visualizer
252 data points per year vs 12. That's not a small difference.
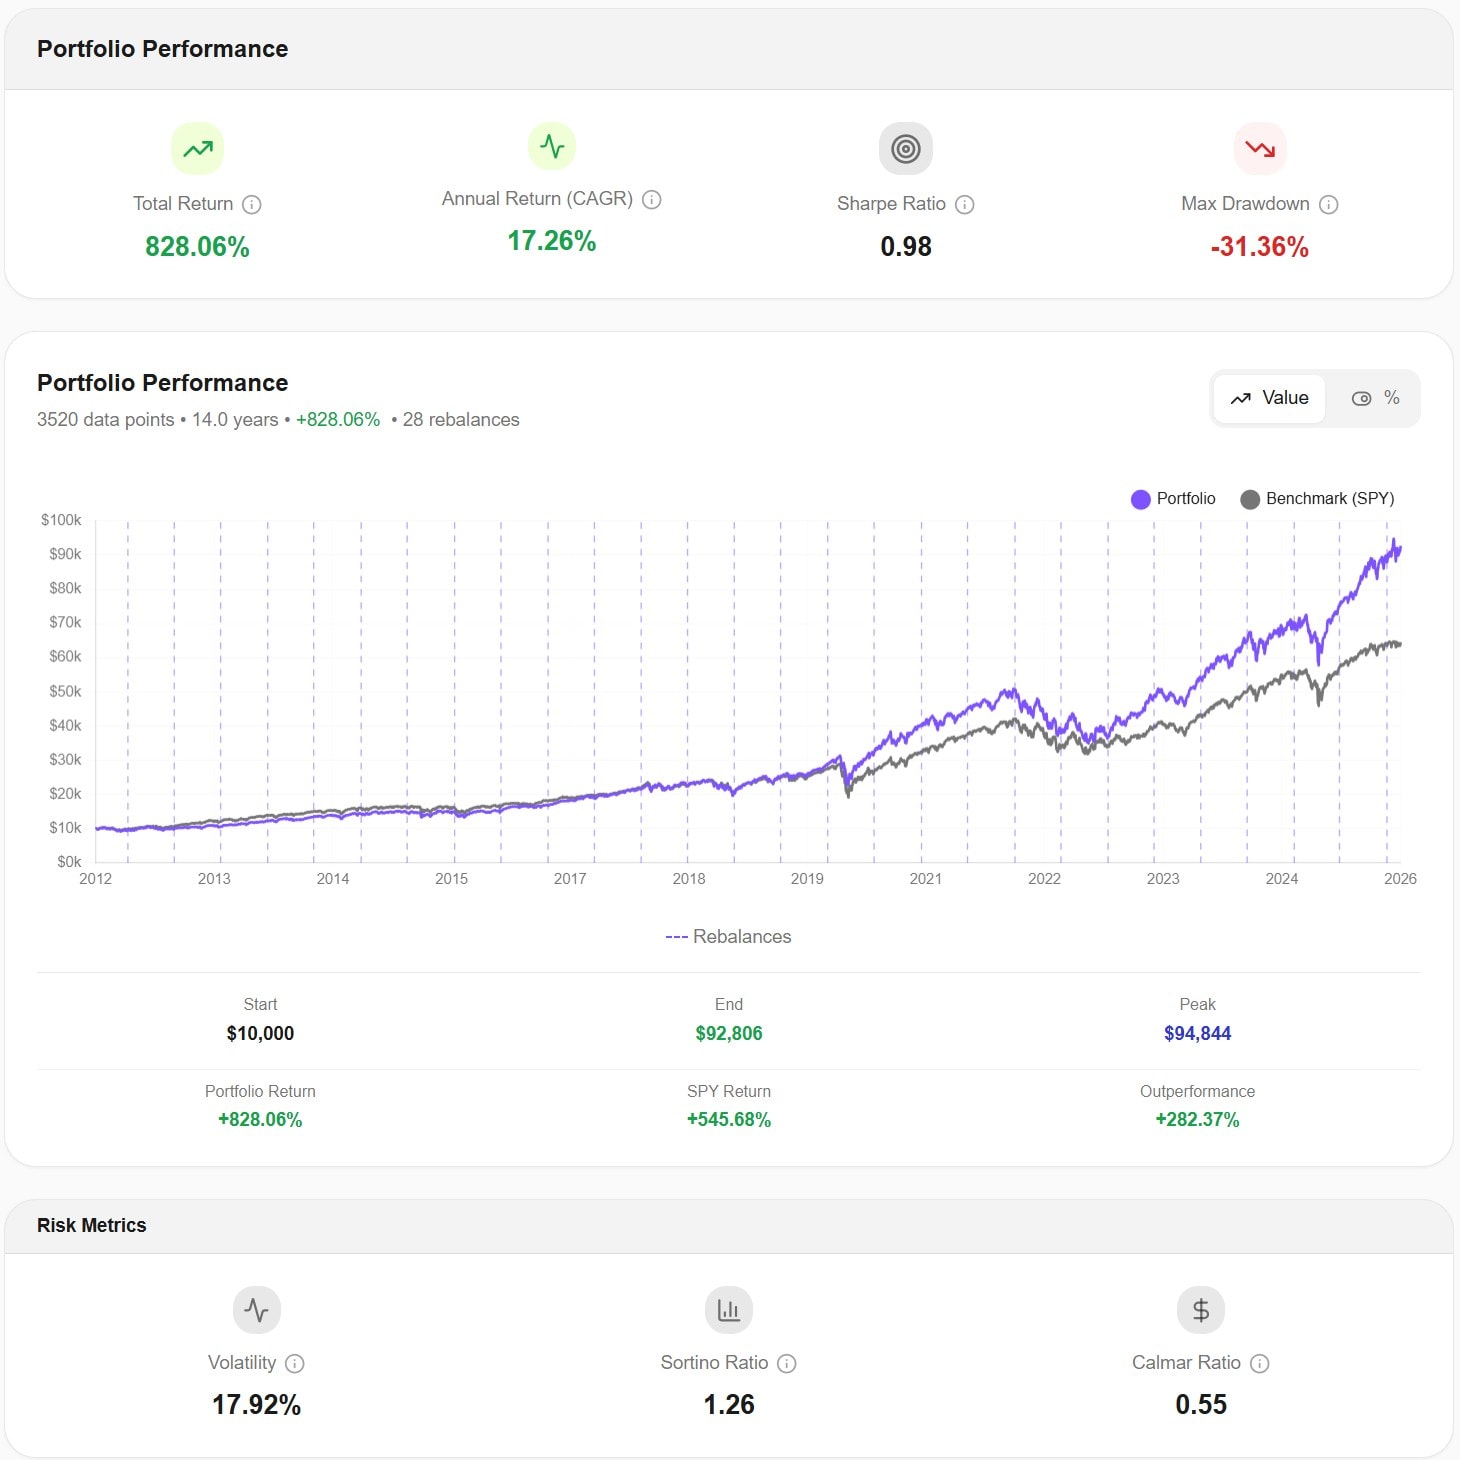
Portfolio Visualizer uses monthly returns — just 12 data points per year. This systematically understates volatility and hides the true depth of drawdowns. The March 2020 COVID crash? In monthly data, it looks like a moderate dip. In daily data, you see the 34% drop that actually happened. AWALYT processes 252 daily data points per year, so your risk metrics, Sharpe ratios, and drawdown figures reflect what actually happened in the market.
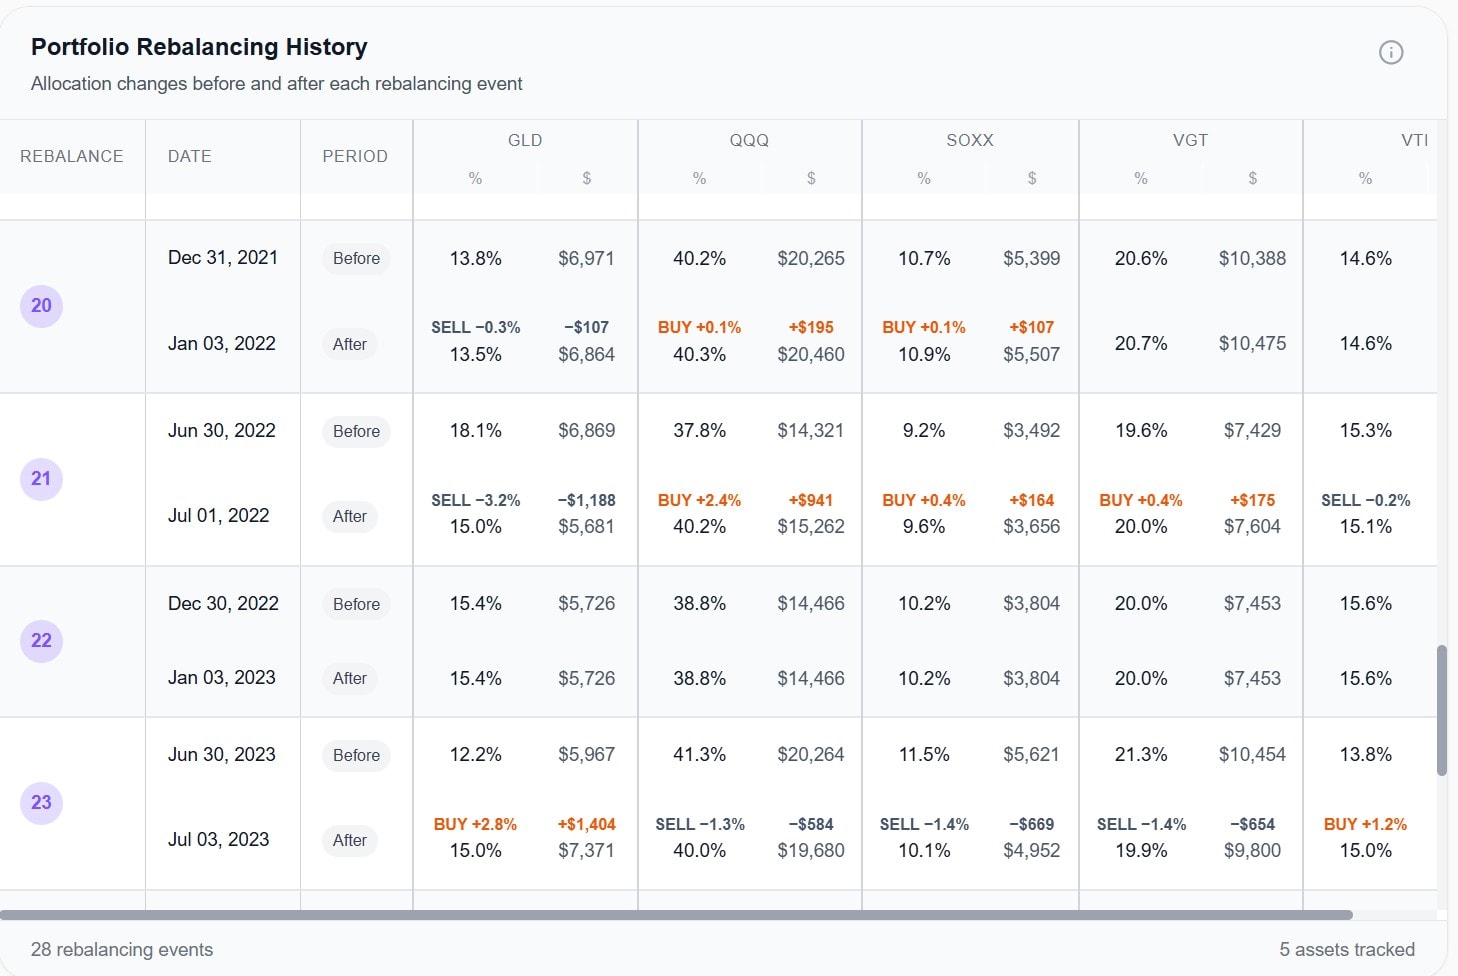
See the trades, not just the result
When Portfolio Visualizer shows a rebalanced portfolio, you see the outcome — but not how you got there. You don't know how much of each asset was sold or bought at each rebalance. AWALYT logs every rebalancing event with exact dollar amounts and percentage changes for each asset, before and after. This matters because rebalancing has real-world costs: commissions, spreads, and tax implications.
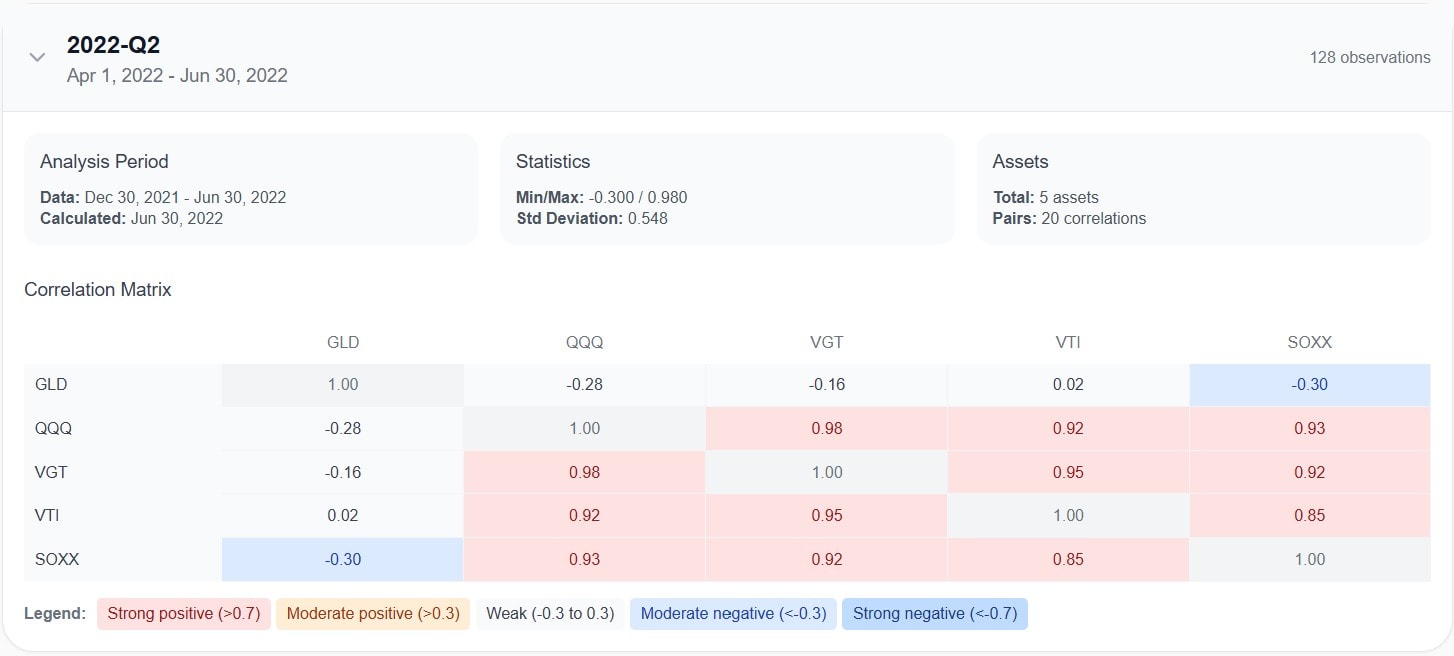
Correlations aren't static. Your tool shouldn't pretend they are.
Portfolio Visualizer gives you one correlation matrix for your entire backtest period. That single number averages out years where assets moved together and years where they didn't. AWALYT computes a new correlation matrix every quarter, so you can see exactly when your diversification worked and when it failed.
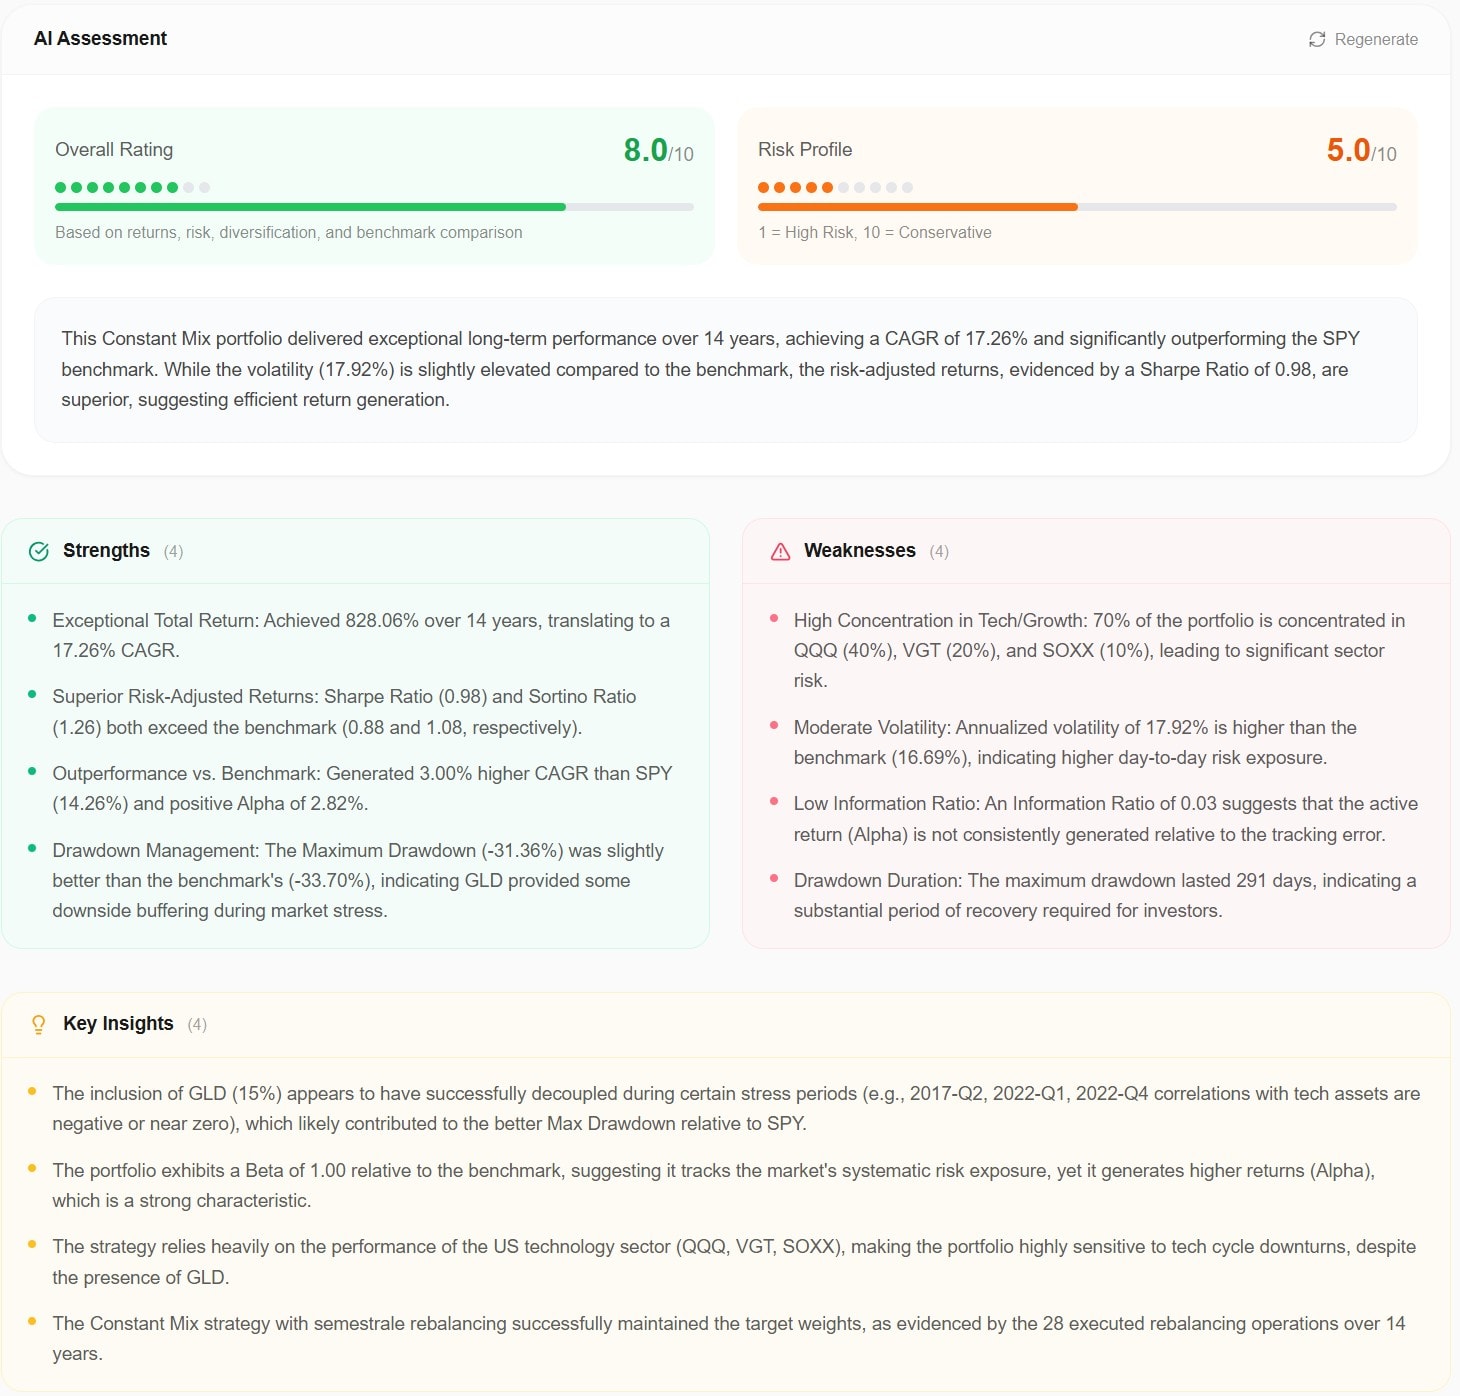
AI analysis grounded in data, not generating guesses
Portfolio Visualizer recently added AI features, but they're generic insights applied to any portfolio. AWALYT's AI reads the actual numerical output of your specific backtest — your returns, your drawdowns, your correlations — and produces a detailed assessment with strengths, weaknesses, and key insights. It cannot hallucinate because it only works with your real data.
Where Portfolio Visualizer Has the Edge — For Now
We believe in transparency, so here's what Portfolio Visualizer offers that AWALYT doesn't — yet.
Portfolio Visualizer has Monte Carlo simulation for modeling future portfolio scenarios and survival rates. It offers portfolio optimization tools including efficient frontier analysis and the Black-Litterman model. It also provides Fama-French factor regression for analyzing portfolio exposure to market, size, value, and momentum factors. And its asset class backtesting reaches back to 1972.
These are powerful features, and if you rely on them, Portfolio Visualizer remains valuable. But if your primary need is accurate backtesting with real risk visibility, rebalancing detail, and data-driven analysis, AWALYT delivers what Portfolio Visualizer's monthly data fundamentally cannot.
Several of these features are on AWALYT's roadmap.
Why Monthly vs Daily Data Matters More Than You Think
This isn't a minor technical detail. It changes your decisions.
Max drawdown is understated
If a portfolio dropped 30% mid-month but recovered to 20% down by month-end, monthly tools report a 20% drawdown. The real drawdown was 30%.
Volatility is underreported
Smoothing 252 daily price movements into 12 monthly returns mechanically reduces measured volatility.
Sharpe ratios are inflated
Lower measured volatility and shallower reported drawdowns make any strategy look better on a risk-adjusted basis than it actually was.
Correlation timing is missed
If two assets became highly correlated for three weeks during a crisis but diverged by month-end, monthly data shows no correlation spike at all.
In short: monthly tools make every portfolio look less risky than it really is.
Pricing
PV Free $0 | PV Basic $30/mo $360/year | PV Pro $55/mo $660/year | Awalyt Free, or $119/year all-in | |
|---|---|---|---|---|
| Assets | 15 max | 150 max | 150 max | No limit |
| History | 10 years max | Full | Full | Full |
| Data Frequency | Monthly | Monthly | Monthly | Daily |
| Save Portfolios | No | 50 | 150 | Yes |
| Export | No | CSV / PDF | CSV / PDF | Coming soon |
| AI Analysis | No | Basic | Basic | Full (data-grounded) |
| Fundamental Analysis | No | No | No | Yes |
What the Investing Community Says
From the Bogleheads forum — the largest community of self-directed investors
“My only gripe about PV is that it uses monthly data. Weekly or daily would be better.”
— Bogleheads forum member
“PV only has monthly data, so it cannot know about significant intra-month drops like December 2018 and March 2020.”
— Bogleheads forum member
“Limited to 10 years for a custom backtest. A sad day for a lot of us DIY investors.”
— Bogleheads forum member
“The new version is terrible. So many steps to get to backtesting.”
— Bogleheads forum member
Frequently Asked Questions
For backtesting, risk analysis, and fundamental analysis — yes, AWALYT provides a more accurate and detailed experience thanks to daily data, rebalancing logs, and AI analysis. However, if you rely on Monte Carlo simulation, portfolio optimization, or factor regression, Portfolio Visualizer still has those features. AWALYT plans to add these over time.
Their system was built on monthly data from the start. Monthly data is cheaper to source and easier to compute, but it systematically underestimates risk. AWALYT was built from scratch with daily data as a core design principle.
Awalyt has a Free plan, free forever. Premium is $119/year ($9.90/mo, billed annually) with everything included.
If your main use case is backtesting and portfolio analysis, AWALYT provides more accurate data (daily vs monthly), more detail (rebalancing logs, quarterly correlations), and AI-powered insights — free to start, with Premium at $119/year all-in. We recommend trying it alongside PV and comparing the results yourself.
Absolutely. Many investors use multiple tools. You might use Portfolio Visualizer for Monte Carlo simulations and AWALYT for backtesting and fundamental analysis. The daily data in AWALYT will give you a more realistic risk picture to complement PV's broader toolset.
See What Monthly Data Has Been Hiding
Create a free account. Run the same backtest you'd run on Portfolio Visualizer — and compare the results.
Get Started FreePortfolio Visualizer is a trademark of SRL Global. AWALYT is not affiliated with Portfolio Visualizer or SRL Global.