Is VOO + QQQ + SCHD + VWO + VXUS Diversified? [2026]
You own VOO and QQQ for US growth, SCHD for dividends, and you added VWO and VXUS so you'd have some international exposure. Five funds, three styles, two sides of the globe. On a brokerage screen that looks like a diversified portfolio.
Run fourteen years of it through a backtest and a soberer picture shows up. The five-fund mix turned $10,000 into $52,794. The S&P 500 on its own turned the same $10,000 into roughly $71,000. You trailed the index you were trying to improve on by 183 percentage points, and for most of those years the five funds moved as one.
"Am I diversified if I own multiple ETFs" is one of the most common questions DIY investors ask, and the honest answer is: a lot less than the ticker count suggests, and the only way to know how much is to look at the correlations. So let's look, on exactly this portfolio.
The analysis below is for educational purposes only and is not investment advice. Past performance does not guarantee future results. The portfolio shown is an illustration, not a recommendation; your own risk depends on which assets you hold and how much you allocate to each.
The portfolio I tested
Equal weight, 20% in each of five funds, rebalanced twice a year, run from January 2012 to June 2026 against the S&P 500 (SPY). The holdings:
- VOO (20%): the S&P 500 itself, US large-cap core.
- QQQ (20%): the Nasdaq-100, US large-cap growth and tech.
- SCHD (20%): US dividend and value, the supposed counterweight to growth.
- VWO (20%): emerging-markets equity.
- VXUS (20%): international developed markets, ex-US.
That works out to 60% US equity and 40% international, spread across three styles and two regions. It's a textbook "I diversified" allocation, the kind of mix that turns up constantly on r/ETFs and Bogleheads. Whether it's diversified in practice is a question the correlations answer, not the labels.
Diversification is about correlation, not count
A portfolio is diversified when its holdings don't all fall at the same time. That's it. The number of funds is beside the point; what matters is whether they move together, and the measure for that is correlation. Two funds at +1.0 are the same bet wearing different names. Two near zero genuinely spread your risk, and two at -1.0 fully offset.
So the real question behind "do I own enough ETFs" is whether your ETFs move differently from one another, which is something you can settle with data instead of intuition. Awalyt's backtesting engine builds a correlation matrix for every quarter of a test, and that quarter-by-quarter view is what makes the rest of this possible.
VOO, QQQ and SCHD are mostly one bet
Start with the three US funds, the core of most portfolios like this one. Across fourteen years they tracked the S&P almost perfectly. Here is each holding's correlation to the index, year by year.
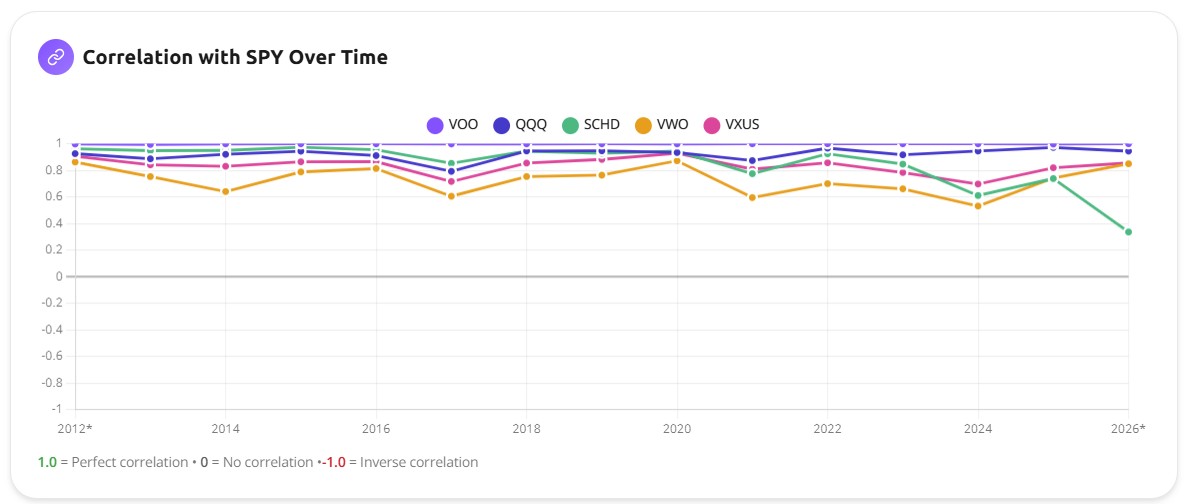
VOO is the flat line pinned near 1.0, which is no surprise, since it is the S&P 500 in all but name. QQQ rides just under it and rarely drops below 0.90. SCHD, the supposed value counterweight, spends most of the period between 0.85 and 0.95. Three funds sold as broad-market, growth, and dividend, and for most of the decade they were the same bet at slightly different volumes. Adding QQQ on top of VOO didn't spread your risk; it pushed you further into large-cap US tech.
The two lower lines are the international funds, and that's where it gets more interesting.
Where the diversification actually showed up
The international sleeve did earn part of its keep. VWO, emerging markets, is the lowest line on that chart the whole way through, correlating to the S&P somewhere between 0.55 and 0.80 depending on the year, with VXUS a step above it. Neither is a strong diversifier, moderate positive correlation still means they mostly fall when US stocks fall, but they pulled the portfolio's average correlation down and softened the ride.
The more revealing diversification was hiding inside a single regime. Look at the second quarter of 2022, when rising rates were punishing growth stocks.
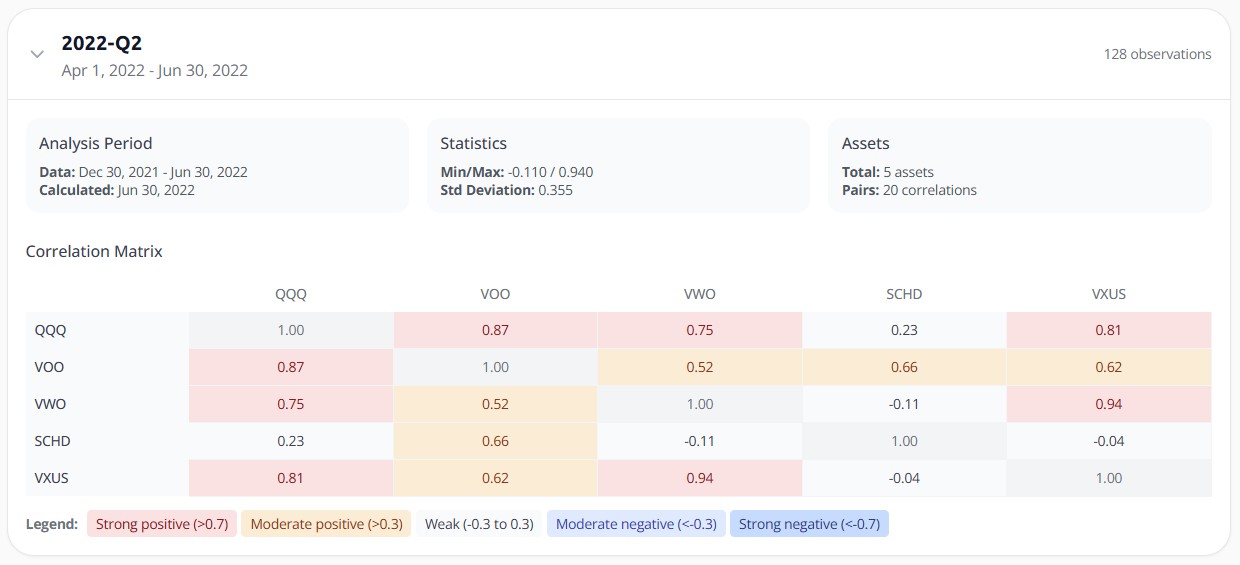
VOO and QQQ stayed joined at the hip at 0.87. But SCHD broke away: its correlation with QQQ fell to 0.23, and it turned slightly negative against both international funds. The value tilt that looked redundant in calm years did exactly what diversification is supposed to do in the one quarter it counted, holding up while growth got sold off. That's the honest case for owning a value fund next to growth, not that it helps every year, but that it helps in the specific years growth breaks.
So the answer so far isn't a flat no. Style and geography added something real. The trouble is that the something doesn't stay put.
...and where it vanished
Correlation isn't a fixed property of a fund. It drifts with the regime, and the 2022 dispersion didn't last. By the second quarter of 2025, in the middle of a broad rally, the five funds had snapped back together.
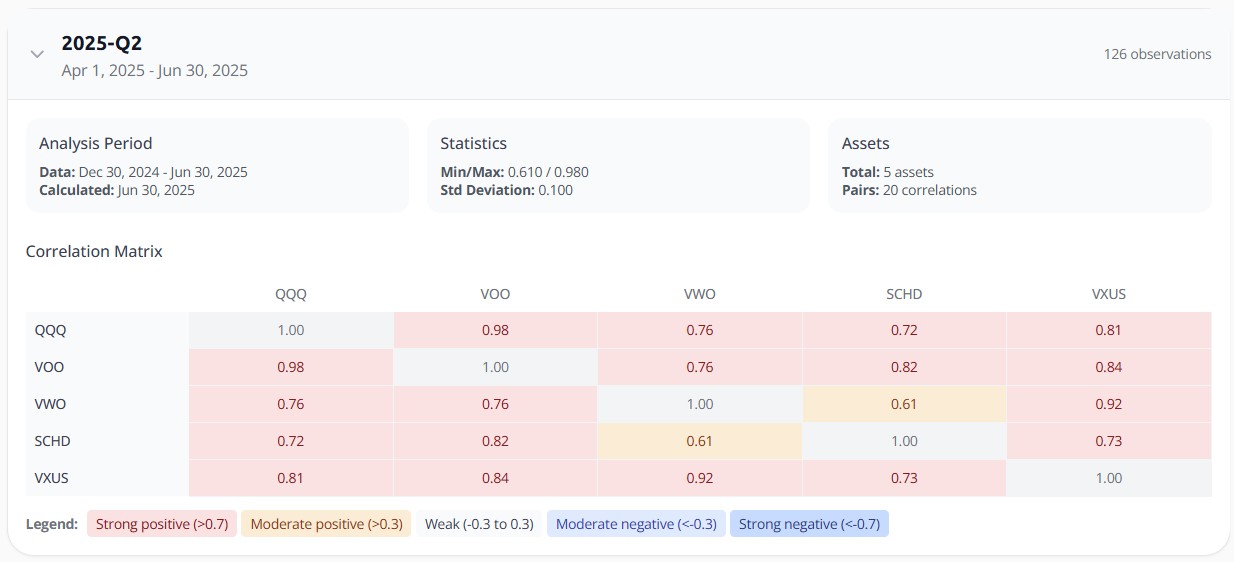
Every pair now sits between 0.61 and 0.98. QQQ and VOO are at 0.98. VWO, the reliable decoupler, had climbed back to 0.76 against the US funds. SCHD rejoined the pack. The dispersion that handed you a little protection in 2022 was gone, and the portfolio was once again moving more or less in lockstep.
This is the part that catches people. The diversification you can measure in one backtest is not the diversification you'll have in the next regime. It comes and goes, and it tends to be thinnest in exactly the rallies that make holding everything feel safest.
What the spread cost you
None of this would matter much if the diversification were free. It wasn't.
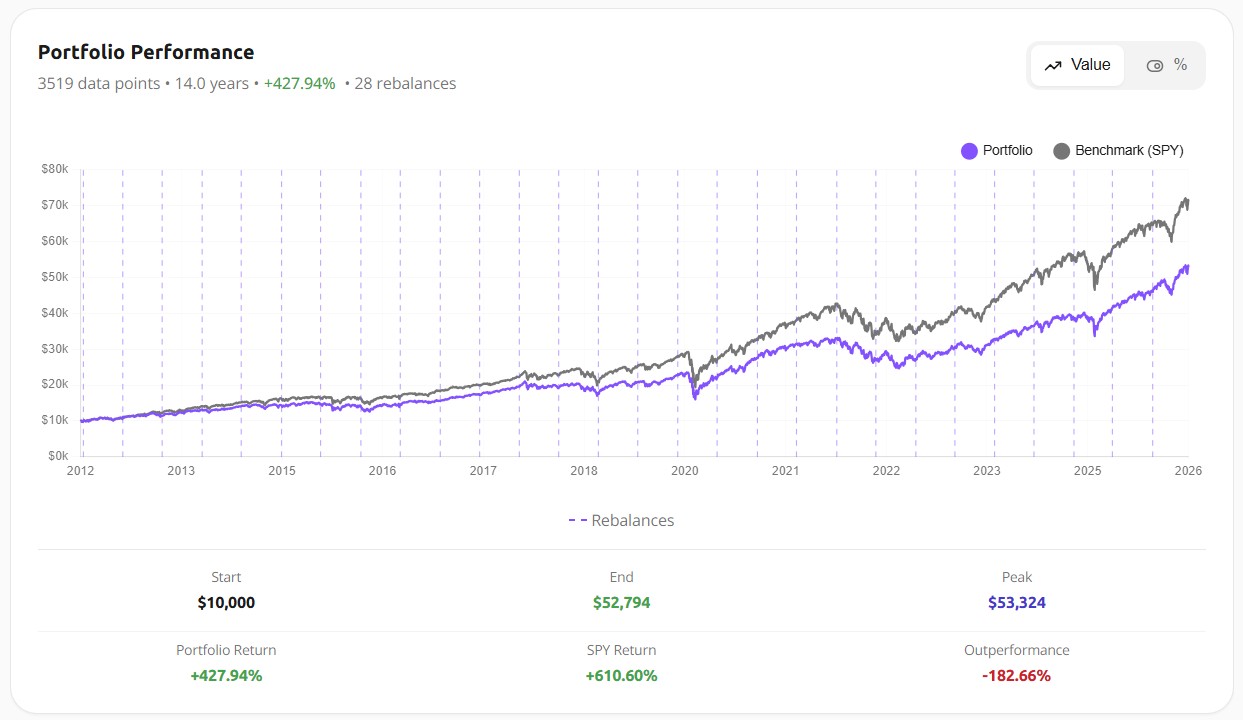
The five-fund portfolio returned +427.94% over the period. The S&P alone returned +610.60%. You can see the two lines share a shape, every dip and recovery roughly in sync, with the portfolio sitting a little lower the entire way. That's the visual signature of weak diversification: when your chart is a dimmer copy of the benchmark's, you didn't build something different, you built a watered-down version of the same thing.
Awalyt's AI layer read the full 55-quarter correlation history and landed in the same place in plainer language: the US core ran "often above 0.9," the international funds "often provided diversification" in certain periods, and the net result was a slightly lower risk profile with mixed returns. Slightly lower risk, 183 points less return. That's the trade you made by holding five funds instead of one.
So what would actually diversify it?
If five equity funds move together, the fix isn't a sixth equity fund. In my experience the thing people reach for next is another flavor of US stock, which changes almost nothing. What moves the needle is owning things that answer to different forces. Bonds and gold sit far lower on the correlation scale than any stock fund, because they respond to interest rates and fear rather than corporate earnings. In a separate fourteen-year test, gold had the worst standalone drawdown of any holding yet reduced total portfolio risk, precisely because its correlation to the S&P is near zero. That's the kind of decoupling five equity ETFs can't give you, however you cut the styles.
International equity, the diversifier in this portfolio, helps at the margin but tops out around 0.5 to 0.8 correlation, so it dampens rather than offsets. The gold diversification backtest shows what genuinely uncorrelated behaviour looks like on real data. And since this question is a close cousin of "do these funds secretly hold the same stocks," checking ETF overlap is the natural companion check to run next.
Bottom line
Five funds did not make this portfolio diversified. It spent most of fourteen years as a slightly underperforming version of the S&P 500, with brief, regime-dependent stretches where the value tilt or the emerging-markets sleeve pulled away, and a recent rally where even those fell back into line. Diversification is something you measure, not something you count. Before you add another fund to feel safer, run the correlation matrix on what you already hold and check whether the new ticker moves differently, or just adds one more line to the same bet.
Want to test these insights on your own portfolios?
Awalyt is a portfolio analysis platform: backtesting on daily data, fundamental analysis, asset analysis, and AI-powered insights.
Get Started FreeRelated Insights
What Is Portfolio Diversification? (And How to Measure If You Actually Have It) [2026]
13 min read
How 15% Gold Turned an Aggressive Tech Portfolio into a Market-Beating Strategy
11 min read
The Best Way to Analyze Portfolio Risk [2026]
11 min read