How 15% Gold Turned an Aggressive Tech Portfolio into a Market-Beating Strategy
Investing forums are full of portfolios that look great on paper: heavy tech allocations, semiconductor exposure, leveraged bets on the Nasdaq. The returns are eye-catching. The drawdowns are terrifying. And most investors who try them end up panic-selling at exactly the wrong time.
But what if you could keep the upside of an aggressive tech portfolio while meaningfully reducing the damage during crashes? That's the question behind this backtest — and the answer involves the most boring asset in finance: gold.
We tested a portfolio of QQQ (40%), VGT (20%), GLD (15%), VTI (15%), and SOXX (10%) with a Constant Mix rebalancing strategy over 14 years using AWALYT's daily-data backtesting engine. The result: +828.06% total return versus SPY's +545.68% — an outperformance of +282 percentage points — with a max drawdown that was actually shallower than the S&P 500.
Here's how it worked, why it worked, and what the AI analysis reveals about its risks.
The Portfolio: 85% Tech Conviction, 15% Insurance
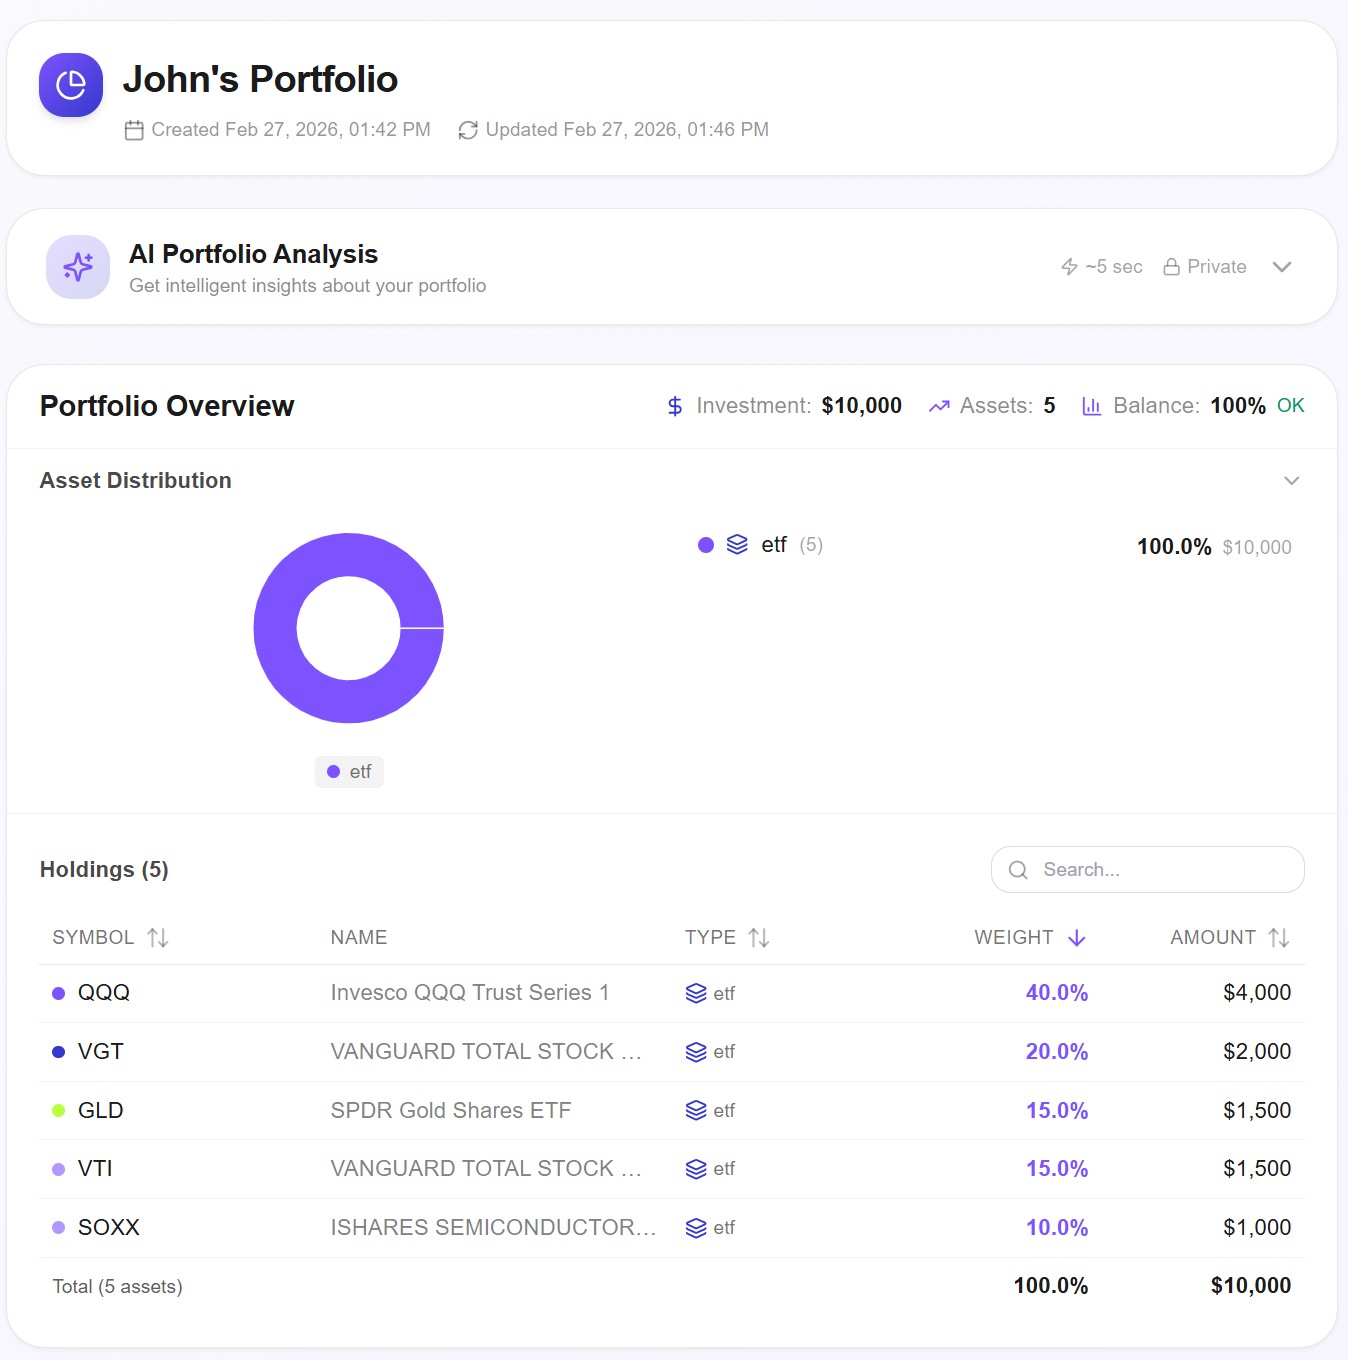
The construction is deliberately lopsided. Four of the five holdings are equity-heavy with massive tech overlap:
QQQ (40%) — The Nasdaq 100. Your core growth engine, dominated by Apple, Microsoft, Nvidia, and Amazon. This is the single largest position and the primary driver of returns.
VGT (20%) — Vanguard Information Technology ETF. Doubles down on the tech sector specifically, adding companies like Salesforce and Accenture that may not be in the Nasdaq 100.
VTI (15%) — Vanguard Total Stock Market. Provides breadth across the entire US market, including mid-caps and small-caps that QQQ and VGT miss.
SOXX (10%) — iShares Semiconductor ETF. A concentrated bet on the semiconductor supply chain — the most volatile holding in the portfolio but also the highest-returning sector of the last decade.
GLD (15%) — SPDR Gold Shares. The outlier. Gold has no earnings, pays no dividends, and generates no cash flow. It's here for one reason: it behaves differently from everything else in the portfolio when markets crash.
This isn't a "balanced" portfolio by any textbook definition. It's a conviction bet on US tech with a strategic hedge. The question is whether that hedge earns its 15% allocation.
The Results: $10,000 → $92,806
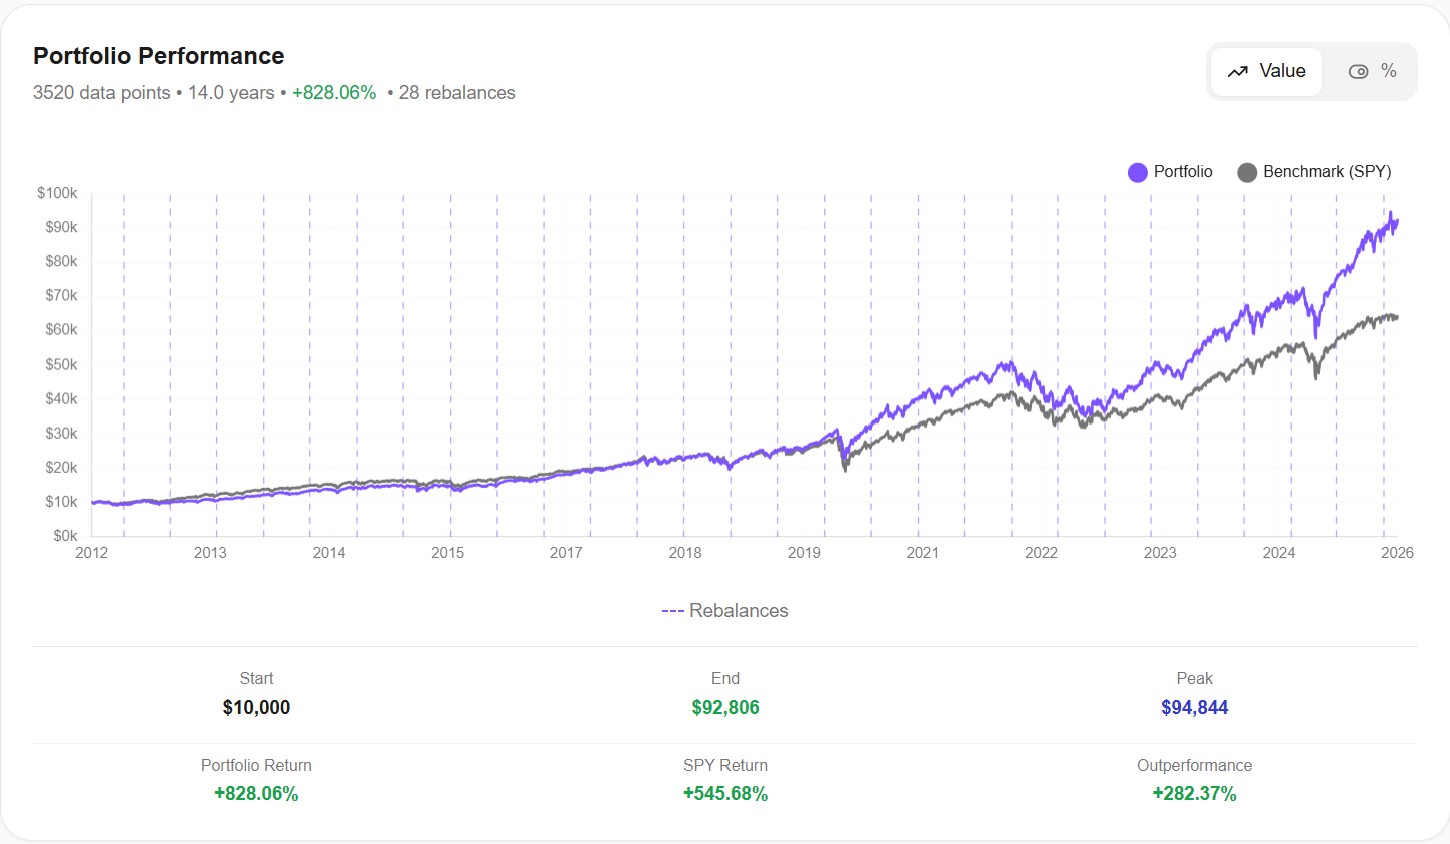
Over 14 years (February 2012 – February 2026), $10,000 invested in this portfolio grew to $92,806 — an annualized return of 17.26% (CAGR). The same $10,000 in SPY would have reached approximately $64,568 (+545.68%).
The performance chart tells a nuanced story. From 2012 to 2018, the portfolio and SPY tracked closely. The real separation began in 2019 and accelerated through the post-COVID recovery. By 2024, the portfolio was consistently running 40-50% ahead of SPY in absolute terms.
Key metrics from the backtest:
| Metric | Tech + Gold Portfolio | SPY (Benchmark) |
|---|---|---|
| Total Return | +828.06% | +545.68% |
| CAGR | 17.26% | 14.26% |
| Sharpe Ratio | 0.98 | 0.88 |
| Sortino Ratio | 1.26 | 1.08 |
| Max Drawdown | -31.36% | -33.70% |
| Volatility | 17.92% | 16.69% |
| Alpha | +2.82% | N/A |
| Beta | 1.00 | N/A |
The standout number: max drawdown of -31.36% versus SPY's -33.70%. A portfolio that's 85% equities (with heavy tech and semiconductor exposure) experienced a shallower worst-case crash than the broad market. That shouldn't happen — unless something in the portfolio is doing its job as a hedge.
Why Gold Made the Difference: The Correlation Story
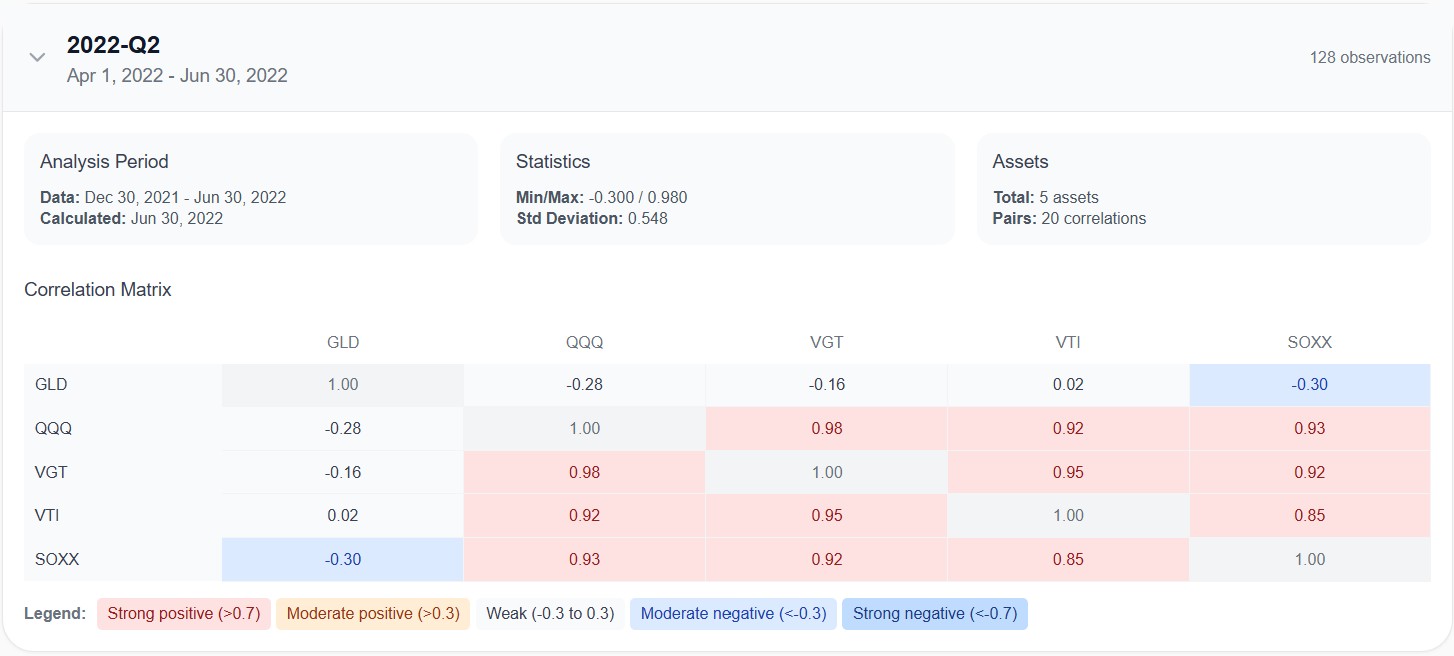
This correlation matrix from Q2 2022 — the worst quarter for tech stocks in the backtest period — reveals exactly why gold works in this portfolio.
Look at the equity correlations: QQQ and VGT are correlated at 0.98. QQQ and SOXX at 0.93. QQQ and VTI at 0.92. These four holdings essentially move as one during a crisis. If you held only equities, you'd have no diversification when it matters most.
Now look at GLD: its correlation with QQQ is -0.28, with VGT -0.16, and with SOXX -0.30. Gold didn't just not fall with tech — it moved in the opposite direction. During the exact period when every tech holding was getting crushed, gold was providing a buffer.
This is the core insight: diversification isn't about holding many assets. It's about holding assets that behave differently when things go wrong. Four tech-heavy ETFs give you zero diversification despite being four different ticker symbols. One gold allocation fundamentally changes the portfolio's crisis behavior.
The Rebalancing Engine: Buying Low Automatically
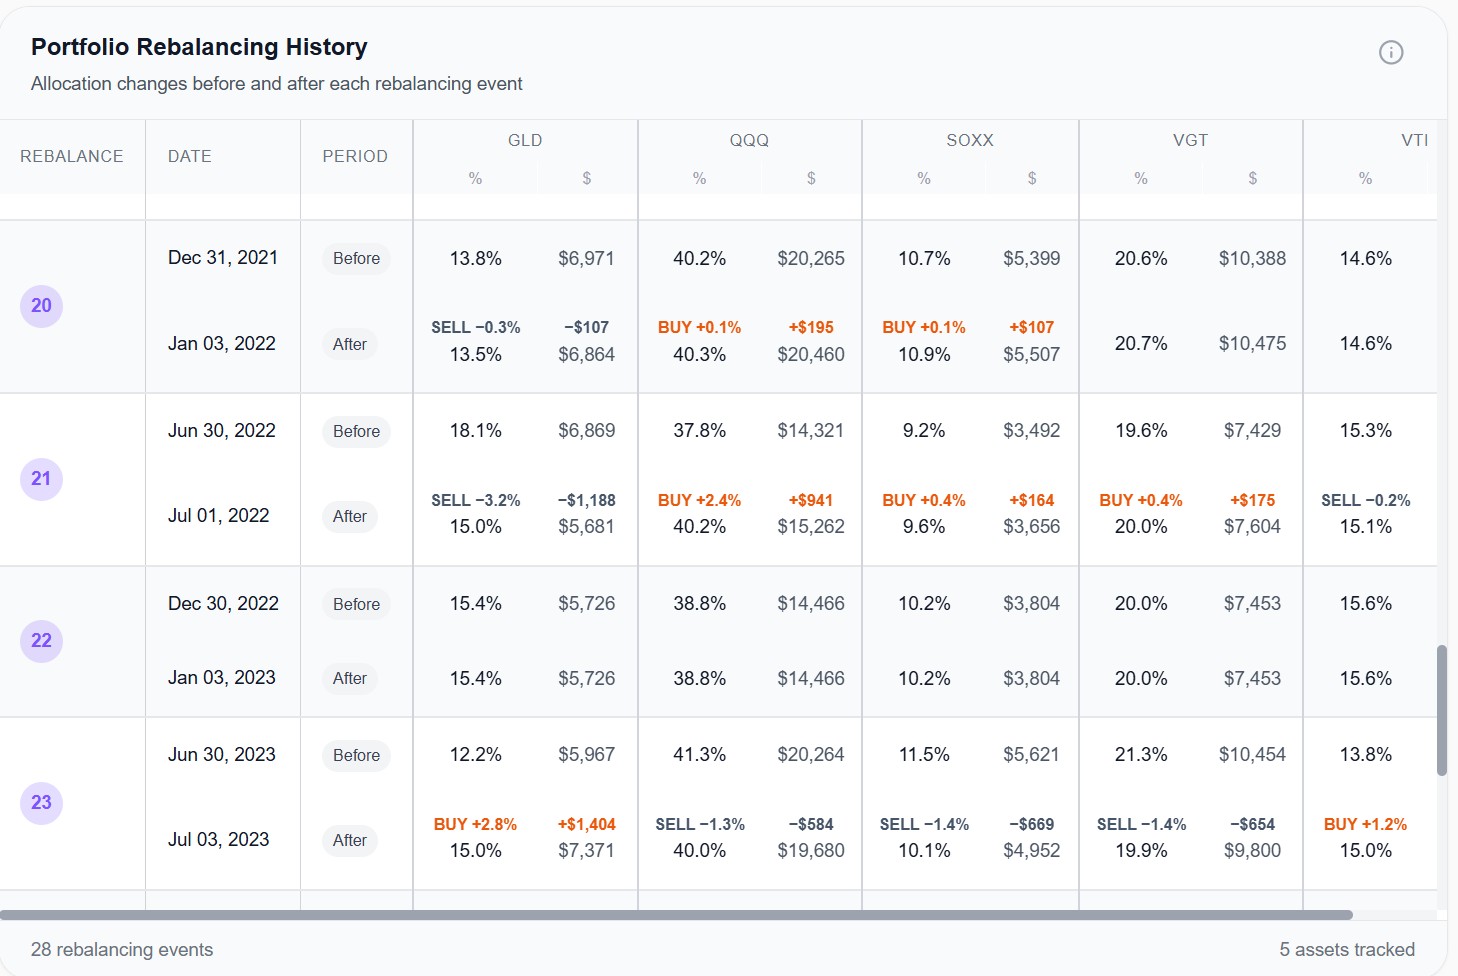
The portfolio uses a Constant Mix strategy with semi-annual rebalancing — 28 rebalancing events over 14 years. This is where the magic of negative correlation meets disciplined execution.
Look at rebalance #21 (July 1, 2022): GLD had drifted from 15% to 18.1% of the portfolio (because gold held up while tech crashed). The rebalancing sold $1,188 worth of GLD and used that cash to buy QQQ (+$941), SOXX (+$164), and VGT (+$175) — all at their crash-level prices.
This is systematic "buy low, sell high" without any emotional decision-making. When tech crashes and gold rises, rebalancing forces you to sell gold (high) and buy tech (low). When tech rockets and gold lags, it does the reverse. Over 28 rebalancing cycles, these small transfers compound into significant return enhancement.
Without rebalancing, you'd still benefit from gold's hedging during crashes — but you wouldn't capture the "rebalancing bonus" of systematically harvesting the divergence between correlated and uncorrelated assets.
Year-by-Year: When the Strategy Struggled
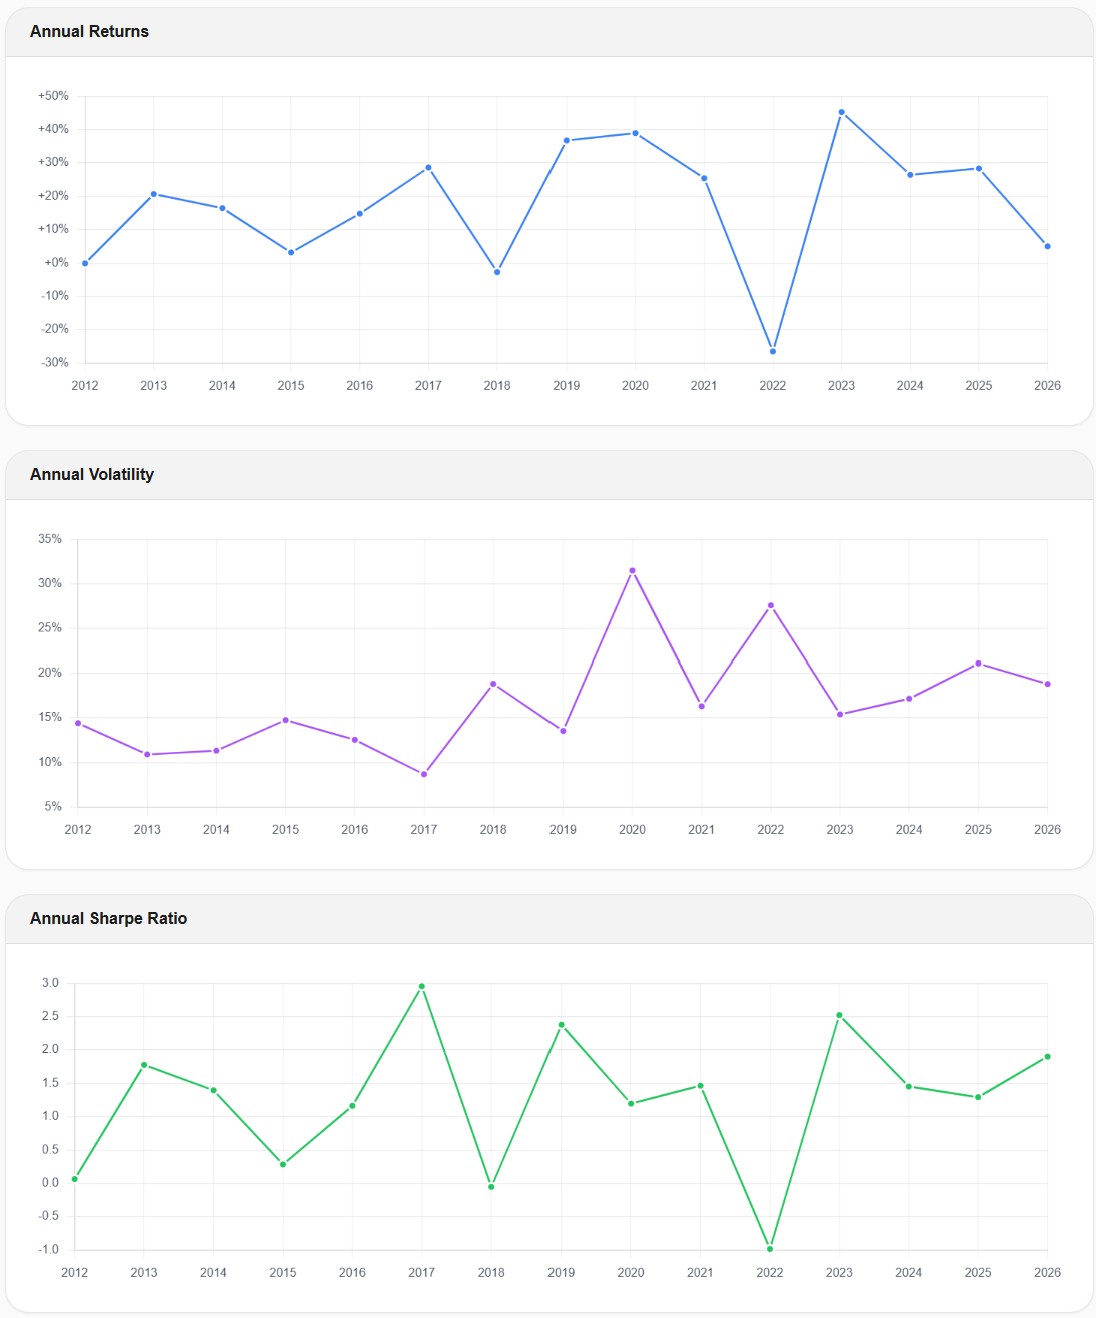
The annual breakdown shows that this strategy doesn't win every year. In 2022, the portfolio posted roughly -28% — painful, though less than what a pure tech portfolio would have suffered. The annual volatility chart shows the March 2020 spike hitting ~31% and the 2022 bear market pushing volatility to ~27%.
But look at the Sharpe ratio chart: even in the worst years, the risk-adjusted return recovered quickly. The 2022 Sharpe ratio dropped to about -1.0 (terrible), but by 2023 it snapped back to ~2.5 (excellent). This resilience — the speed of recovery, not just the depth of the drawdown — is what separates a strategy you can stick with from one you'll abandon.
The best years were 2017 (Sharpe ~2.9), 2019 (~2.3), and 2023 (~2.5). All three were periods where tech led the market and gold either held steady or provided modest returns — the ideal environment for this strategy.
What the AI Analysis Reveals
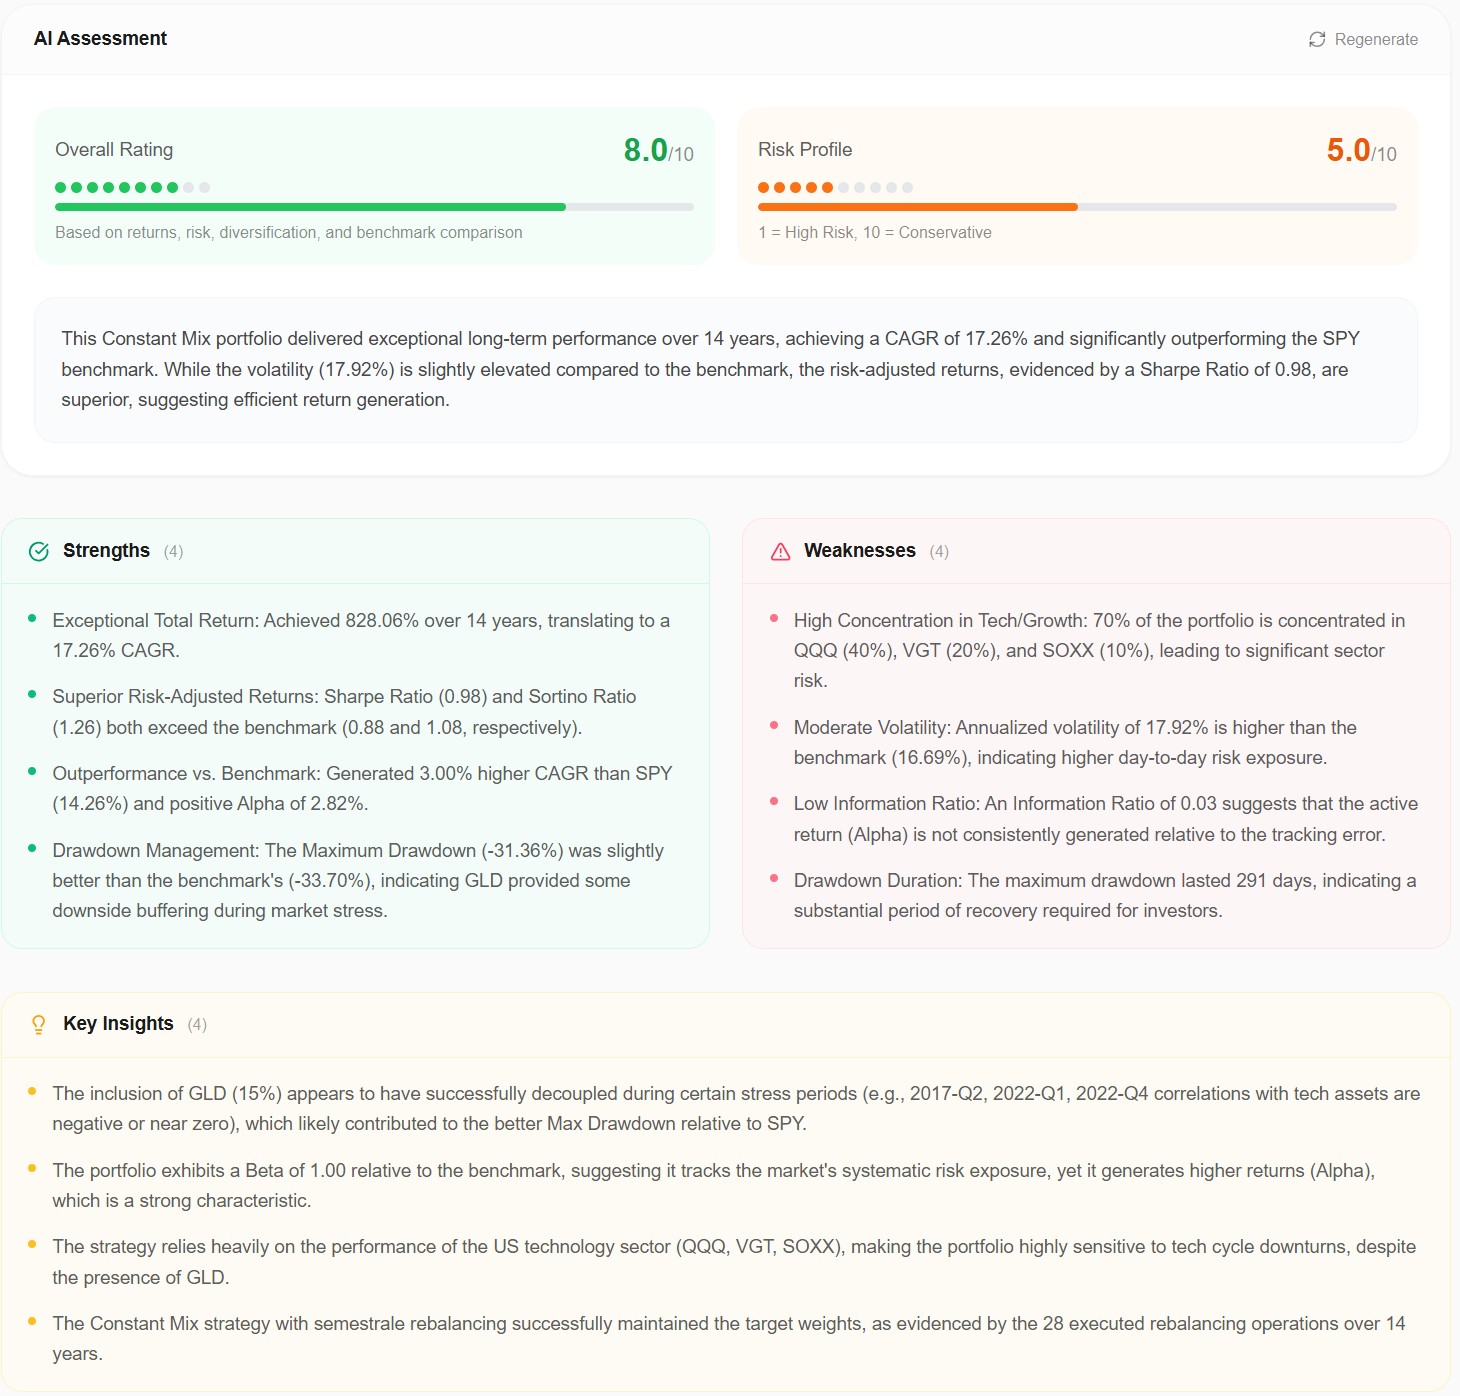
AWALYT's AI-powered portfolio analyzer scored this portfolio 8.0/10 overall with a 5.0/10 risk profile (where 1 = high risk, 10 = conservative). The AI correctly identified the core strengths: exceptional total return, superior risk-adjusted metrics, and GLD's role as a crisis buffer.
But it also flagged critical weaknesses that the raw returns might tempt you to ignore:
Extreme sector concentration. Information Technology accounts for an estimated 34.7% of total portfolio weight. The combination of QQQ, VGT, and SOXX creates significant overlap — NVDA alone has an effective weight of 5.48% across three ETFs.
Geographic concentration. 80% of the portfolio is explicitly tied to the United States. Despite strong historical performance, this creates vulnerability to US-specific economic or regulatory shocks.
Lack of fixed income. Outside the 15% gold allocation, there's no bond exposure. In a prolonged rising-rate environment (like 2022), the portfolio has no traditional income-generating buffer.
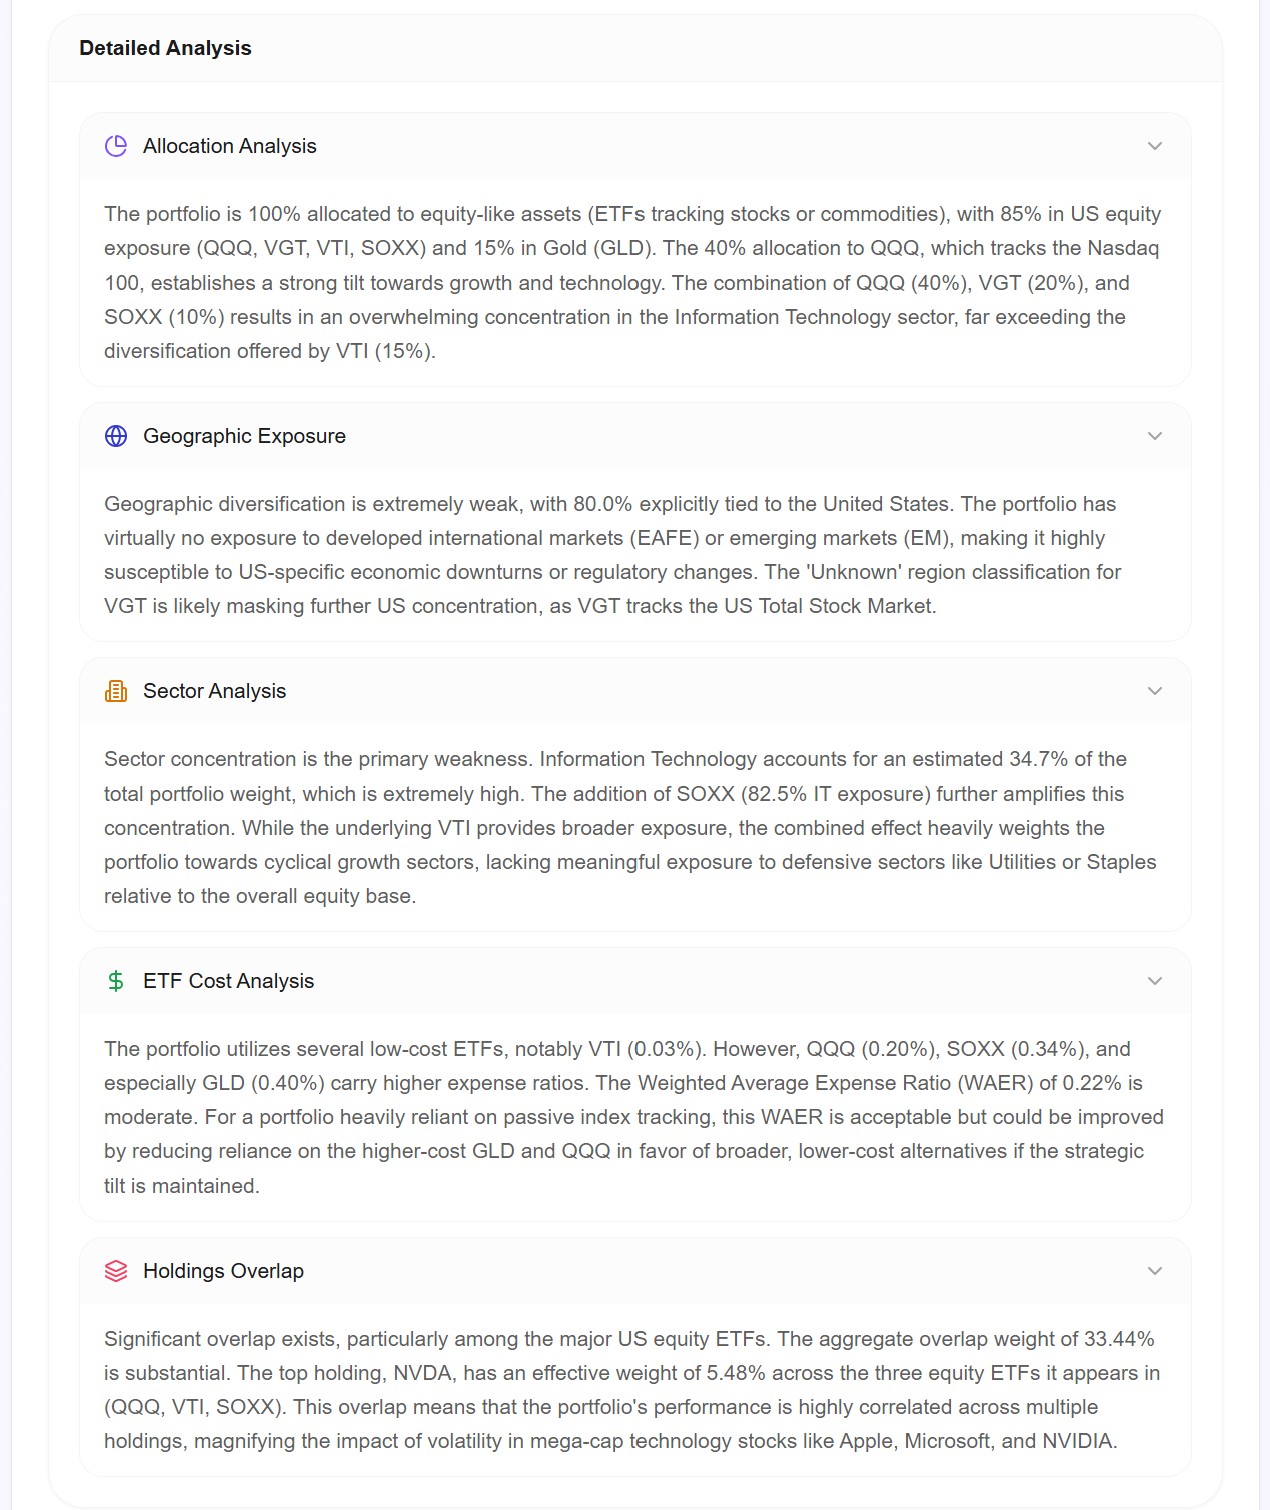
The detailed analysis breaks this down further. The Holdings Overlap section is particularly revealing: aggregate overlap weight across the major equity ETFs is 33.44%, meaning roughly a third of your equity exposure appears in multiple funds. When Apple or Microsoft drops, it hits you from three directions simultaneously.
The AI's suggestions: introduce international exposure, consider reducing the combined weight of tech-focused ETFs, add some fixed income, and evaluate whether holding both VGT and VTI alongside QQQ is redundant. These are the trade-offs you'd want to understand before committing to this strategy.
The Key Takeaway: Correlation Matters More Than Diversification Count
This portfolio holds only 5 ETFs. A typical "diversified" portfolio might hold 8-12. But those 5 ETFs, because of the negative correlation between gold and everything else, provided better drawdown protection than many portfolios with twice as many holdings.
The lesson: the number of assets in your portfolio means nothing. What matters is how those assets relate to each other during a crisis. Four tech ETFs give you zero diversification benefit. One uncorrelated asset (gold) changes the entire risk profile.
If you're building an aggressive growth portfolio, don't just add more equity ETFs and call it diversification. Check the correlation matrix. Find the asset that zigs when everything else zags. For this 14-year period, that asset was gold.
Try It Yourself
This analysis was generated using AWALYT's portfolio backtesting tool with Constant Mix rebalancing on daily market data (3,520 data points over 14 years). The AI portfolio assessment runs on our AI-powered analyzer, which evaluates allocation quality, diversification, cost efficiency, sector exposure, and holdings overlap.
Want to test your own allocation? Swap SOXX for ARKK, try 20% gold instead of 15%, or add bonds to see how it changes the Sharpe ratio.
AWALYT provides analytical tools for educational and informational purposes. Past performance is not indicative of future results. This analysis does not constitute investment advice or a recommendation to buy or sell any security.
Want to test these insights on your own portfolios?
Awalyt is a portfolio analysis platform: backtesting on daily data, fundamental analysis, asset analysis, and AI-powered insights.
Get Started FreeRelated Insights
What Is Portfolio Diversification? (And How to Measure If You Actually Have It) [2026]
13 min read
How Many ETFs Do You Really Need? 12 Years of Data Have the Answer.
9 min read
10 Years of $300/Month DCA: What Happened on VOO, QQQ, AAPL, and 7 Other Popular Assets [2026]
11 min read