How Many ETFs Do You Really Need? 12 Years of Data Have the Answer.
Open any investing forum and the same pattern appears: someone shares their portfolio and it's a list of 12, 15, sometimes 20 ETFs. Their logic is straightforward — more funds must mean more diversification.
But that's not how diversification works. A portfolio with 20 ETFs can be less diversified than one with 6, if those 20 funds all hold the same stocks. And the complexity that comes with a long list of holdings creates real problems that go far beyond theoretical overlap.
We built a simple 6-ETF portfolio, tested it over 12 years with quarterly rebalancing, and the results speak for themselves: 192.89% total return, nearly tripling the initial investment — while beating the benchmark by a wide margin.
Here's the breakdown.
The "More Is Better" Myth
It's a natural instinct. If owning one broad equity ETF is good, adding a tech ETF, a small-cap ETF, a dividend ETF, and a healthcare ETF must be better. Right?
The problem is portfolio overlap. Consider this: if you hold VTI (Total US Stock Market), SPY (S&P 500), and QQQ (Nasdaq 100) — you own three different funds that all have massive exposure to Apple, Microsoft, Nvidia, Amazon, and Meta. They look like separate investments on paper, but underneath they're doing almost the same thing.
This is more common than most people realize. When Awalyt analyzes portfolios with its AI Portfolio Analyzer, it frequently finds that investors who think they're diversified across 10+ funds actually have 80-90% correlation between their core holdings. Ten ETFs, one real bet.
The same applies to international exposure. Holding both VXUS (Total International) and VEA (Developed Markets ex-US) might feel like two distinct positions — but VEA is roughly 80% of what VXUS already holds. You're doubling up on the same stocks without gaining meaningful diversification.
What Real Diversification Actually Looks Like
True diversification isn't about counting how many ETFs you own. It's about combining assets with genuinely different behavior — assets that don't all move in the same direction at the same time.
This means looking at three things: asset class exposure (stocks, bonds, commodities, real estate), geographic spread (US, international developed, emerging markets), and factor diversification (broad market, value, momentum, quality).
The goal is low correlation between holdings. When one part of your portfolio drops, another part either holds steady or moves in the opposite direction. That's what smooths out the ride and actually protects you during downturns.
A portfolio of 15 equity ETFs — even spread across sectors and geographies — is still fundamentally one big equity bet. When stocks sell off, they almost all sell off together. Adding bonds, gold, or real estate introduces genuinely different return drivers, which is where real diversification comes from.
The Hidden Cost of Complexity
Beyond overlap, there's a behavioral problem with bloated portfolios that doesn't show up in any backtest.
Complex portfolios are hard to follow. When you own 15 instruments and some are up, some are down, and you can't quite remember why you added that small-cap value ETF six months ago — you start second-guessing yourself. That second-guessing leads to tinkering. And tinkering almost always means selling low and buying high.
The most damaging investing mistakes aren't analytical — they're emotional. Abandoning a strategy in the middle of a drawdown because you lost confidence in it. That happens far more often with portfolios you don't fully understand.
There's also a practical cost. Rebalancing a 15-ETF portfolio quarterly means evaluating 15 positions, calculating 15 target allocations, and executing multiple trades. It takes time, attention, and discipline. Over years, that friction adds up — and for many investors, it becomes the excuse to stop rebalancing entirely.
A simpler portfolio eliminates these problems. If you understand every position and why it's there, you're far more likely to stick with the plan when markets get rough.
Our 6-ETF Portfolio: "Core Balanced 6"
To prove this point with real data, we built a straightforward 6-ETF portfolio designed to cover the essential building blocks of diversification — and nothing more.
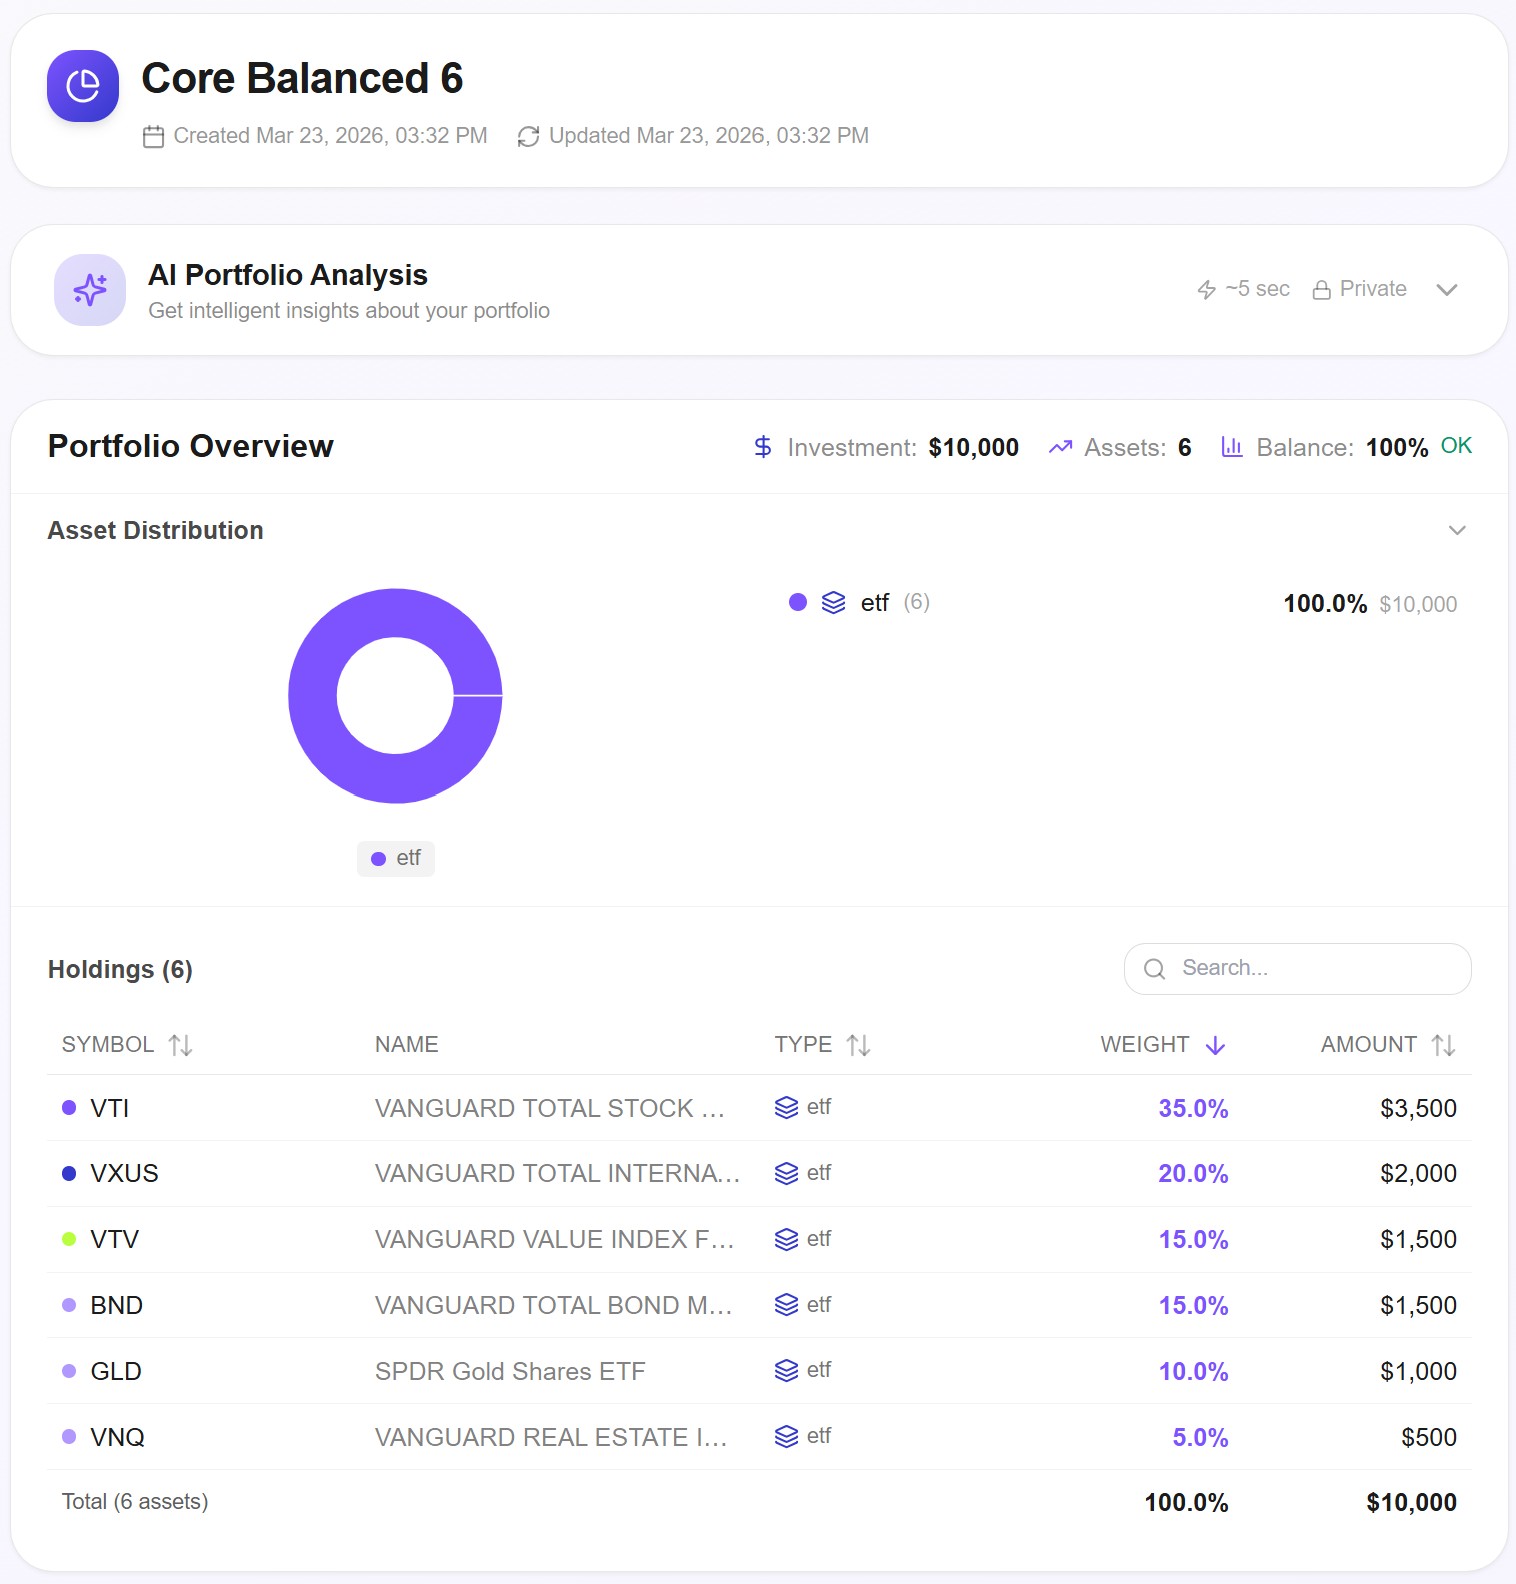
Here's the allocation and the reasoning behind each position:
VTI — Vanguard Total US Stock Market (35%): The foundation. Broad exposure to over 3,500 US companies across all sizes and sectors. One fund, the entire US equity market.
VXUS — Vanguard Total International Stock ETF (20%): Everything outside the US — developed and emerging markets in a single holding. Combined with VTI, you've covered the global equity universe.
VTV — Vanguard Value Index ETF (15%): A deliberate factor tilt toward value stocks. The value premium has been documented extensively in academic research, and adding this alongside VTI gives the portfolio a behavioral edge — value and growth tend to take turns outperforming.
BND — Vanguard Total Bond Market ETF (15%): US investment-grade bonds. This is the ballast during equity selloffs, providing income and reducing overall portfolio volatility.
GLD — SPDR Gold Shares (10%): Gold's value in a portfolio isn't about returns — it's about correlation. Gold behaves differently from both stocks and bonds, especially during periods of inflation or geopolitical uncertainty.
VNQ — Vanguard Real Estate Index Fund (5%): A small allocation to REITs adds exposure to a distinct asset class with its own return drivers — rental income, property values, and interest rate dynamics.
Six instruments. Four distinct asset classes. Global geographic coverage. A factor tilt. That's it.
12 Years of Real Performance Data
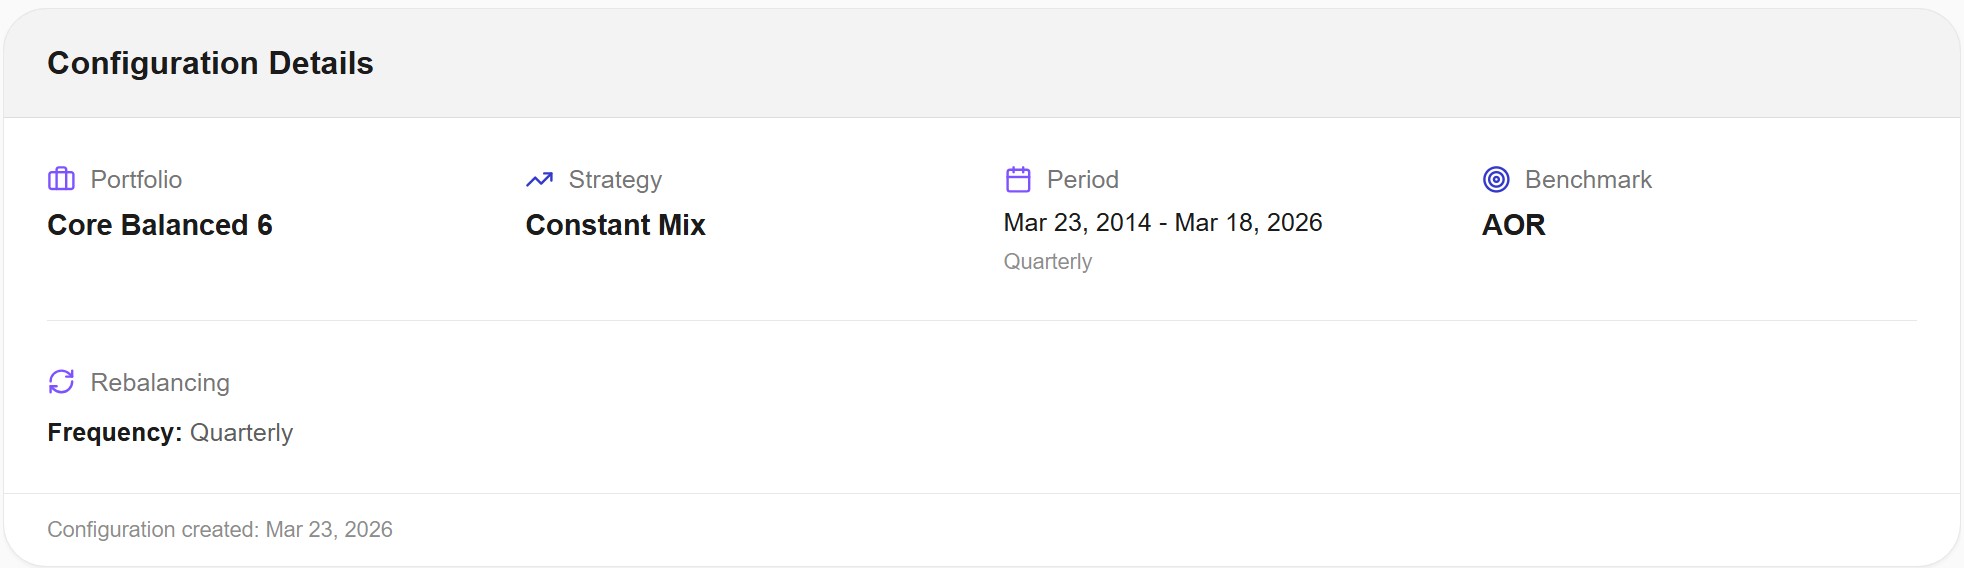
We ran this portfolio on Awalyt from March 2014 to March 2026, with quarterly rebalancing and a constant-mix strategy. Starting investment: $10,000. Benchmark: AOR (iShares Core Growth Allocation ETF) — a 60/40 balanced fund that represents the kind of "set-it-and-forget-it" allocation many investors default to.
Performance Results
The numbers tell a clear story:
| Metric | Core Balanced 6 | AOR (Benchmark) |
|---|---|---|
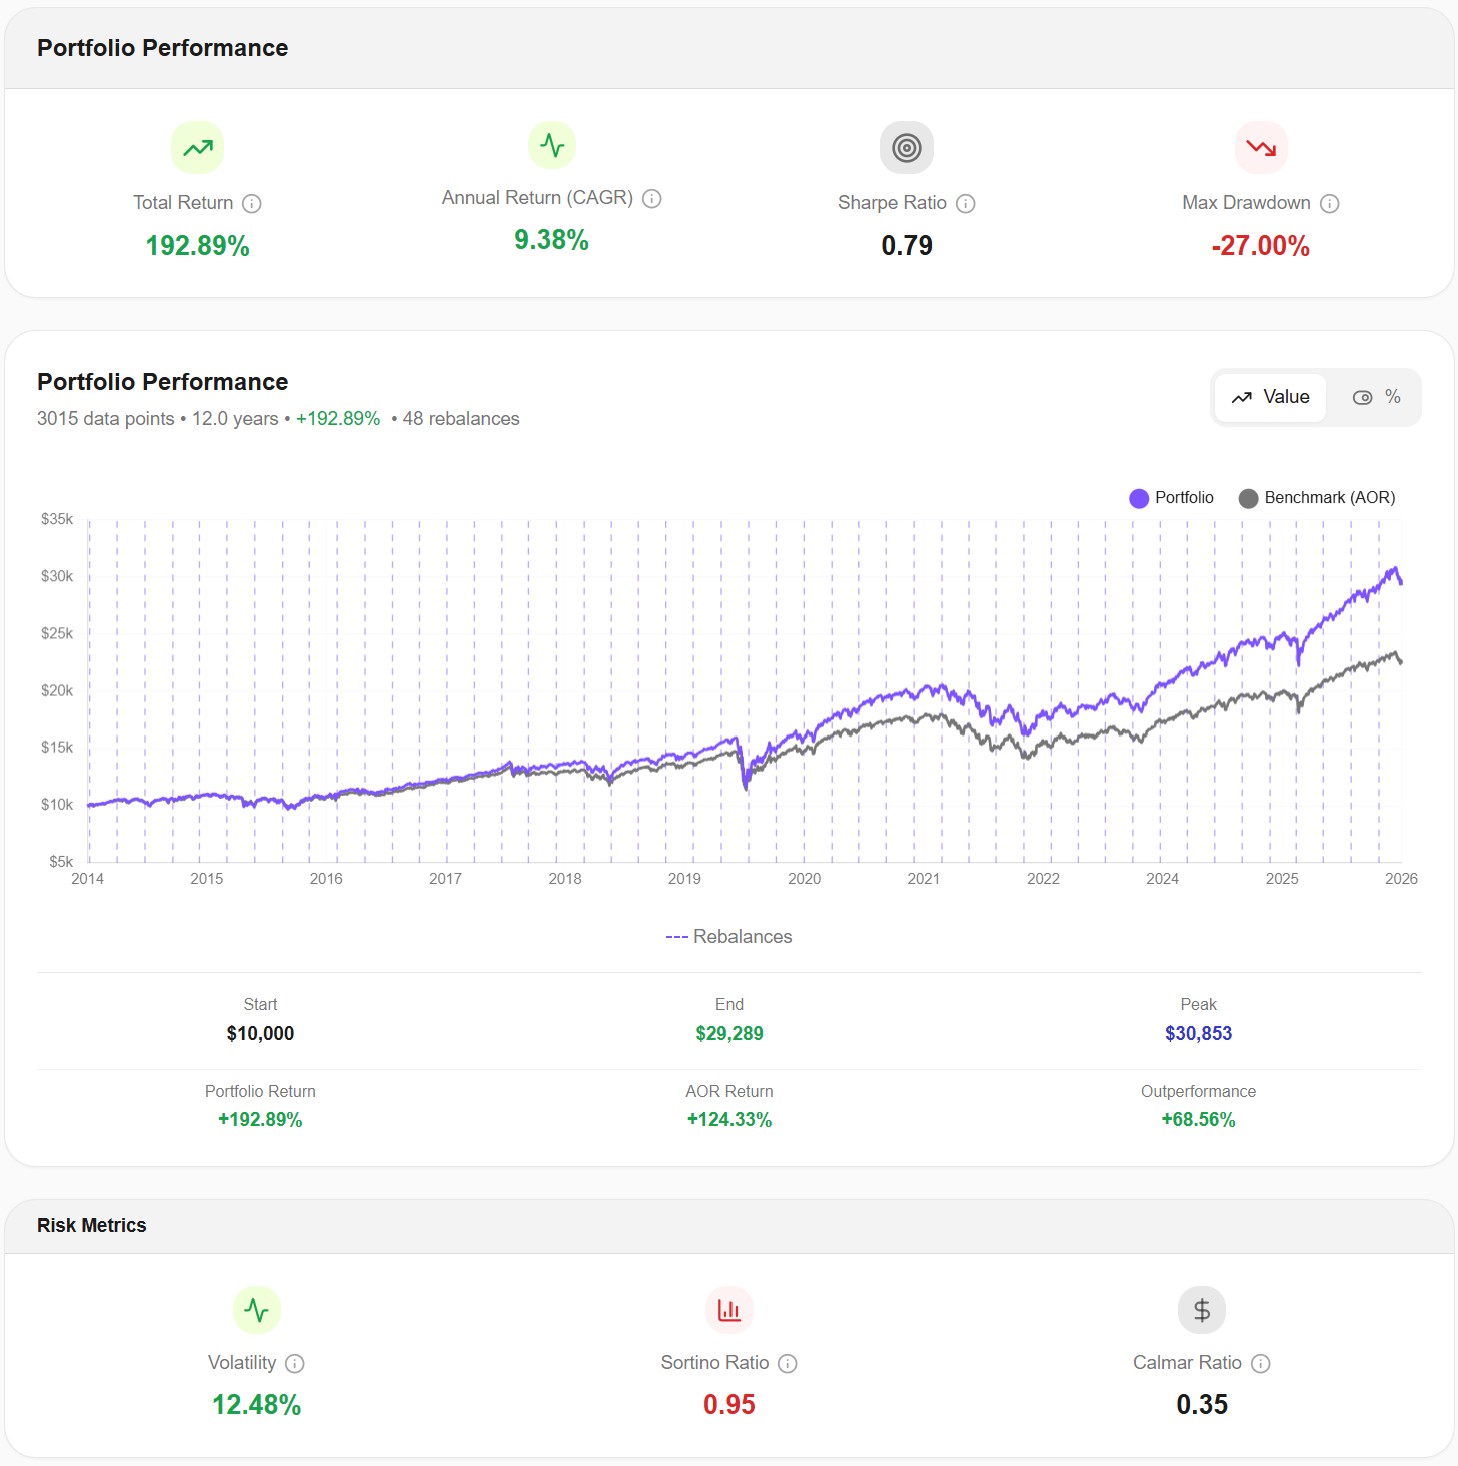
| Total Return | +192.89% | +124.33% |
| Annual Return (CAGR) | 9.38% | 6.97% |
| Sharpe Ratio | 0.79 | 0.71 |
| Max Drawdown | -27.00% | -22.95% |
| Volatility | 12.48% | 10.31% |
| Sortino Ratio | 0.95 | 0.88 |
| Calmar Ratio | 0.35 | — |
The portfolio turned $10,000 into $29,289 over 12 years, reaching a peak of $30,853. That's an outperformance of +68.56 percentage points versus the AOR benchmark — achieved with just six holdings and four rebalances per year.
A 0.79 Sharpe ratio versus AOR's 0.71 means the portfolio was generating better returns per unit of risk — despite taking on more volatility (12.48% vs 10.31%). The Sortino ratio tells an even clearer story: 0.95 vs 0.88, confirming that the extra volatility wasn't translating into worse downside risk relative to the returns earned.
And the max drawdown of -27.00% is significant but survivable. That's the deepest trough over 12 years, which included the COVID crash and the 2022 bear market. For context, AOR maintained a lower drawdown (-22.95%) thanks to its more conservative allocation, yet it returned considerably less — showing that reduced risk alone doesn't guarantee better outcomes.
Year-by-Year Returns
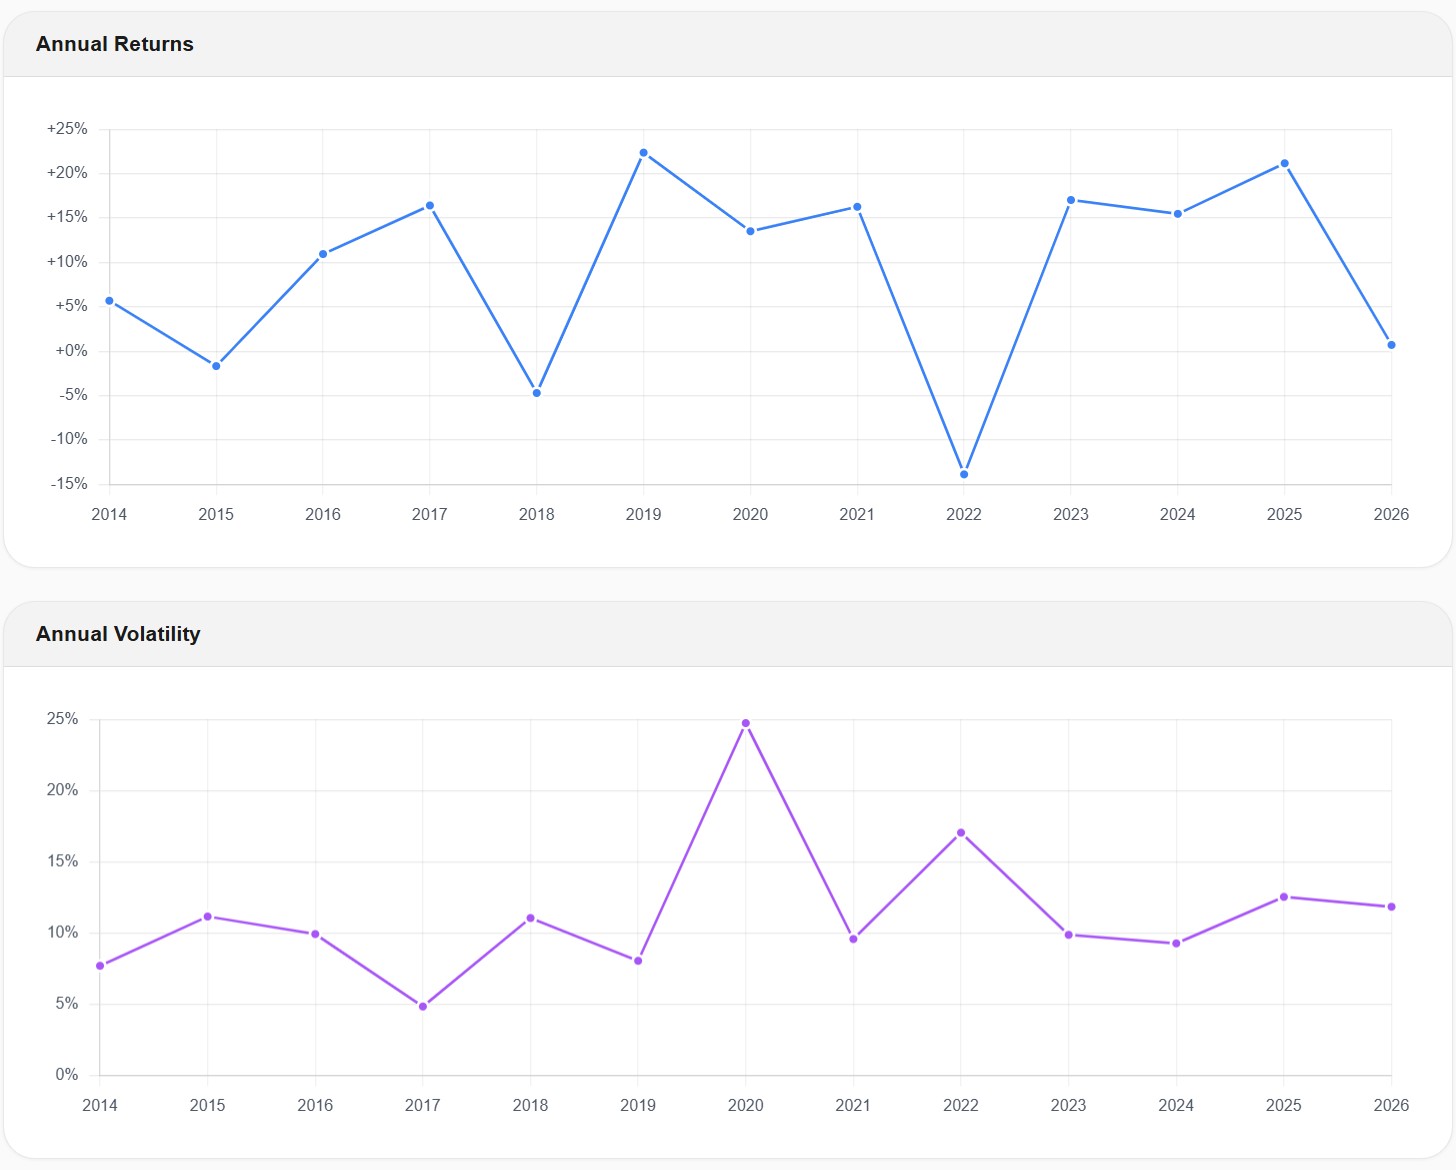
Looking at the year-by-year breakdown, the portfolio posted positive returns in 10 out of 12 full calendar years. The two negative years — 2018 (around -5%) and 2022 (around -14%) — were followed by strong recoveries. The best years (2019 and 2025) both exceeded +20%, while the worst year (2022) was painful but contained.
What stands out in the volatility chart is consistency. Annual volatility stayed in the 5-12% range during most years, with the exception of 2020 (COVID) where it spiked to ~24%. But even that spike came alongside a positive return for the year — the portfolio recovered quickly because the diversification was real.
48 rebalances over 12 years. That's once a quarter — check your portfolio four times a year, make a few trades, and go back to living your life.
The Correlation Proof: Why 6 ETFs Is Enough
This is where it gets interesting. Performance data tells you what happened. A correlation matrix tells you why.
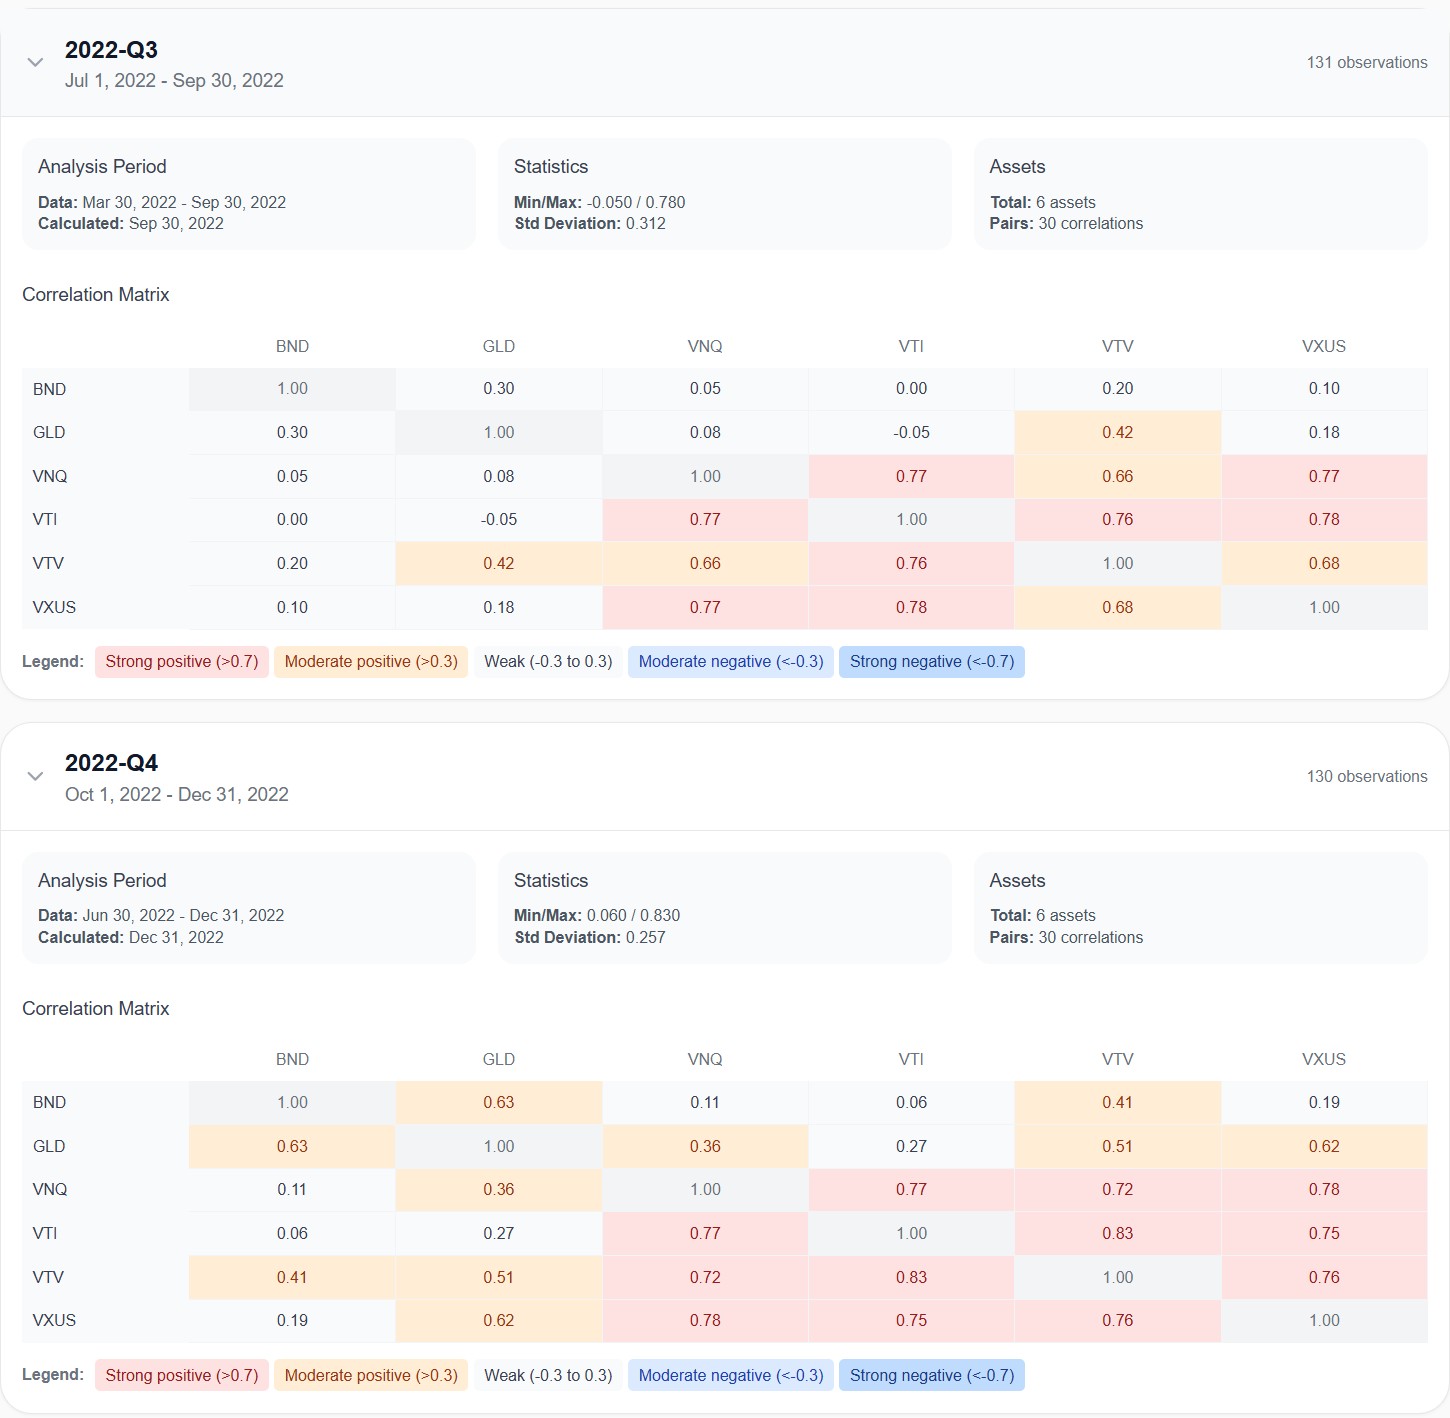
We pulled the correlation data from the 2022 bear market — the exact kind of environment where diversification is tested. Here's what the matrix revealed during Q3 2022:
BND (bonds) vs. VTI (stocks): 0.00 correlation. Zero. Completely independent movement. This is the textbook definition of diversification — two major portfolio components doing entirely different things.
GLD (gold) vs. VTI (stocks): -0.05 correlation. Slightly negative. While US equities were falling, gold was marching to its own beat. This is exactly why gold is in the portfolio — not for returns, but for its behavior under stress.
BND vs. GLD: 0.30 correlation. Moderate — they share some sensitivity to interest rate expectations, but they're far from moving in lockstep.
The equity components (VTI, VTV, VXUS, VNQ) show strong correlations with each other (0.66–0.78), which is expected — stocks tend to move together during selloffs. But that's exactly why the non-equity components matter. When 75% of your portfolio (the equity sleeve) draws down, the remaining 25% (bonds + gold) isn't joining the sell-off.
In Q4 2022, correlations shifted — as they always do. BND-GLD correlation jumped to 0.63, and gold became more correlated with equities (0.27 with VTI, 0.51 with VTV). This is a reminder that correlations are dynamic, not static. But the key insight holds: across both quarters, the portfolio maintained meaningful diversification between its equity and non-equity components.
A portfolio with 15 equity-heavy ETFs wouldn't have this. You'd see correlations of 0.85+ across the board during a drawdown, and the entire portfolio would sink together. Six well-chosen ETFs with genuine structural diversity beat 15 overlapping funds every time.
How Many ETFs Do You Actually Need?
There's no magic number, but the framework is consistent. You want to cover these building blocks:
Core equity — broad market exposure to your primary region (for US investors, VTI or similar). This is the growth engine.
International equity — exposure outside your home market. Reduces single-country risk and captures global opportunities.
A factor tilt — value, momentum, dividend, quality — pick one that resonates with your investing philosophy. This adds a structural behavioral edge over time.
Bonds — the shock absorber. Duration and credit quality matter, but any investment-grade bond exposure adds genuine diversification during equity selloffs.
A non-correlated alternative — gold, commodities, or both. The asset whose correlation to equities stays low or negative during stress.
An optional satellite — real estate, specific sector exposure, or another alternative. Small enough to not dominate, but enough to capture an additional return driver.
That's 5–8 ETFs. Maybe 9 if you want to split your bond allocation between government and TIPS, or add a small commodity fund alongside gold. Beyond that, every additional ETF probably overlaps with something you already own.
The Bottom Line
Our 6-ETF "Core Balanced 6" portfolio returned 192.89% over 12 years with a Sharpe ratio of 0.79 and a manageable -27% max drawdown. It beat the AOR benchmark by 68 percentage points. It required four rebalances per year — less than an hour of work total.
The evidence is clear: you don't need a complex portfolio to be well diversified. You need a thoughtful one.
Six to nine ETFs, covering genuinely distinct asset classes and factor exposures, give you more real diversification than 15 overlapping funds ever will. And because a simpler portfolio is easier to understand, easier to rebalance, and easier to stick with, it has a built-in behavioral advantage that no backtest can fully capture — but that every long-term investor eventually appreciates.
Keep it simple. Test it. Stick with it. That's where the real edge is.
FAQ
How many ETFs do I need for a diversified portfolio?
Between 6 and 9 ETFs is the sweet spot for most investors. The key is covering genuinely distinct asset classes — US equities, international equities, bonds, and at least one non-correlated alternative like gold. Our 6-ETF portfolio achieved excellent diversification and risk-adjusted returns over 12 years with just four asset classes.
How many ETFs is too many?
Beyond 8–10 well-chosen ETFs, each additional fund typically overlaps heavily with what you already own. If two ETFs in your portfolio have a correlation above 0.85, one of them is probably redundant. Use a correlation matrix to check — you might be surprised how many of your "diversifying" funds are actually doing the same thing.
Is 6 ETFs really enough for diversification?
Yes — if those 6 ETFs cover distinct asset classes. The Core Balanced 6 portfolio holds US equities, international equities, value-tilted equities, bonds, gold, and real estate. That's four different asset classes with genuinely low correlations. Diversification comes from different behavior, not different ticker symbols.
What about sector-specific ETFs?
Unless you have a strong conviction and the knowledge to back it, sector ETFs add complexity without proportional diversification. VTI already holds every US sector. Adding a technology or healthcare ETF increases concentration in that sector, which is the opposite of diversifying.
How often should I rebalance a simple portfolio?
Quarterly works well for most investors. It's frequent enough to capture the benefit of selling high and buying low across asset classes, but infrequent enough that you're not constantly making trades. Our test used quarterly rebalancing and required just 48 rebalancing events over 12 years.
Why AOR as a benchmark instead of the S&P 500?
AOR (iShares Core Growth Allocation) is a balanced 60/40-style fund — a realistic alternative for the type of investor considering a diversified multi-asset portfolio. Comparing against the S&P 500 would be comparing a balanced portfolio against a pure equity index, which isn't a fair test. The goal here isn't to beat the S&P 500 — it's to show that a simple, well-structured portfolio delivers excellent risk-adjusted results.
Can I just buy AOR instead of building my own portfolio?
You can — but you give up control over the specific allocation, the factor tilts, and the rebalancing frequency. AOR returned 124.33% over the same period versus 192.89% for our custom portfolio. The customization matters.
This analysis was performed using Awalyt's backtesting platform with daily data precision — providing more accurate drawdown and volatility measurements than tools that rely on monthly data points. All portfolios were rebalanced quarterly using constant-mix strategy. Past performance does not guarantee future results.
Want to test your own simple portfolio? Build it, test it, and see the correlation data for yourself.
Want to test these insights on your own portfolios?
Awalyt is a portfolio analysis platform: backtesting on daily data, fundamental analysis, asset analysis, and AI-powered insights.
Get Started FreeRelated Insights
Does Gold Improve Portfolio Returns? [Backtest]
10 min read
How 15% Gold Turned an Aggressive Tech Portfolio into a Market-Beating Strategy
11 min read
Is VOO + QQQ + SCHD + VWO + VXUS Diversified? [2026]
10 min read