How to Build a Core ETF Portfolio: A 5-Step Framework
Key Takeaways
- Building a portfolio without knowing your risk profile is the #1 reason investors panic-sell during crashes
- A curated ETF shortlist across sectors, geographies, and asset classes gives you real options — not random picks
- Analyzing performance, volatility, and correlation before buying separates strategy from guesswork
- Backtesting multiple allocations through real market crashes reveals which strategies actually survive
- The most underrated step: sticking with your strategy through downturns — discipline compounds just like returns
Why Most Portfolios Fail Before They Start
I talk to DIY investors every week, and I keep seeing the same pattern. Someone picks 4-5 ETFs they heard about on Reddit or YouTube, throws them into a brokerage account with rough percentage splits, and calls it a portfolio.
Then the market drops 15%, and they sell everything.
The problem isn't the ETFs. It's that they never asked the one question that actually matters before buying anything: what's your risk profile?
Without answering that first, every allocation is a guess. A 100% equities portfolio is perfect for someone with a 30-year horizon and iron nerves. It's a disaster for someone five years from retirement who checks their account daily.
I built this framework because I was tired of seeing the same mistakes. Five steps — nothing fancy, no complex math — just a structured way to build a portfolio you actually understand and can stick with when things get rough.
Step 1: Define Your Real Risk Profile
Before you open a single ETF screener, I need you to answer one question honestly: if your portfolio dropped 20% tomorrow, what would you do?
Not what you think you'd do. What you'd actually do at 6 AM, staring at a sea of red on your phone. Be brutally honest here — this answer shapes everything.
Most guides treat risk tolerance as a quiz with a score. That's too simple. There are actually two dimensions, and confusing them is where people get hurt:
Risk tolerance is psychological. It's how much volatility you can stomach without making emotional decisions. Some investors can watch a 30% drawdown and go about their day. Others start losing sleep at -10%.
Risk capacity is financial. It's how much loss your situation can absorb. A 25-year-old with a stable income and no dependents has enormous risk capacity. A 55-year-old planning to retire in five years does not — regardless of how "brave" they feel.
Your portfolio allocation should reflect the lower of these two. If your risk capacity says you can handle 80% equities but your tolerance says you'll panic at -15%, target something closer to 60/40. A portfolio you can stick with through a crash will always outperform one you abandon halfway through.
Practical approach: Look at major historical drawdowns — the 2008 financial crisis (-50%), the 2020 COVID crash (-34%), the 2022 bear market (-25%). Honestly assess at which point you would have sold. That number is your real risk boundary.
Step 2: Build Your ETF Shortlist
Once you know your risk boundaries, it's time to build a universe of ETFs to choose from. And here's where I see the second most common mistake: people start with 3-4 ETFs they already know (usually SPY, QQQ, and maybe VTI) and stop there.
The key word is universe — you're not picking your final portfolio yet. You're creating options. The broader your shortlist, the better your final selection will be.
A solid shortlist should cover three dimensions of diversification:
By sector: Technology, healthcare, financials, energy, consumer staples, industrials. Different sectors respond differently to economic cycles. Tech thrives in growth phases; consumer staples hold up during recessions.
By geography: US, international developed (Europe, Japan, Australia), and emerging markets (China, India, Brazil). The US has dominated the last decade, but markets are cyclical. International diversification protects against single-country risk.
By asset class: Equities (stocks), fixed income (bonds), commodities (gold, broad commodities), and real estate (REITs). These asset classes have different return profiles and, critically, different correlations with each other.
A well-constructed shortlist might include 30-50 ETFs spanning all three dimensions. This sounds like a lot, but you're building a menu — you'll only pick 4-7 for your final portfolio.
Resource: We maintain a curated shortlist of 50+ ETFs with pre-calculated performance metrics, risk ratios, and correlation data at awalyt.com/etf-analysis. It's designed to save you the hours of screening work.
The point of this step is options. If your shortlist only contains US large-cap growth ETFs, your "diversified" portfolio won't actually be diversified. Cast a wide net first, then narrow down with data.
Step 3: Analyze What Actually Matters
This is where most DIY investors either skip ahead or get lost in the wrong metrics. You don't need to analyze 47 data points per ETF. Focus on the three that actually drive portfolio outcomes.
Performance
Total return matters, but it's only half the story. Compare annualized returns over meaningful periods — at least 5 years, ideally 10+. Short-term performance is noise; long-term performance reveals the actual growth trajectory.
Look at this comparison across seven ETFs spanning different asset classes and geographies:
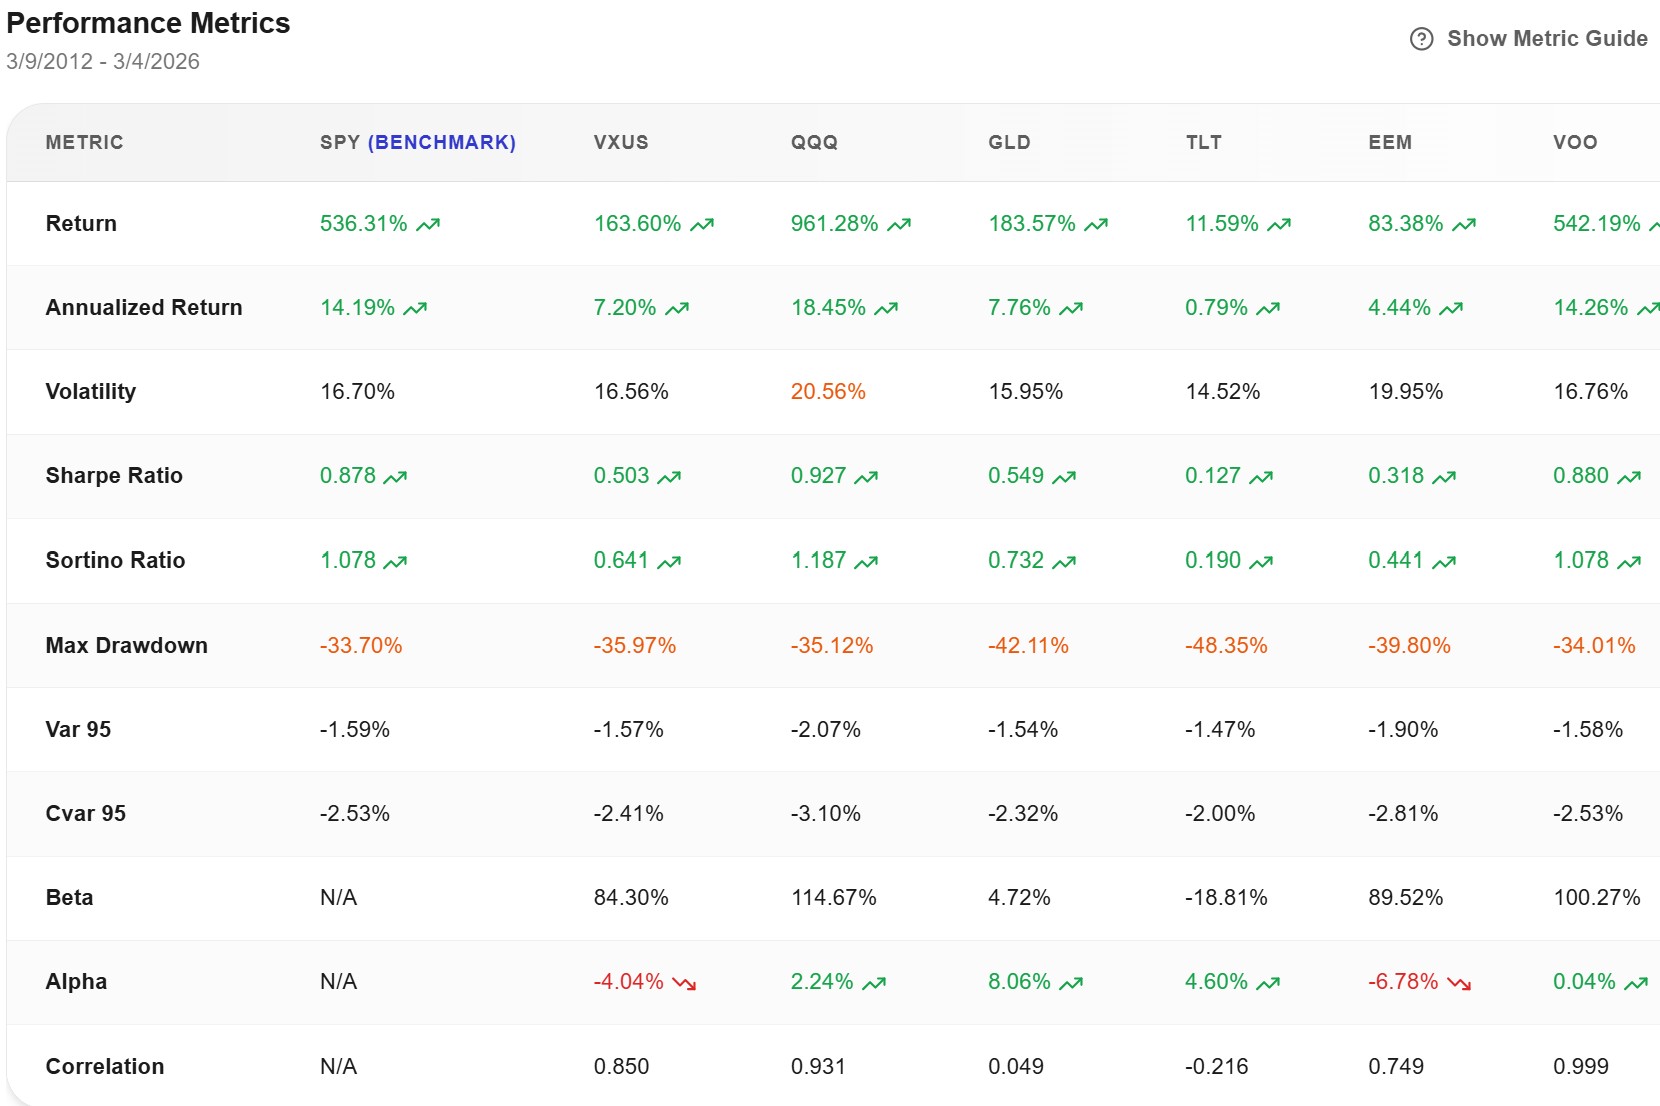
QQQ delivered 961% total return versus GLD's 183%. But look at the Max Drawdown column: QQQ dropped -35%, while GLD's worst was -42%. And TLT (long-term bonds) returned only 11% total — but its -48% drawdown shows bonds can crash too.
The takeaway: high returns always come with a cost. The question is whether that cost fits your risk profile from Step 1.
Volatility
Volatility measures how much an ETF's price swings day-to-day. Higher volatility means larger ups and larger downs.
In the table above, QQQ's volatility is 20.56% versus VTI's 16.70%. That 4-percentage-point gap translates to significantly wilder daily swings. For an investor who checks their portfolio frequently, high-volatility holdings create more temptation to make emotional decisions.
The Sharpe Ratio — which divides return by volatility — tells you how much return you're getting per unit of risk. QQQ's 0.927 Sharpe is outstanding. TLT's 0.127 means you're getting almost nothing for the risk you're taking.
Correlation
This is the metric that changed how I think about portfolio construction. Most investors completely ignore it — and it's honestly more important than return or volatility.
Correlation measures how two assets move relative to each other. A correlation of +1.0 means they move in perfect lockstep. A correlation of -1.0 means they move in opposite directions. A correlation near 0 means they're independent.
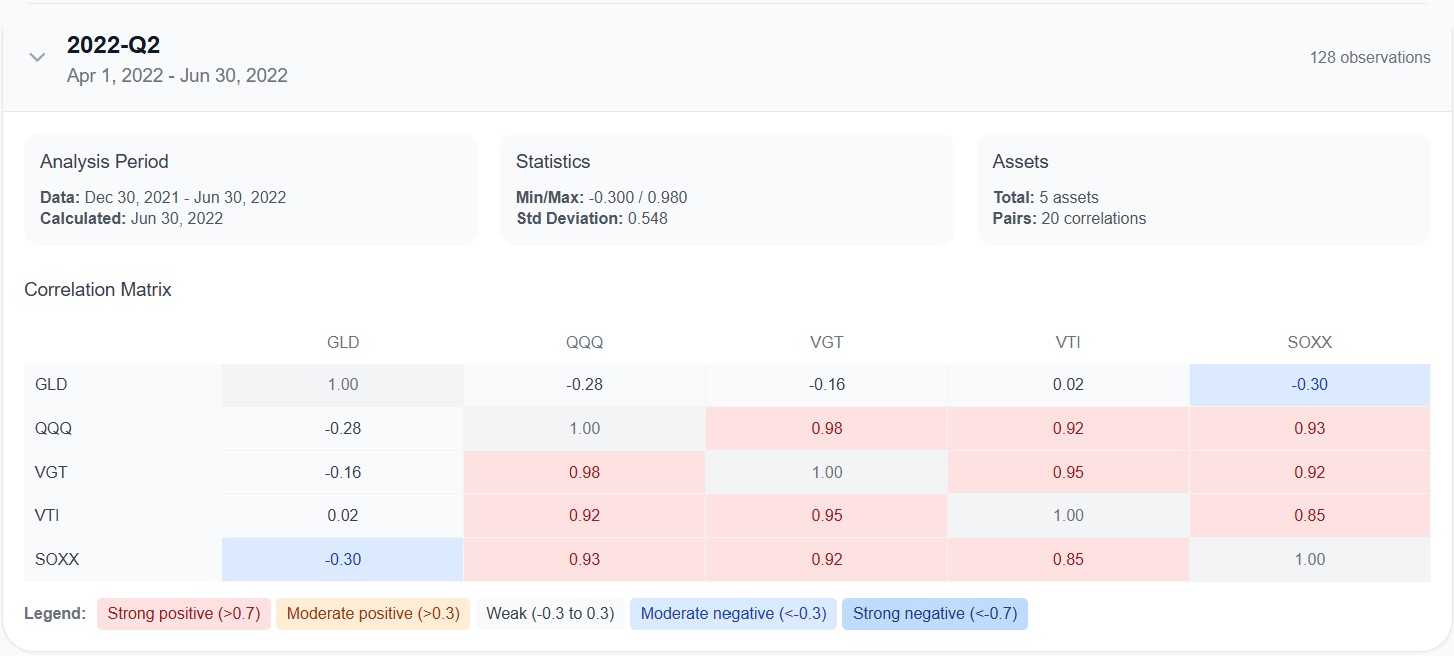
Look at this correlation matrix from Q2 2022 — right in the middle of the bear market. GLD (gold) has correlations of -0.28 with QQQ and -0.30 with SOXX. When tech stocks were falling, gold moved the other way. That's what actual diversification looks like.
Now look at QQQ, VGT, and SOXX. Correlations between 0.92 and 0.98. I see this all the time — someone holds all three thinking they're diversified because they have three different tickers. In reality, these funds move almost identically. You're paying three sets of fees for essentially the same bet.
The rule: if two ETFs in your portfolio have a correlation above 0.85, you're paying extra fees for essentially the same exposure. Replace one with something that actually diversifies.
Step 4: Backtest Multiple Allocations
You've identified your risk profile, built a shortlist, and analyzed individual ETFs. Now comes my favorite part — and honestly, the reason I built Awalyt: testing your actual portfolio allocation against real historical data.
Backtesting means simulating how a specific portfolio — with your exact ETF choices and percentage weights — would have performed over a historical period. Not individual ETFs in isolation. The combination of them, including rebalancing.
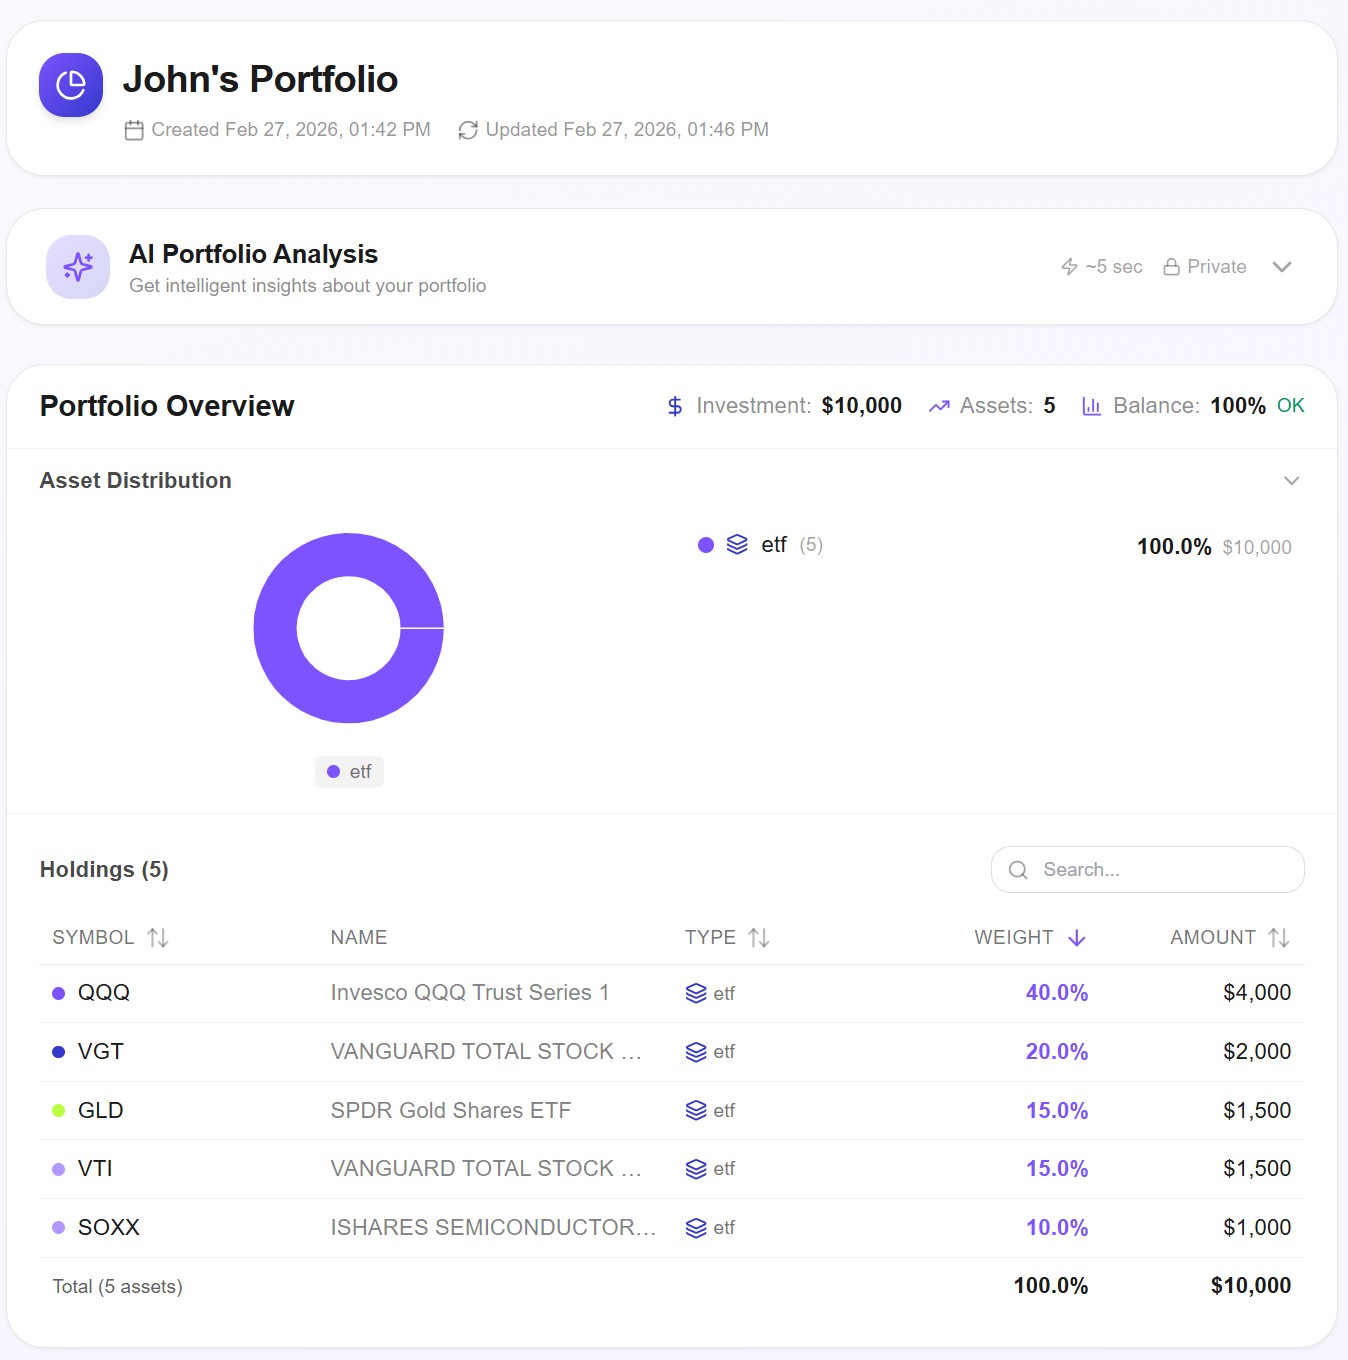
Set Up Your Portfolio
Choose 4-7 ETFs from your analyzed shortlist and assign percentage weights that reflect your risk profile. A growth-oriented investor might go heavy on equities with a small gold allocation. A conservative investor might split more evenly between stocks and bonds.
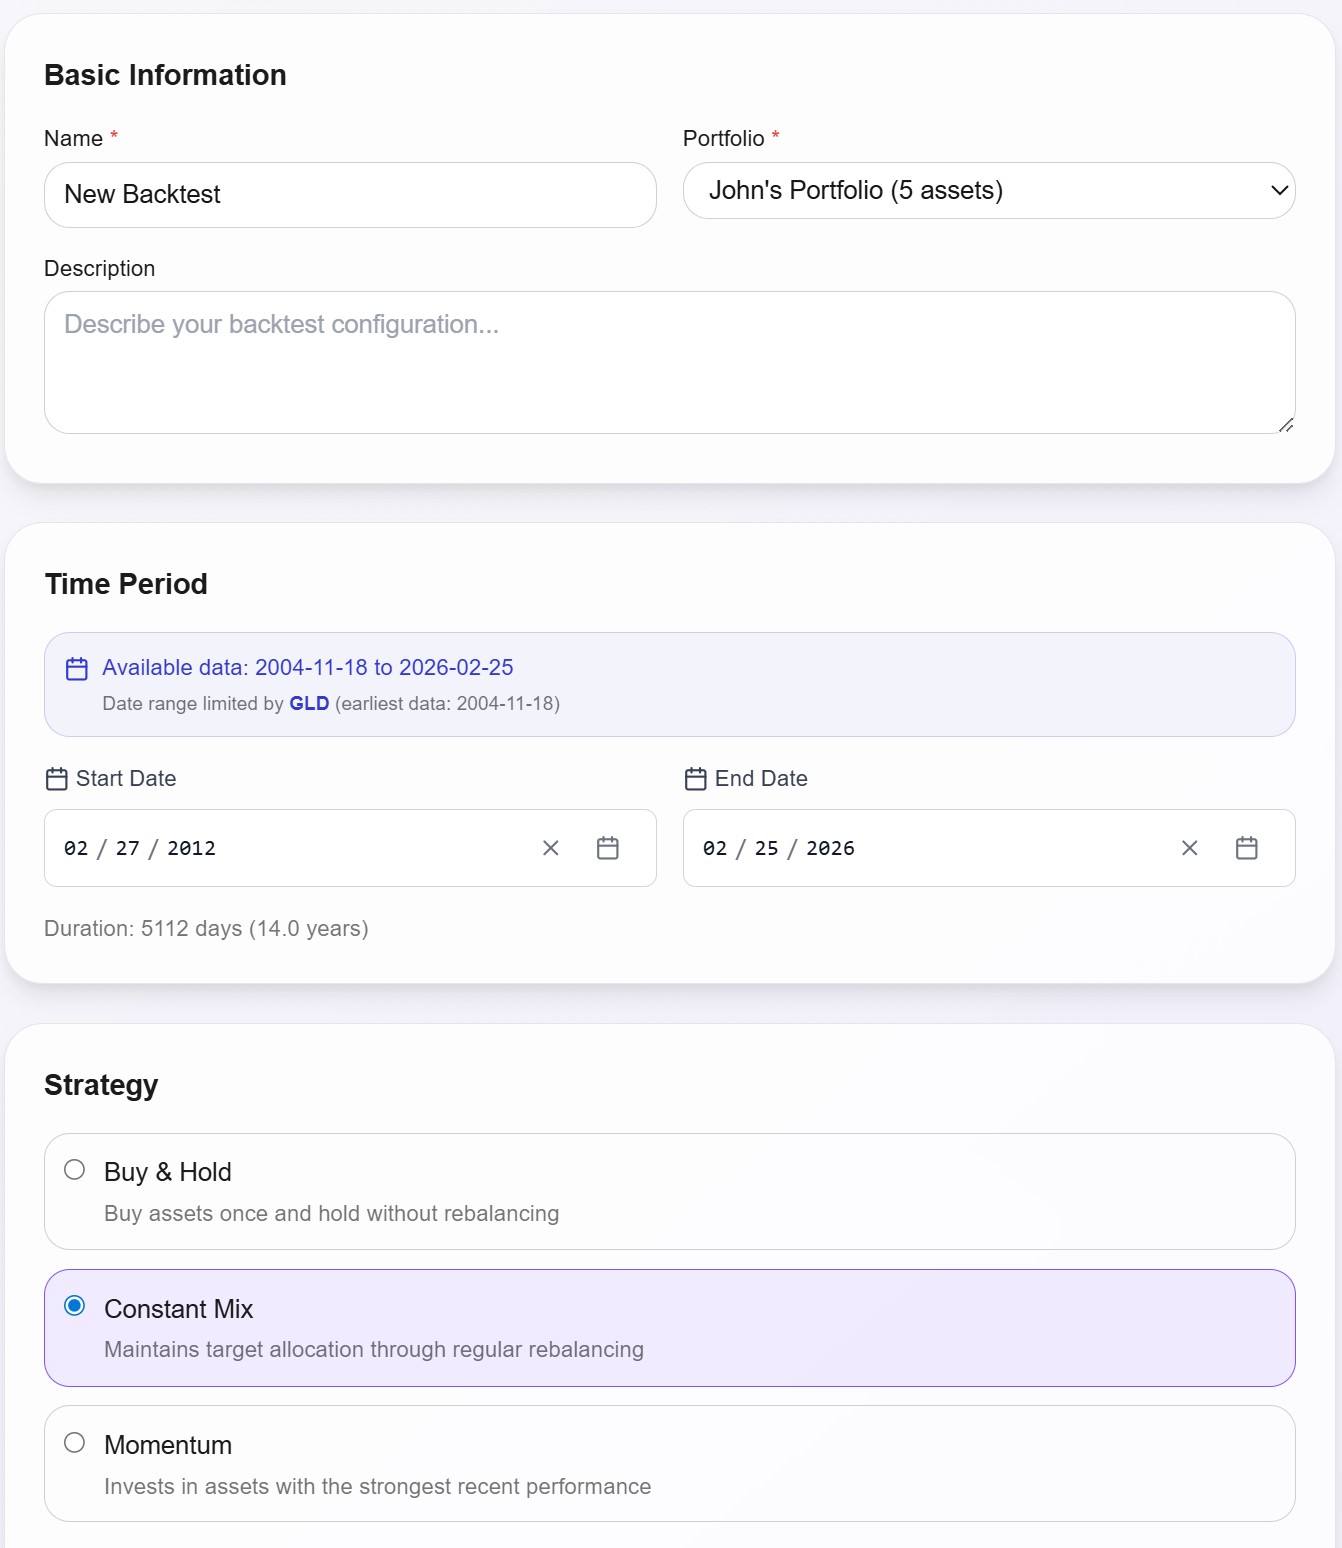
Configure Your Backtest
Select your time period (longer is better — aim for at least 10 years to capture both bull and bear markets), choose a rebalancing strategy (constant mix with semi-annual rebalancing is a solid default), and set a benchmark to compare against.
Read the Results — Beyond Total Return
Here's where the real insights live. Don't just look at the final number.
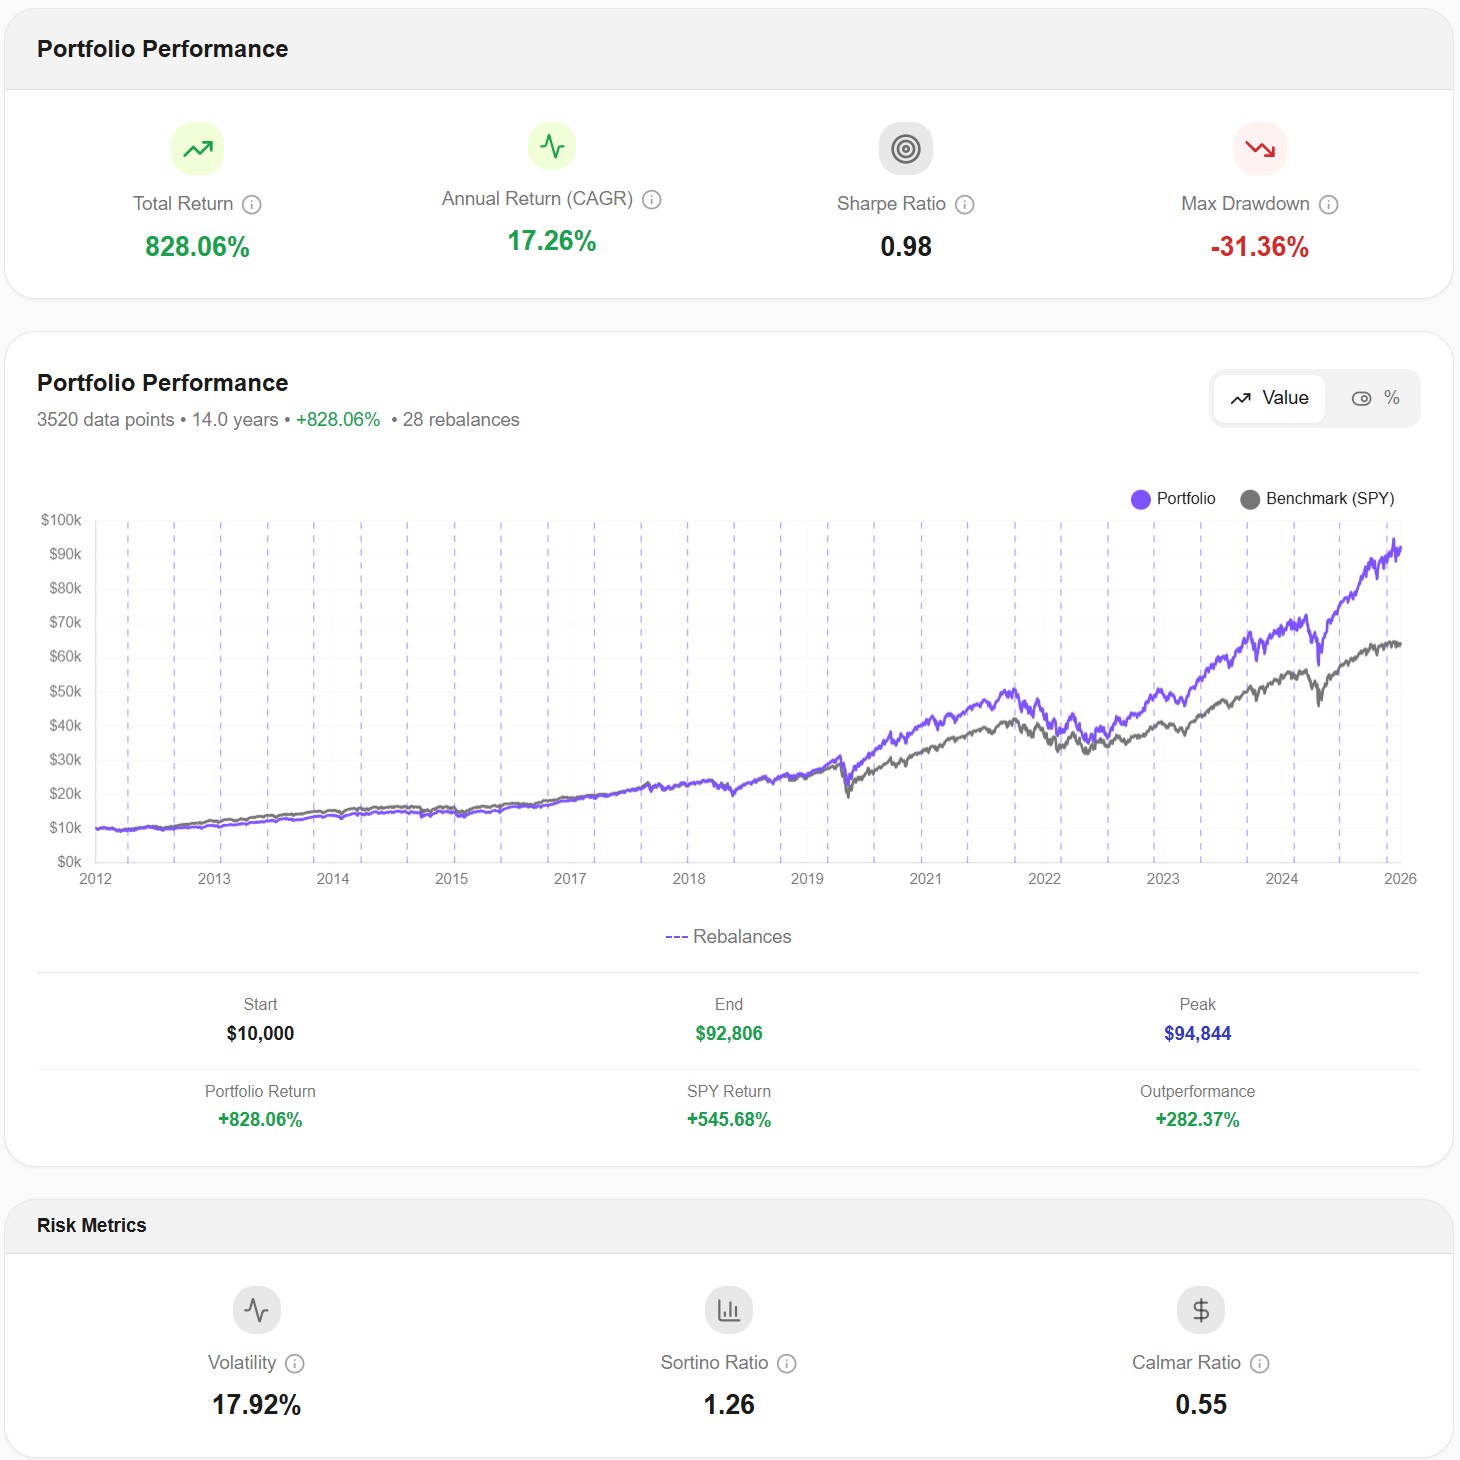
This example portfolio returned +828% over 14 years, with a 17.26% CAGR and a Sharpe Ratio of 0.98. It outperformed the S&P 500 benchmark by +282%.
But here's what most people skip: the Max Drawdown is -31.36%. That means at some point during those 14 years, this portfolio lost nearly a third of its value from peak to trough. In real money: $100,000 became $68,640. And it didn't bounce back the next day — drawdowns can last months.
Go back to Step 1. Could you sit through that without selling? If yes, this allocation works. If your honest answer is "I'm not sure," that's not a weakness — it means you need more bonds, more gold, or both. Adjust the weights and run it again. That's exactly what backtesting is for.
Stress-Test Through Crashes
The most valuable part of backtesting isn't the total return — it's seeing exactly how your portfolio behaved during the worst periods. How deep was the drawdown during the 2020 COVID crash? How long did recovery take after the 2022 bear market? Did your rebalancing strategy actually help, or did it just churn?
Run at least 2-3 different allocations and compare them. Shift 10% from equities to bonds. Add gold. Remove a redundant ETF. Each variation tells you something about the risk-return tradeoff you're making.
The goal isn't to find the "perfect" portfolio — it doesn't exist. The goal is to find the allocation you understand well enough to trust when markets get ugly.
Step 5: Stick With Your Strategy
I debated whether to even include this step, because everyone already "knows" it. Buy and hold. Stay the course. Don't panic.
And yet almost nobody actually does it.
You've done the hard work. You've defined your risk profile, analyzed correlations, backtested through real crashes. You've built a portfolio grounded in data, not Reddit threads or YouTube thumbnails.
Then the market drops 15% in two weeks. Your coworkers are talking about selling. Financial news is screaming. Every instinct says: get out now, buy back lower.
Don't.
The data is overwhelmingly clear on this: investors who stay invested through downturns vastly outperform those who try to time the exit and re-entry. Market crashes have happened in 2000, 2008, 2011, 2015, 2018, 2020, and 2022. Each time, the recovery eventually came — and each time, the investors who panicked and sold locked in their losses permanently.
This isn't about blind optimism. It's about trusting the process you built in Steps 1 through 4. You analyzed the data. You stress-tested through crashes. You know what your drawdown looks like because you already simulated it.
Here's the discipline framework that works:
Set rebalancing dates in advance. Semi-annual or quarterly. When the date comes, rebalance back to your target allocation regardless of market conditions. This automatically forces you to sell high and buy low.
Don't check your portfolio daily. Seriously. If you built a long-term strategy, checking it every day only creates anxiety. Monthly or quarterly reviews are more than enough.
Remember why you backtested. When your portfolio is down 20%, pull up your backtest results. You already know this scenario. You already saw how the portfolio recovered. The data didn't change — only your emotions did.
The investors who build wealth over decades aren't the ones with the cleverest stock picks. They're the ones who picked a reasonable strategy and refused to abandon it.
Putting It All Together
Look — building a core ETF portfolio isn't rocket science. But it does require doing the boring work that most people skip:
- Know your risk profile — honestly, not aspirationally
- Build a broad ETF shortlist across sectors, geographies, and asset classes
- Analyze performance, volatility, and correlation — especially correlation
- Backtest multiple allocations and stress-test through real market crashes
- Stick with your strategy through the inevitable downturns
Most investors skip Steps 3 and 4 entirely and jump straight from "I heard about this ETF" to buying it. Then they skip Step 5 when the market drops.
This framework won't give you the highest possible returns. Nothing will, and anyone who promises that is selling something. But it will give you a portfolio you understand — and in my experience, understanding is the single biggest factor that keeps investors from making expensive emotional mistakes.
If you found this useful, let me know which step you struggle with the most. I read every comment.
All backtest data shown in this article was generated using Awalyt's daily-granularity backtesting engine. Past performance does not guarantee future results. This content is educational and does not constitute financial advice.
Want to test these insights on your own portfolios?
Awalyt is launching soon — portfolio backtesting with daily data precision, fundamentals analysis, and AI-powered insights.
Join the WaitlistRelated Insights
Core + Satellite Portfolio Strategy: How to Build a Portfolio That Grows AND Protects Your Money [2026]
10 min read
Backtesting a Portfolio: 6 Common Mistakes and How to Avoid Them [2026]
11 min read
How to Use Historical P/E to Tell If a Stock Is Cheap or Expensive [2026]
10 min read