How to Use Historical P/E to Tell If a Stock Is Cheap or Expensive [2026]
Open any financial website, look up a stock, and you'll see a P/E ratio. Apple: 31.45. Microsoft: 34. Amazon: 58. But what does that number actually tell you?
Most investors treat the P/E ratio as a single verdict: high means expensive, low means cheap. That's not just oversimplified — it's often wrong. A stock with a P/E of 15 can be overvalued. A stock with a P/E of 40 can be a bargain. The number alone means nothing without context.
The context that matters most is how that P/E compares to the company's own history. Not to the market average. Not to a different company in a different industry. To itself, over time.
This article shows you how to do that — and what to look for when you do.
Disclaimer: This article is for educational and informational purposes only. It does not constitute investment advice. Always do your own research before making any investment decisions.
The Problem with a Single P/E Number
The Price-to-Earnings ratio divides the current stock price by earnings per share. It tells you how much investors are paying for each dollar of profit the company generates. A P/E of 30 means investors are paying $30 for every $1 of annual earnings.
Simple enough. But here's where most investors go wrong: they compare P/E ratios across companies or across sectors and draw conclusions.
A utility company trading at 18x earnings is not necessarily "cheaper" than a tech company trading at 35x. Utilities grow slowly, generate predictable cash flows, and carry significant debt. Tech companies can compound earnings at 15-20% per year. The market prices these fundamentally different businesses at fundamentally different multiples — and it should.
Comparing P/E across sectors is like comparing the price per square meter of an apartment in downtown Manhattan to one in rural Iowa. The numbers are different because the assets are different. The P/E of a slow-growth dividend payer and a high-growth compounder shouldn't be the same, and the fact that they're not doesn't tell you which is the better deal.
So if cross-company comparison is unreliable, what works?
Trailing P/E vs. Forward P/E: Which One to Use
Before you can analyze P/E over time, you need to understand which P/E you're looking at.
Trailing P/E uses the last 12 months of actual reported earnings (TTM — Trailing Twelve Months). It's based on real numbers that the company has already delivered. The advantage: it's factual. The disadvantage: it's backward-looking. If a company just had a terrible quarter due to a one-time charge, the trailing P/E will spike even if the business is fine.
Forward P/E uses analyst estimates of the next 12 months of earnings. It's forward-looking, which makes it more relevant for investment decisions. The disadvantage: it's based on predictions, and analysts are frequently wrong — especially during economic turning points.
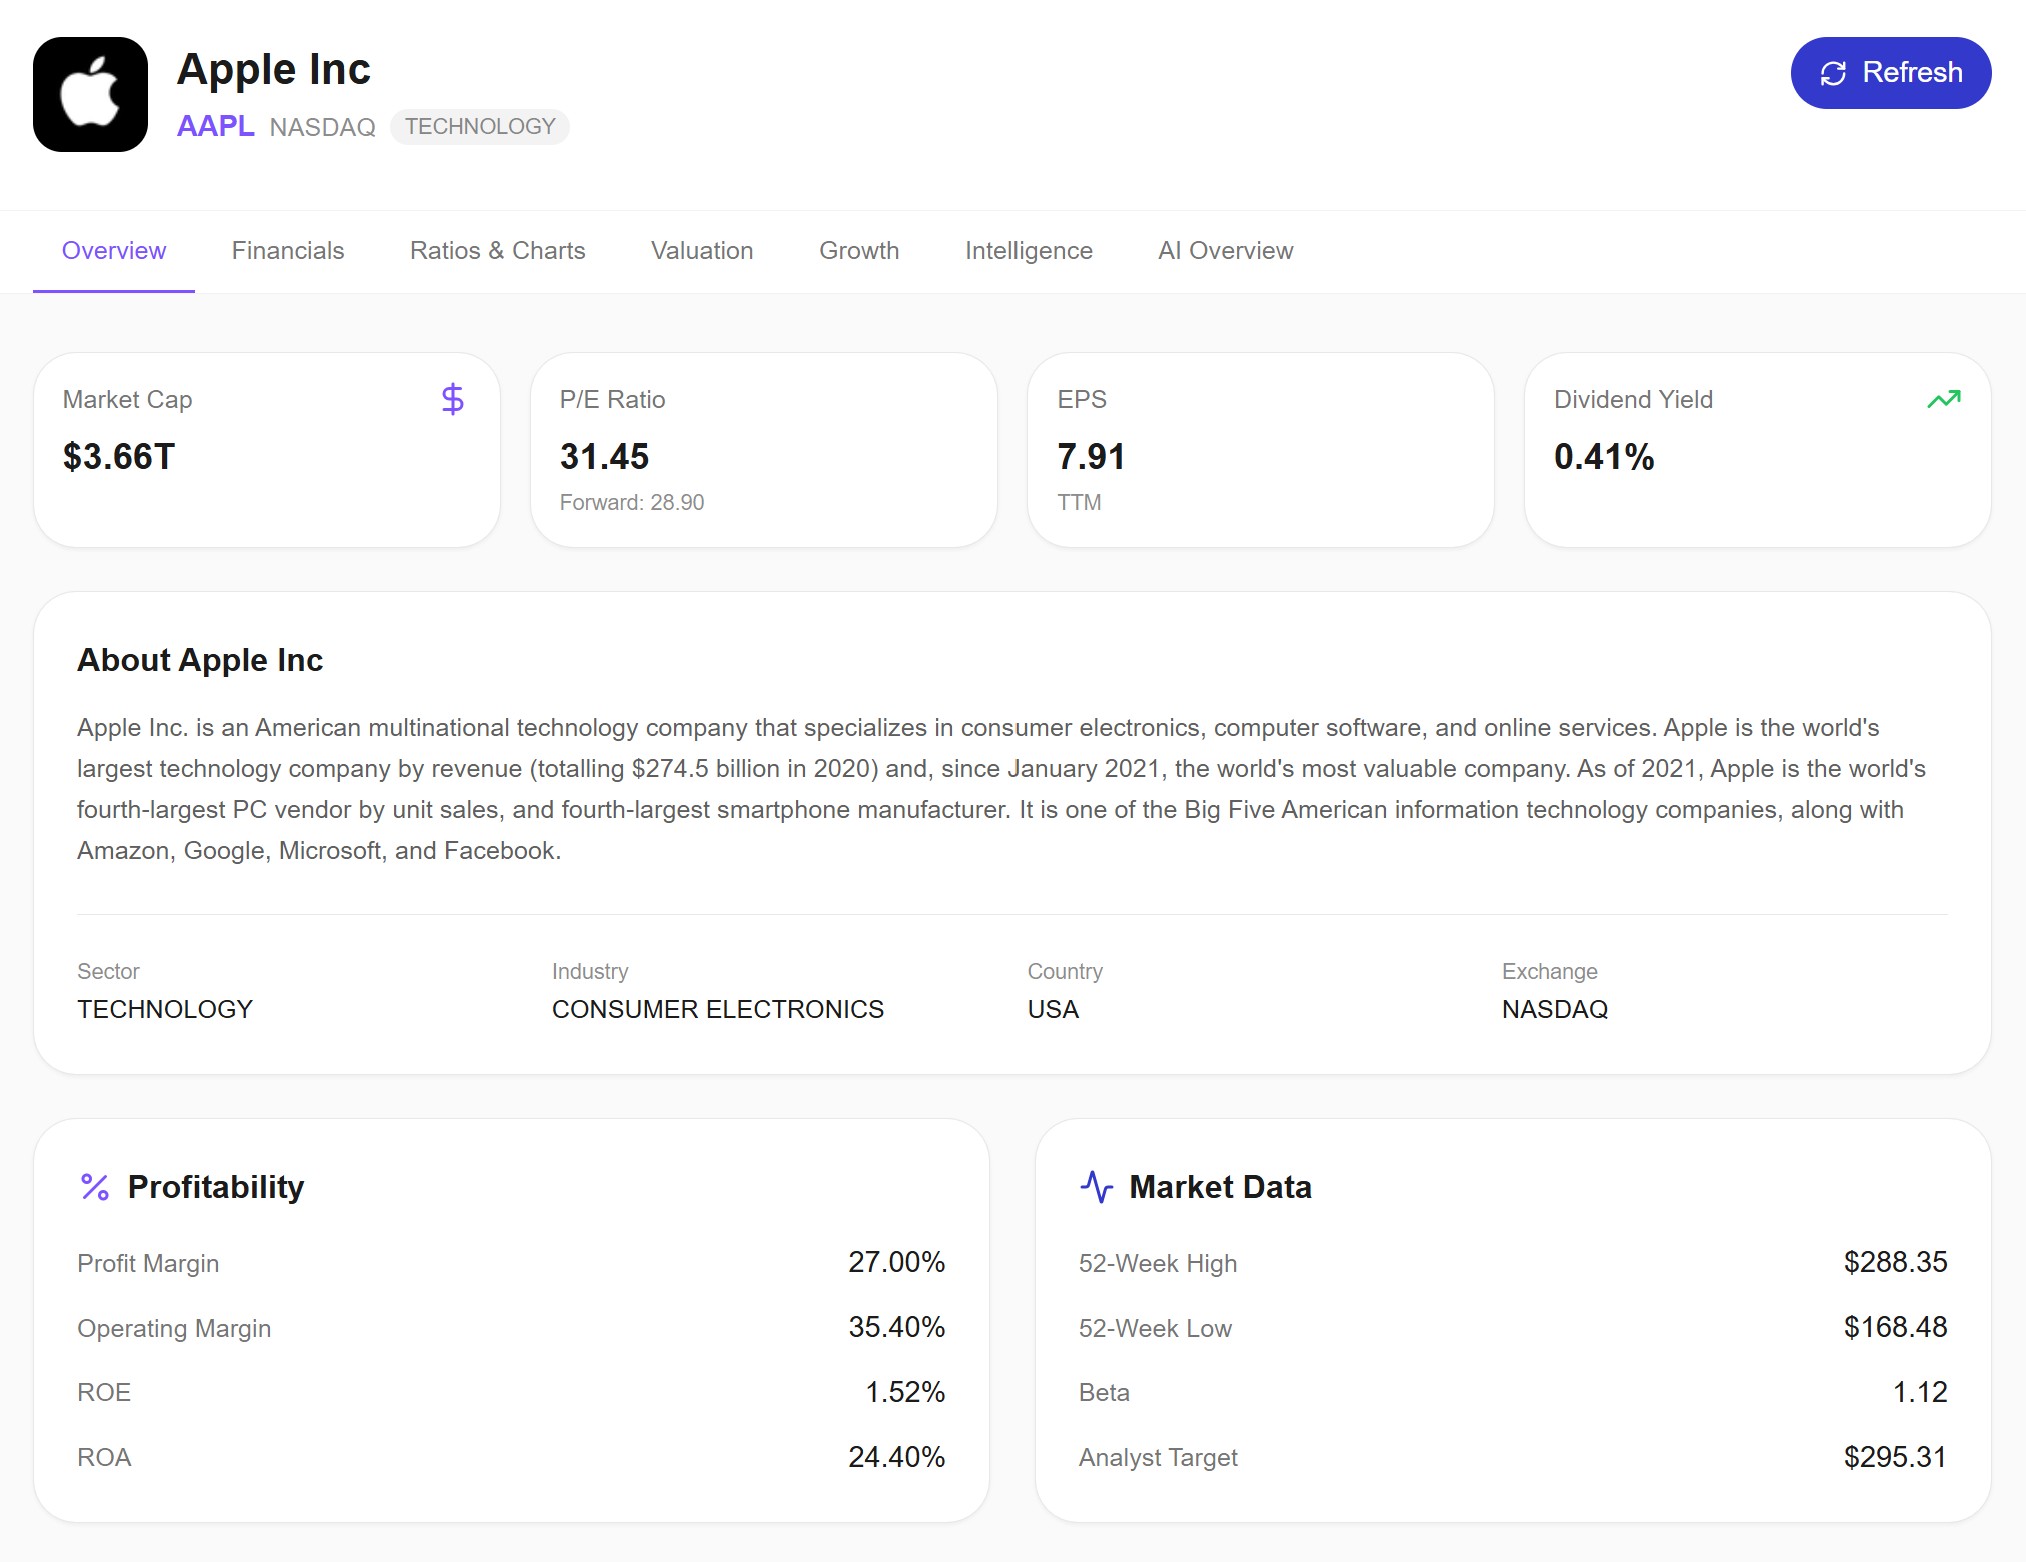
Look at this example. Apple's trailing P/E is 31.45 based on the last 12 months of actual earnings. The forward P/E is 28.90 based on what analysts expect over the next year. That gap tells you something: the market expects earnings to grow, which would bring the P/E down even if the stock price stays flat.
The practical rule: use trailing P/E for historical analysis (comparing the company to itself over time), and forward P/E as a sanity check on whether the market's expectations are reasonable. If trailing P/E is 35 but forward P/E is 20, the market is pricing in massive earnings growth — and you should assess whether that growth is realistic.
The Real Power: Tracking P/E Over Time
Here's where the analysis gets genuinely useful.
Instead of looking at today's P/E and asking "is this high or low?", plot the company's trailing P/E at every quarter-end over the past 10 years. Now you can see the full valuation history — and the current number has context.
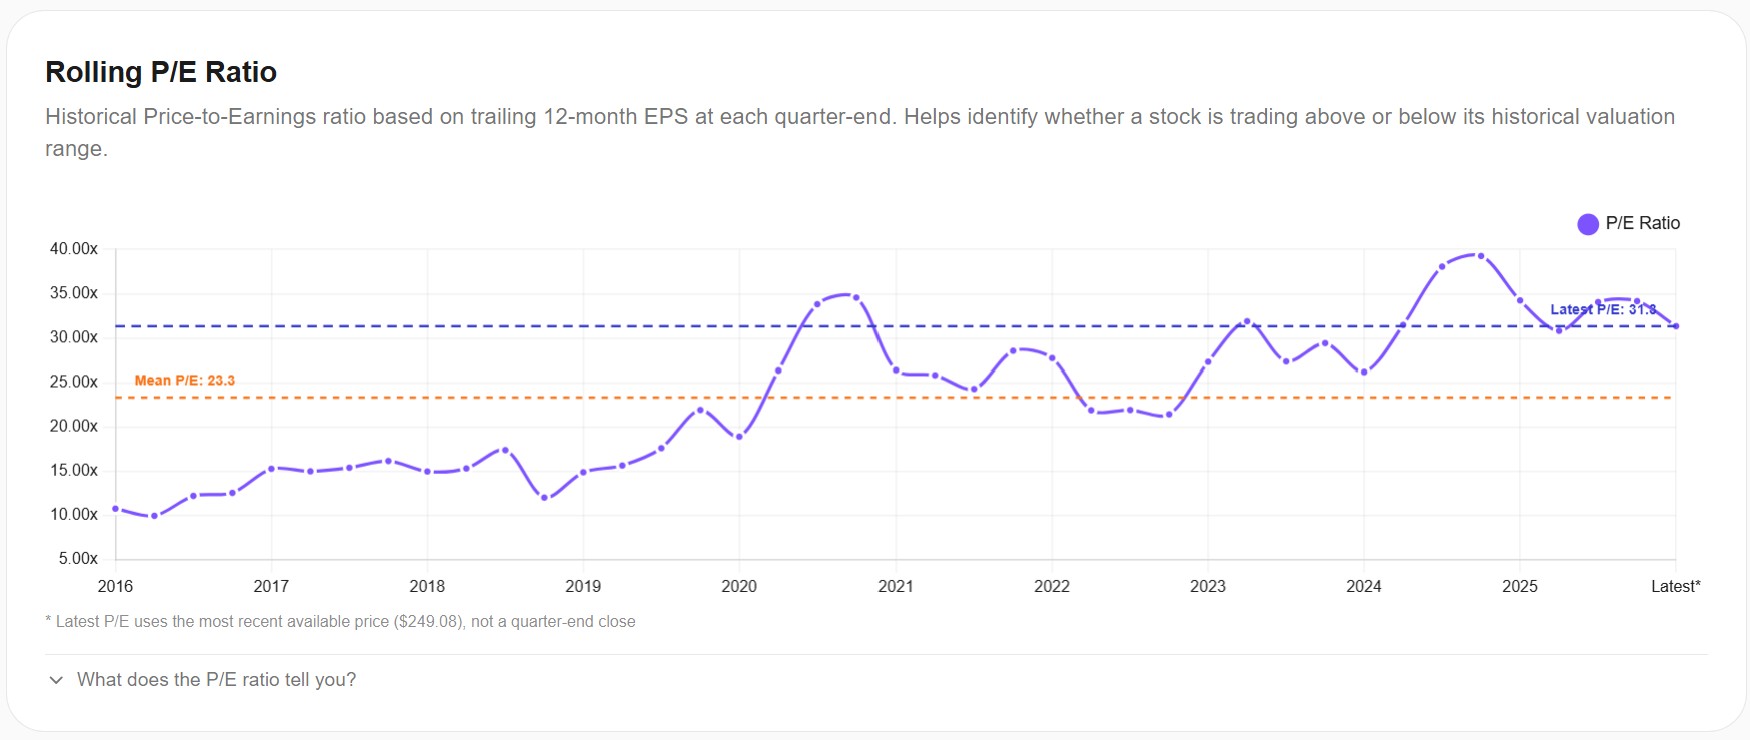
This chart tells a story that a single number never could.
In 2016, Apple traded at roughly 10-11x earnings. The market viewed it as a hardware company — cyclical, dependent on iPhone upgrade cycles, with limited growth ahead. Then something shifted. Services revenue started growing. Wearables became a real category. The narrative changed from "hardware company" to "ecosystem company," and the multiple expanded steadily.
By 2020-2021, the P/E had reached 30-35x — more than triple where it started. Was Apple suddenly "expensive"? Compared to its own history, yes. But the business had also fundamentally changed. Services margins are much higher than hardware margins. Recurring revenue from subscriptions is valued differently than one-time product sales. The higher multiple reflected a structurally different (and arguably better) business.
Today the P/E sits at about 31x against a 10-year mean of 23.3x. That tells you the stock is trading above its historical average valuation. It doesn't mean it's overvalued — but it does mean the market is pricing in continued growth and margin expansion. If that growth disappoints, the multiple compresses and the stock drops even if earnings stay flat.
What to look for in a historical P/E chart
The trend direction. Is the P/E expanding (market willing to pay more for each dollar of earnings) or compressing? A steadily rising P/E often signals a positive narrative shift — the market is rerating the company. A declining P/E suggests the opposite.
The current level vs. the mean. This is the simplest and most useful comparison. If the P/E is significantly above the historical mean, the stock is priced for perfection — any earnings miss or growth slowdown will hurt. If it's below the mean, the market may be overly pessimistic, and there's potential for multiple expansion if results improve.
Spikes and crashes. Look for sharp P/E moves and connect them to events. A sudden P/E spike might be earnings dropping (denominator gets smaller, so ratio jumps) rather than the stock getting more expensive. A sudden P/E crash might be earnings surging after a beat. Always check whether the move came from the price side or the earnings side.
Mean reversion. Over long periods, P/E ratios tend to gravitate back toward their mean. This isn't guaranteed — sometimes the mean itself shifts due to structural changes in the business — but it's a useful base case. A company trading at 2x its historical mean P/E needs a very strong reason to stay there.
P/E Is Only Useful with Profitability Context
A low P/E can be a value opportunity — or a value trap. The difference usually lives in the profitability data.
If a stock's P/E has dropped from 25x to 15x, there are two very different explanations. Either the stock price fell while earnings stayed stable (potential opportunity), or the stock price fell because earnings are deteriorating and the market expects further decline (potential trap).
Profitability trends tell you which scenario you're in.
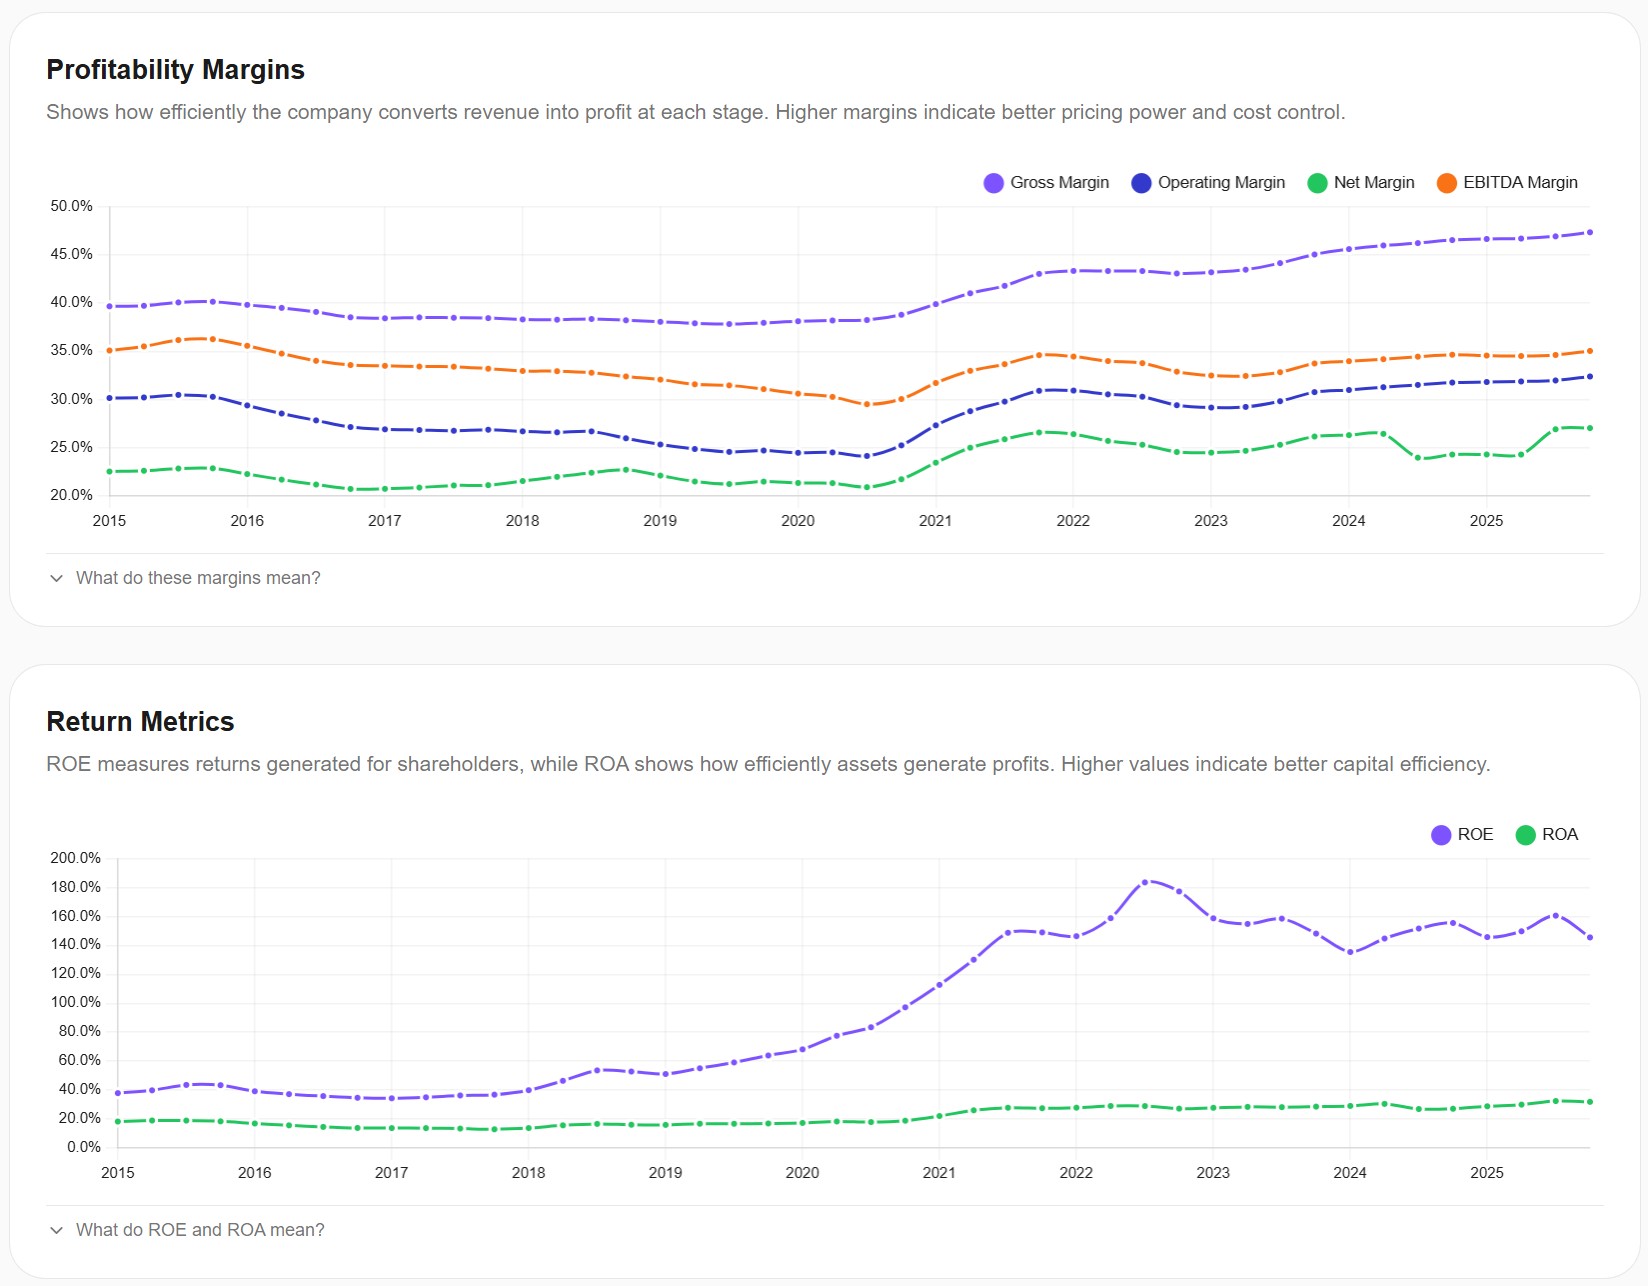
Look at what Apple's margins have done over the same period where the P/E expanded from 10x to 31x. Gross margins moved from about 38% to 47%. Operating margins went from 28% to 33%. ROE increased from roughly 35% to over 140% (partly driven by share buybacks reducing equity, but still indicative of enormous profitability).
This is the profitability context that justifies a higher P/E. The company is converting a larger share of every revenue dollar into profit. The business quality improved — and the market rewarded it with a higher multiple. A P/E expansion backed by improving margins is fundamentally different from a P/E expansion driven by speculation or momentum.
The framework to remember:
Rising P/E + rising margins = the market is recognizing improving business quality. Sustainable.
Rising P/E + flat or declining margins = the multiple is expanding without fundamental support. Risky.
Falling P/E + stable or rising margins = the market may be undervaluing the company. Potential opportunity.
Falling P/E + falling margins = the market is reacting to deteriorating fundamentals. Usually justified.
Common P/E Mistakes to Avoid
Comparing across sectors
Tech stocks typically trade at 25-40x earnings. Banks trade at 8-15x. Utilities at 12-20x. These ranges exist for structural reasons — growth rates, capital intensity, regulatory environments, and margin profiles are fundamentally different. A bank at 12x is not "cheaper" than a tech company at 30x. They're priced for different realities.
Using P/E on companies with negative or near-zero earnings
If a company earned $0.01 per share, the P/E might be 5,000x. That number is mathematically correct and analytically meaningless. For companies with thin, volatile, or negative earnings, P/E is the wrong metric entirely. Use Price-to-Sales, Price-to-Free-Cash-Flow, or EV/EBITDA instead.
Ignoring one-time items
A company that took a $2 billion restructuring charge in Q4 will show depressed TTM earnings and an inflated P/E. That doesn't mean the stock is expensive — it means the denominator is temporarily distorted. Always check whether recent earnings were affected by non-recurring items before drawing conclusions from the P/E.
Treating the P/E as a buy/sell signal
The P/E ratio is an input to your analysis, not the conclusion. A stock below its historical mean P/E might stay there for years if the business is structurally declining. A stock above its historical mean might keep rising if earnings growth accelerates. The P/E tells you what the market is pricing — it's your job to decide whether that pricing is justified.
A Practical Framework for Using P/E
Here's how to put this together in a real research process:
Step 1: Check the trailing P/E and forward P/E. If forward is significantly lower than trailing, the market expects earnings growth. If forward is higher, the market expects earnings to decline. Either case requires investigation.
Step 2: Plot the historical P/E over 5-10 years. Where does today's P/E sit relative to the mean? Is the trend expanding or compressing? What events caused the major shifts?
Step 3: Cross-reference with profitability trends. Are margins improving to support the current multiple? Or is the P/E elevated without fundamental backing? The margins chart will tell you quickly.
Step 4: Consider the earnings quality. Are recent earnings clean, or were they inflated by one-time gains or deflated by one-time charges? Adjust your interpretation accordingly.
Step 5: Make a judgment. Based on all four inputs — current P/E, historical P/E, profitability trends, and earnings quality — form a view on whether the stock's current valuation seems reasonable, stretched, or discounted relative to its own track record.
This isn't about finding a magic number. It's about building a multi-dimensional picture that gives you confidence in your assessment — or flags the areas where you need to dig deeper.
You can run this entire analysis — historical P/E with mean comparison, profitability trends, and earnings data — on the fundamental analysis page. All data comes from verified SEC filings, and the AI assessment synthesizes the picture across all five dimensions.
Want to test these insights on your own portfolios?
Awalyt is a portfolio analysis platform: backtesting on daily data, fundamental analysis, asset analysis, and AI-powered insights.
Get Started FreeRelated Insights
How to Tell If a Stock Is Overvalued or Undervalued: A Framework with Real Examples [2026]
13 min read
Is Adobe the Most Undervalued Tech Stock Right Now? A Data-Driven Analysis [March 2026]
14 min read
How to Check ETF Overlap for Free (VOO vs QQQ) [2026]
9 min read