10 Years of $300/Month DCA: What Happened on VOO, QQQ, AAPL, and 7 Other Popular Assets [2026]
Pick any popular ETF, set up $300 a month, let it run for ten years. That's $36,000 handed over to the market in 120 contributions, calmly, regardless of what was happening in the headlines.
What does that get you in 2026?
If you picked Apple, $152,340. If you picked the Vanguard total bond market fund, $38,050, barely two thousand more than what you put in. If you picked gold, $91,510, which is more than the same DCA into the S&P 500 would have given you. Same strategy, same dollar amount, same patience. The asset choice did the rest.
I ran the simulation on ten popular tickers using daily-precision data, the same data the free Awalyt DCA calculator runs on. Six broad-market ETFs, two single stocks the average DIY investor on Bogleheads or r/ETFs talks about, plus gold and the long-suffering total bond market fund. Here's what the numbers look like, what's hiding behind them, and what I'd take away from the spread.
Disclaimer: This article is for educational and informational purposes only. It does not constitute investment advice. Past performance does not guarantee future results. Always do your own research before making any investment decisions.
The Setup
Same input for every asset. $300 invested on roughly the same monthly trading day from May 21, 2016 to May 19, 2026. Exactly 120 contributions, $36,000 in total contributions. Adjusted-close prices, so dividends and splits are already reinvested. No fees, no taxes, no slippage assumed. The annualized returns shown are money-weighted (IRR), which is the correct measure for a staggered cashflow rather than a single lump-sum CAGR.
If you want to run any of these numbers yourself on a different asset, dollar amount, or window, the Awalyt DCA calculator is free and uses the same data this article is built on.
The Full Table
Sorted by final portfolio value, highest to lowest.
| Asset | Final value | Total return | IRR (annualized) | Multiple |
|---|---|---|---|---|
| AAPL | $152,340 | 323.18% | 27.23% | 4.23× |
| QQQ | $110,140 | 205.94% | 21.22% | 3.06× |
| MSFT | $104,340 | 189.83% | 20.22% | 2.90× |
| GLD | $91,510 | 154.20% | 17.78% | 2.54× |
| VOO | $82,420 | 128.94% | 15.84% | 2.29× |
| VT | $71,190 | 97.74% | 13.10% | 1.98× |
| SCHD | $68,840 | 91.21% | 12.47% | 1.91× |
| VXUS | $61,670 | 71.30% | 10.40% | 1.71× |
| EEM | $60,440 | 67.89% | 10.02% | 1.68× |
| BND | $38,050 | 5.71% | 1.10% | 1.06× |
A few things to read out of this table before the individual charts. The single best outcome was four times the worst. The annualized return ranges from 1.10% to 27.23% on the same effort, same patience, same monthly check. And the cluster between $60K and $90K (VXUS, EEM, SCHD, VT, VOO, GLD) is where most "diversified" DIY portfolios actually live. The two tails are where the asset-allocation conversation really happens.
Single Stocks: When DCA on a Concentrated Bet Worked
Two of the three best outcomes came from individual companies. Apple at 27.23% IRR, Microsoft at 20.22%. Both beat the Nasdaq-100 ETF (21.22%) and obviously the S&P 500 (15.84%).
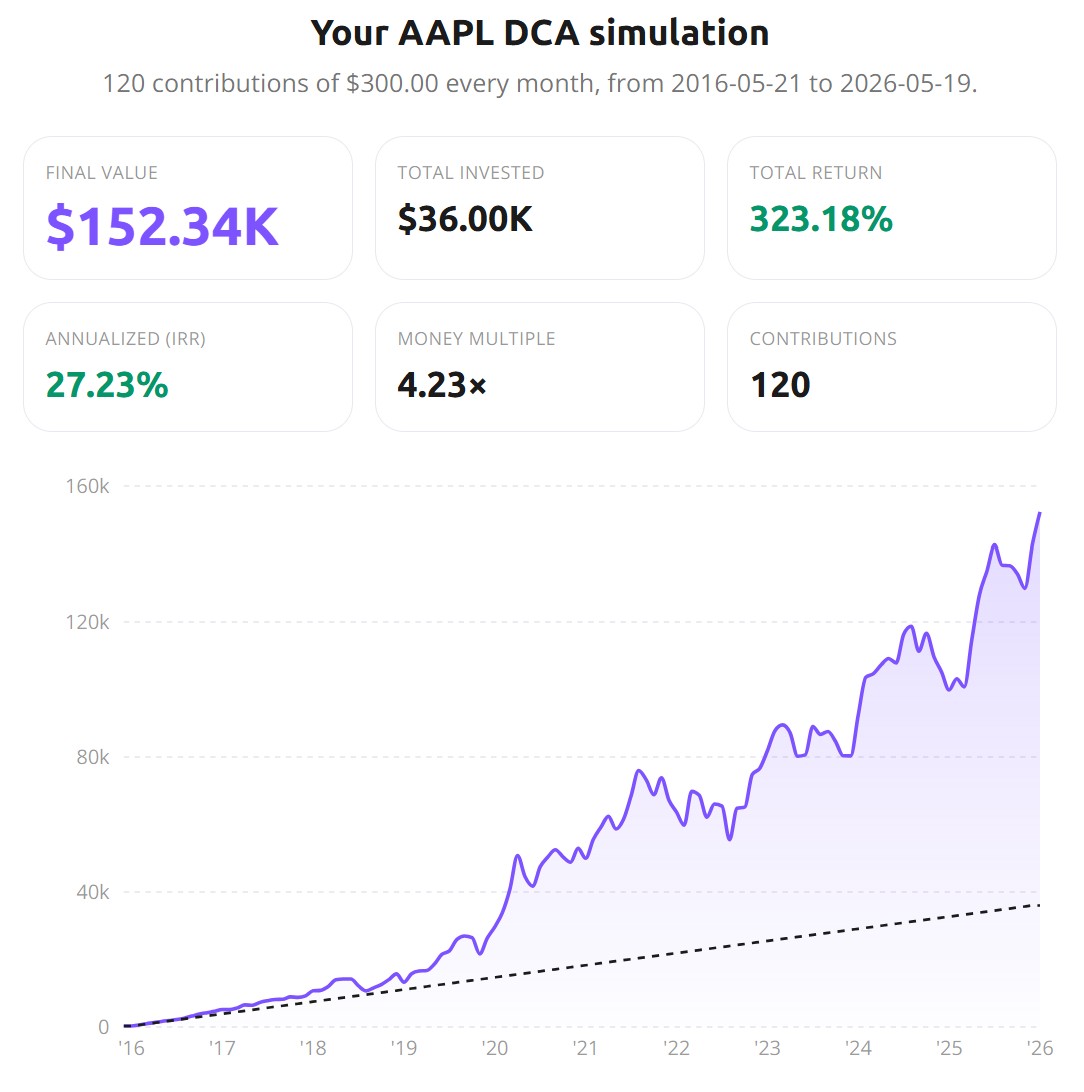
The Apple chart shows what a winning long-DCA on a single stock actually looks like. The curve diverges meaningfully from the dashed contribution line around 2019, then accelerates through 2020-2021, takes a beating in 2022 (the dip from roughly $80K to under $70K), recovers, and then runs to $152K through 2024-2025.
Here's the part worth being honest about. AAPL and MSFT were not random picks. They ended this decade as two of the four trillion-dollar US companies. Selecting them out of the universe of "popular single stocks the average retail investor was talking about in 2016" is exactly the kind of ex-post selection bias I called out in the 6 most common backtesting mistakes. For every Apple in the 2016 cocktail-party conversation there was an Intel, a General Electric, a 3M: companies that looked equally durable and have not done well. The dispersion among "blue chips" is wider than the dispersion among broad-market ETFs.
The point of including AAPL and MSFT in this list is to show what the upside of a concentrated bet can look like, not to suggest it's the expected outcome.
VOO: The Benchmark Most Readers Came For
VOO is the asset most people quietly assume as the default against which everything else gets measured. So this is the chart most readers came for.
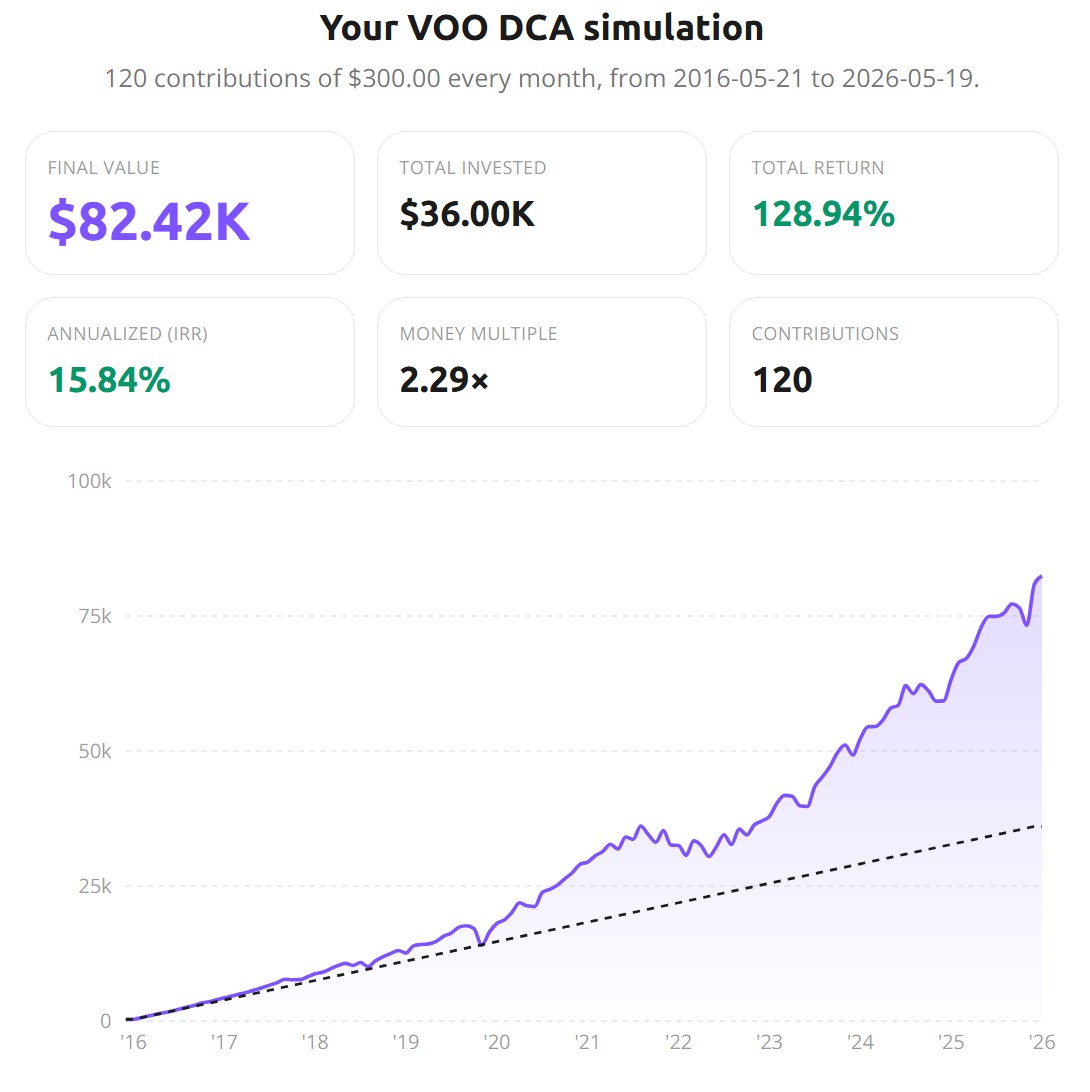
$82,420 final value. A money multiple of 2.29×. Annualized IRR of 15.84%, which sounds modest next to AAPL's 27% but is well above the long-term S&P 500 historical average, which sits closer to 10%. This decade was unusually generous to US large-cap equities. For a deeper look at the same number through the lump-sum lens with drawdowns and rolling volatility, the VOO 10-year article walks through the daily-data picture.
Two things to take from this specifically in a DCA context. First, the 15.84% money-weighted return is genuinely an excellent outcome on autopilot. Second, projecting it forward straight-line into the next ten years would be a mistake. Plug a more conservative 10% IRR assumption into the same $300/month for the next decade and the final number drops by roughly $20K. Same effort, weaker tailwinds, smaller result.
GLD: The Result I Was Not Expecting
This is the chart that surprised me.
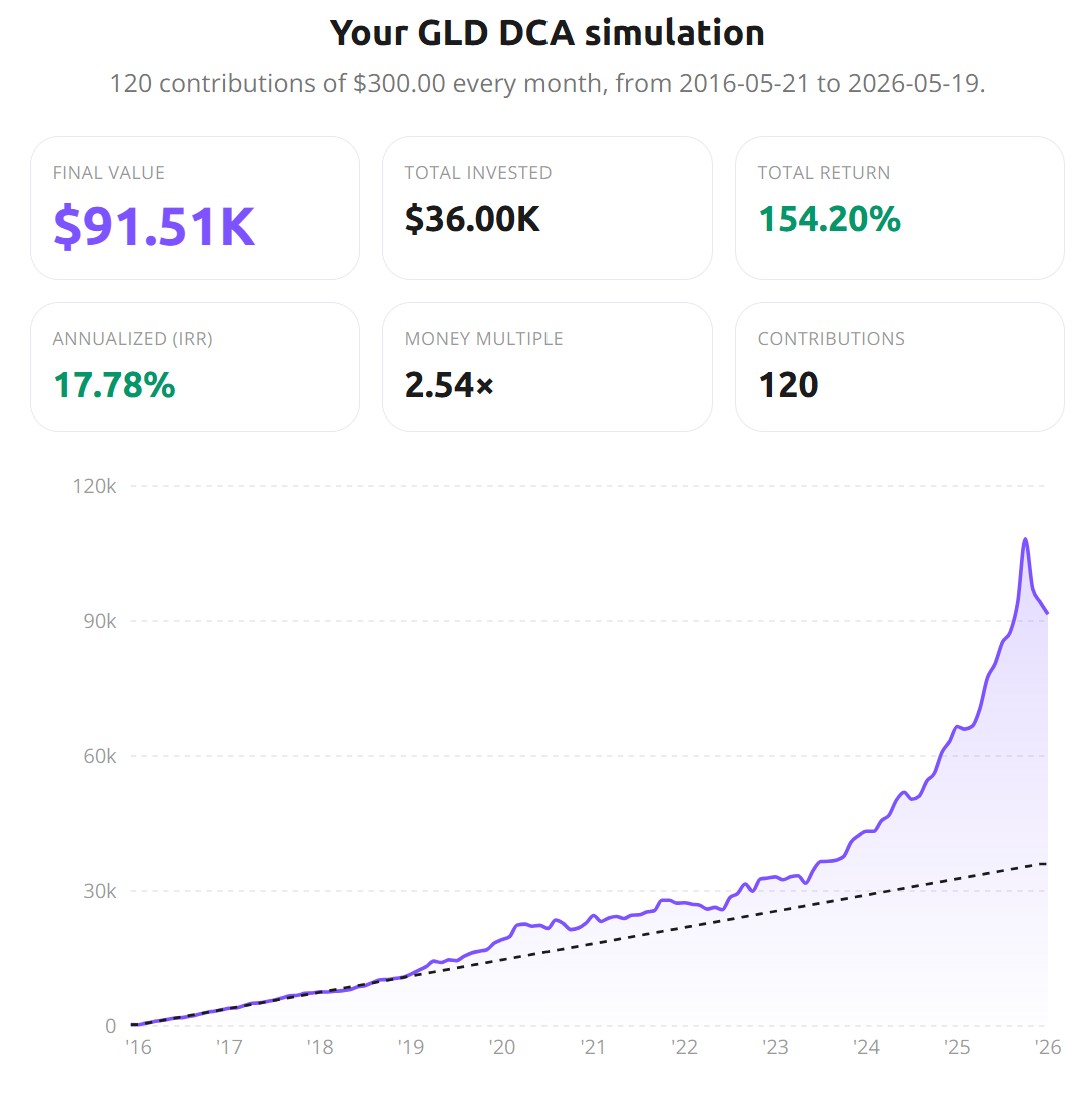
$300/month into gold over the same window: $91,510 at a 17.78% IRR. That is higher than VOO. Higher than SCHD, VT, VXUS, EEM, and obviously BND. Over ten years of consistent DCA, gold beat the S&P 500.
Most of that outperformance is concentrated in the last 18 months of the window. Look at the chart. Through 2022 the curve is barely above the contribution line. From late 2023 onward the slope becomes nearly vertical. Central bank gold buying, geopolitical tensions, sticky inflation, and a weakening dollar all contributed. The small dip just before the final value is the recent pullback from the late-2025 peak, also visible in the data.
The takeaway is not "buy gold". It's that an asset class many serious investors treat as a fringe allocation outperformed the consensus pick over a decade of consistent buying. The exact same chart run in May 2024, only twelve months ago, would have looked very different. Path matters. One of the cleanest reasons to test your own assumptions on this kind of data is precisely to surface results like this before committing.
The International Drag
VT, VXUS, and EEM all underperformed VOO meaningfully. VT (the global all-world ETF, including the US) finished at $71K. VXUS (international ex-US developed and emerging) at $62K. EEM (emerging markets) at $60K.
Compared to VOO, this is roughly $10K to $22K less on a $36K investment. The driver isn't mysterious. Over this specific decade US large-cap profitability and multiple expansion outpaced the rest of the world by a wide margin. International equities had longer flat stretches, sharper drawdowns at points, and weaker recoveries. The 2022 sell-off hit VT and VXUS roughly as hard as VOO without the same fast bounce afterwards.
This is not an argument against international diversification. It's a reminder that "diversification reduces risk" doesn't translate to "diversification produces higher returns in every decade". For a decade where US led globally, holding non-US equities cost money. The next decade may reverse the pattern. Or it may not. Going in eyes open is the part most decade-out blog posts skip over.
BND: The Cautionary Tale
Then there's the bond fund.
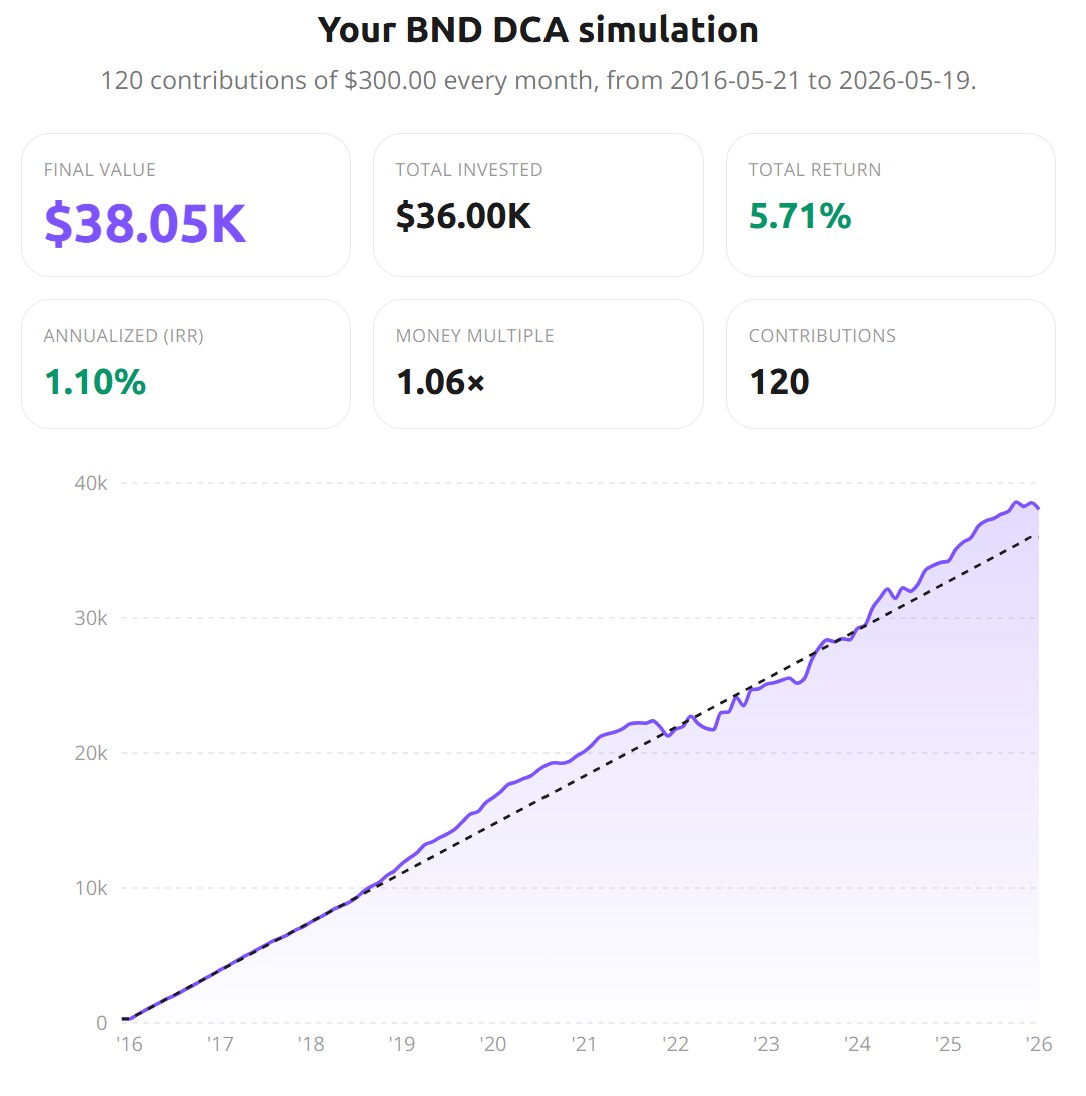
$36,000 in. $38,050 out. Total return 5.71%. IRR 1.10%. Money multiple 1.06×.
Now compare that nominal return to the price of everything else over the same window. Cumulative US inflation from May 2016 to early 2026 ran roughly 35-38% depending on the index series. Your $38,050 in May 2026 buys meaningfully less than your $36,000 in 2016 did. In real terms, a $300/month DCA into BND for ten years was a slow erosion of purchasing power, not a slow gain.
The reason is in the chart. Look at where the curve sits relative to the dashed contribution line. It tracks the line almost exactly from 2016 to early 2022, then dips below it through 2022 and most of 2023. That is the bond carnage that hit duration funds when the Fed went from near-zero rates to over 5% in eighteen months. Recovery from late 2023 brought the curve back above water, but barely.
I included BND in this list precisely because it's the canonical "safe" holding in the standard 60/40 or 3-fund portfolio. Over this decade it did not behave like safety. It behaved like a slow drag. The lesson is not "bonds are bad". It's that asset-class behavior is regime-dependent, and the regime from 2016 to 2026 (zero rates into the fastest hiking cycle in forty years) was particularly hostile to duration.
If you backtested only BND in isolation, the conclusion could mislead you in either direction. The right question is always what BND does inside the context of a full portfolio, not on its own.
What This Data Actually Tells You
A few things worth carrying away.
Asset class matters more than ticker selection within an asset class. The gap between BND and VOO is $44K. The gap between VOO and the average international ETF in this list is around $15K. Picking your asset class is the high-impact decision. Picking the "right" S&P 500 ETF among VOO, IVV, and SPY is largely noise next to that.
DCA does not fix the wrong asset. $300/month into BND for ten years still gave 1.10% IRR. The discipline of the strategy doesn't compensate for the underlying behavior of what you're buying. People sometimes describe DCA as a kind of magic. It's not. It's a mechanical way to remove timing from the equation, not a way to manufacture return.
Diversification cost money this decade. Holding VT or VXUS instead of VOO meant ending the decade with less. That's a true statement about the past, and it's the part of the international-diversification argument most US investors are reluctant to acknowledge. The case for international isn't that it always wins. It's that the next decade could look nothing like this one, and you don't get to know in advance.
Single stocks can beat the index, but you have to actually hold. AAPL ended at 4.23× contributed. The chart also shows three separate moments (late 2018, early 2020, late 2022) where someone holding could have looked at the curve and concluded "this isn't working anymore". The investors who got the 27% IRR are the ones who didn't sell at those moments. Most don't.
This decade is not the baseline. VOO at 15.84% IRR, AAPL at 27%, GLD at 17.78%. These are well above their respective long-term averages. The 2016-2026 window benefited from historically low rates for most of it, a once-in-a-generation tech profitability boom, and a long late-cycle expansion. Projecting any of these numbers forward as "what to expect from a 10-year DCA" is exactly the overconfidence trap the 6 backtesting mistakes article warns against.
What DCA on One Asset Doesn't Tell You
The DCA calculator is a useful first step. It answers questions like "what would I have if I'd DCA'd $300/month into Apple", and it does it accurately, with daily prices and adjusted-close data. What it can't show you is the question most serious investors actually have.
What if I'd put $150/month into VOO and $150/month into VT? Would the international drag have hurt me, or smoothed the ride during 2022? What if I'd rebalanced quarterly between VOO and BND with a 70/30 target? How does the picture change once dividends and capital gains taxes are layered in? These are full-portfolio questions, and a single-asset calculator isn't the right tool to answer them.
That's what the broader Awalyt platform is built for: full-portfolio backtesting with rebalancing logic, drift analysis, and the same daily-precision data the DCA calculator runs on, extended to multi-asset portfolios. If you want to test exactly the kind of "what if I'd held two of these together" question this article hints at, that's where it lives. For more on what serious portfolio backtesting looks like and what it includes, the introduction to portfolio backtesting is the place to start.
Bottom Line
$300 a month for ten years. Same plan, ten very different endings. The plan was never the hard part. The asset choice was, and most "good" DCA articles skip over that quietly.
What I'd encourage you to do with this is run a few of these yourself. Not to chase the AAPL number, and not to avoid BND, but to see how big the gap between any two of these can be when you change just one variable. The calculator is free, the data is the same one this article runs on, and what you choose to test is up to you.
This article is for educational and informational purposes only. It does not constitute financial, investment, or tax advice. Past performance does not guarantee future results. Always do your own research and consider consulting a qualified financial advisor before making investment decisions.
Want to test these insights on your own portfolios?
Awalyt is a portfolio analysis platform: backtesting on daily data, fundamental analysis, asset analysis, and AI-powered insights.
Get Started Free