If You Invested $10,000 in QQQ 10 Years Ago, Here's What You'd Have Today [2026]
Ten years ago, on May 11, 2016, $10,000 invested in QQQ would be worth $70,138 today. The same money in SPY over the same window would be sitting at roughly $41,600. That's almost $30,000 of difference, from owning the Nasdaq-100 instead of the S&P 500.
What that headline number hides is 2022. A single year where QQQ lost 33% of its value, dropped almost 35% peak-to-trough inside the year, and stayed underwater for months. The kind of year that ends most factor strategies and breaks most retail conviction.
This article shows both sides. The decade that built the $70,138, and the year that almost wiped a third of it away. All backed by 2,511 daily data points spanning May 11, 2016 to May 6, 2026.
Disclaimer: This article is for educational and informational purposes only. It does not constitute investment advice. Past performance does not guarantee future results. Always do your own research before making any investment decisions.
The Headline Number
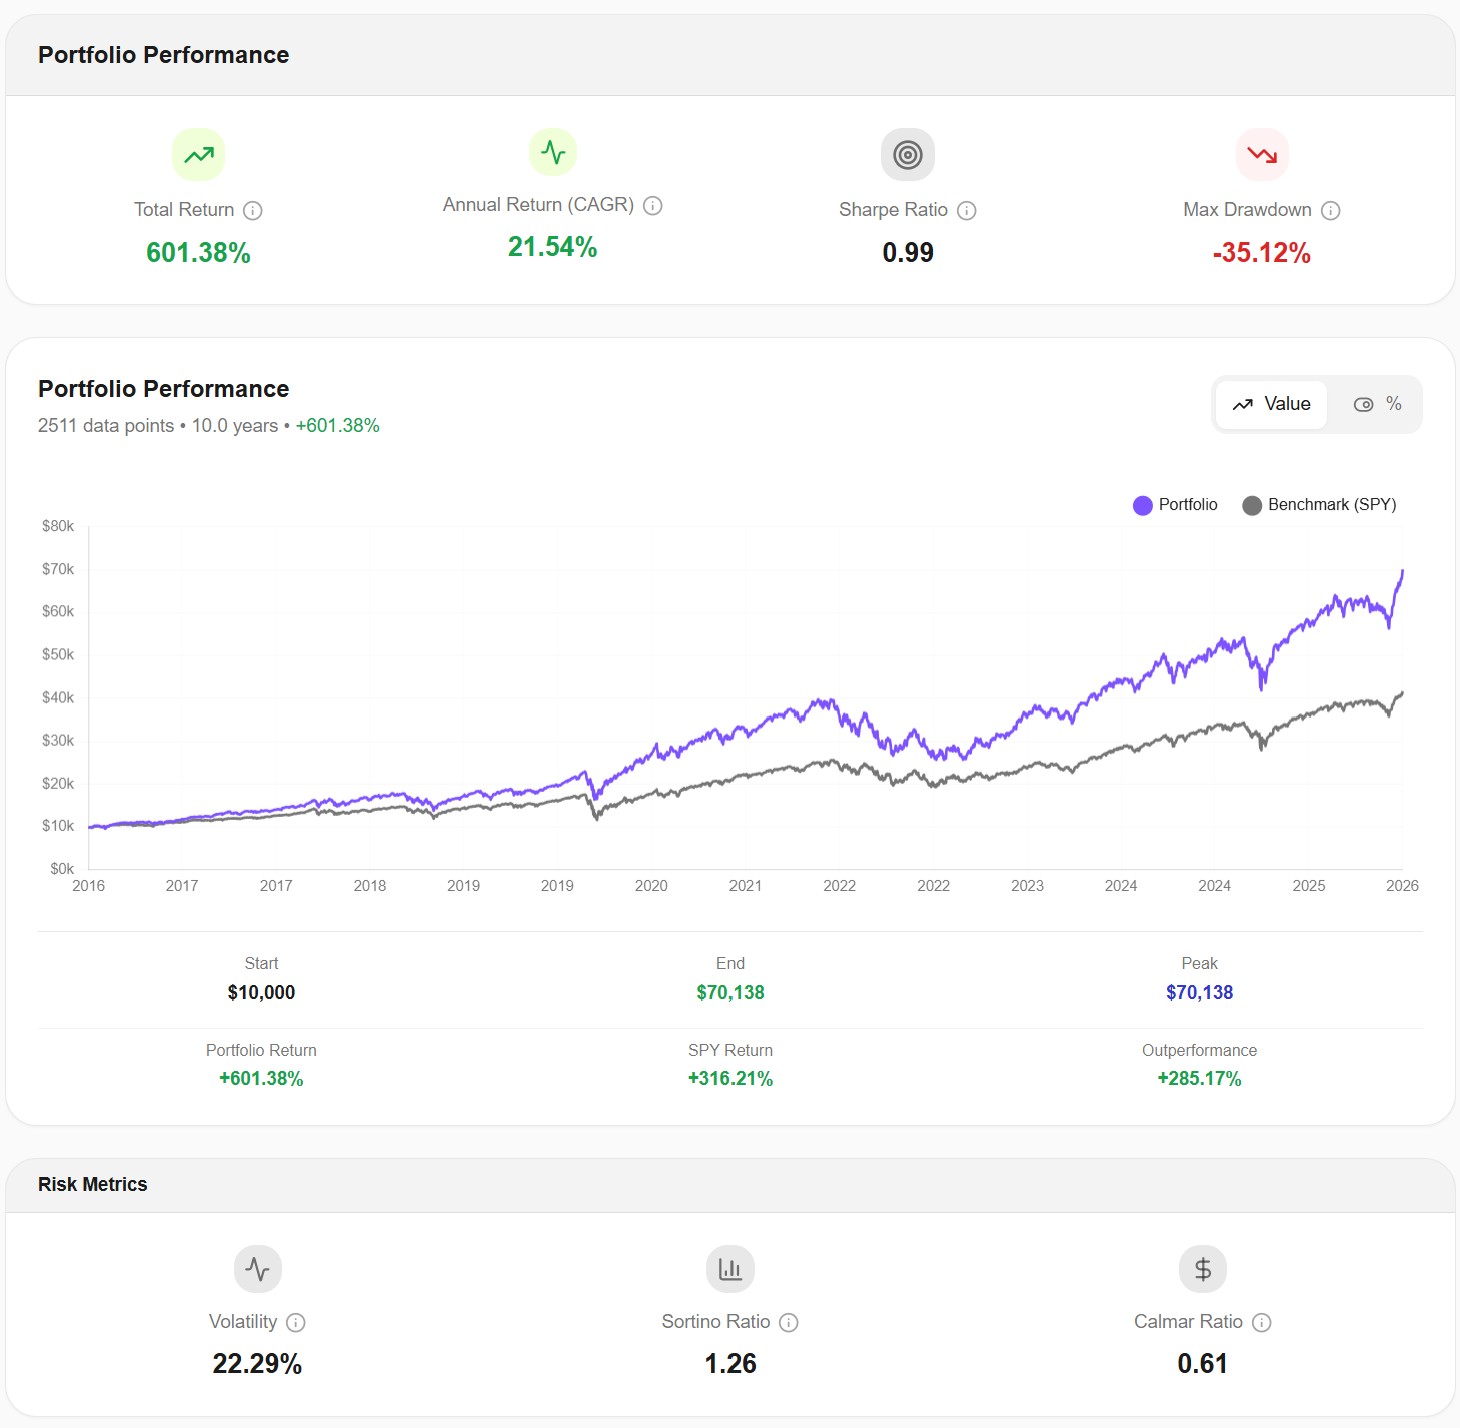
Here's what $10,000 invested in QQQ on May 11, 2016 did over the next decade, with dividends reinvested and nothing else touched.
| Metric | Value |
|---|---|
| Start date | May 11, 2016 |
| End date | May 6, 2026 |
| Initial investment | $10,000 |
| Final value | $70,138 |
| Total return | +601.38% |
| Annualized return (CAGR) | 21.54% |
| Max drawdown | −35.12% |
| Sharpe ratio | 0.99 |
| Volatility (annualized) | 22.29% |
| Daily data points used | 2,511 |
Your money grew sevenfold. The short answer to "what would $10,000 invested in QQQ be worth today" is $70,138 — at a 21.54% CAGR, this decade ran nearly double the long-term average of the Nasdaq-100 itself, and more than double the typical 10% long-run figure for broad US equities. Keep that gap in mind. We'll come back to it.
Compared to SPY over the exact same window, QQQ returned 601.38% against SPY's 316.21%. An outperformance of 285 percentage points across ten years. For broader S&P 500 context, I covered the $10k VOO scenario over a similar decade in If You Invested $10,000 in VOO 10 Years Ago — VOO ended that window near $40,000. QQQ ended this one near $70,000.
The Curve Tells the Real Story
Look at the growth chart above again, but pay attention to the shape of the QQQ line (purple) rather than the endpoints.
From 2016 to early 2020, the curve climbs steadily, faster than SPY but without violent moves. Then comes the March 2020 cliff — a near-vertical drop where about $7,000 of paper value disappeared in five weeks. The recovery was even sharper. By late 2020, QQQ had not just recovered, it had rocketed past its pre-crash peak. The year closed at +46.18%, despite the brutal mid-year drawdown.
Then 2021 added another 29%. By the end of 2021, your $10,000 starting balance was sitting above $45,000. Most QQQ holders at that point probably felt invincible.
2022 changed everything. The line on the chart spent the entire year falling. Not the V-shaped crash of 2020. A slow, grinding bear market that took twelve months to bottom. By the end of 2022, your $45,000 had fallen back to around $30,000. Sixteen months later, the line is back above $55,000 thanks to the AI rally of 2023, but the 2022 experience tells you more about what holding QQQ feels like than any other year in the decade.
This is what 2,511 daily data points look like. Most free backtest tools online use monthly data, 120 data points total for this same 10-year period. On a monthly chart, the March 2020 cliff looks like a soft dip. The 2022 grind looks like a moderate decline rather than the slow-motion collapse it actually was. The worst moments of both years get smoothed away, and the result is a chart that makes QQQ look less risky than it was.
I built Awalyt's backtest engine on daily data from day one for exactly this reason. Monthly averaging smooths the worst moments of every crisis, and the worst moments are usually when you would have been tempted to sell.
The Emotional Path — Best and Worst Years
The headline 21.54% CAGR hides a journey that looked nothing like a 21.54% straight line. Here's what each year delivered.
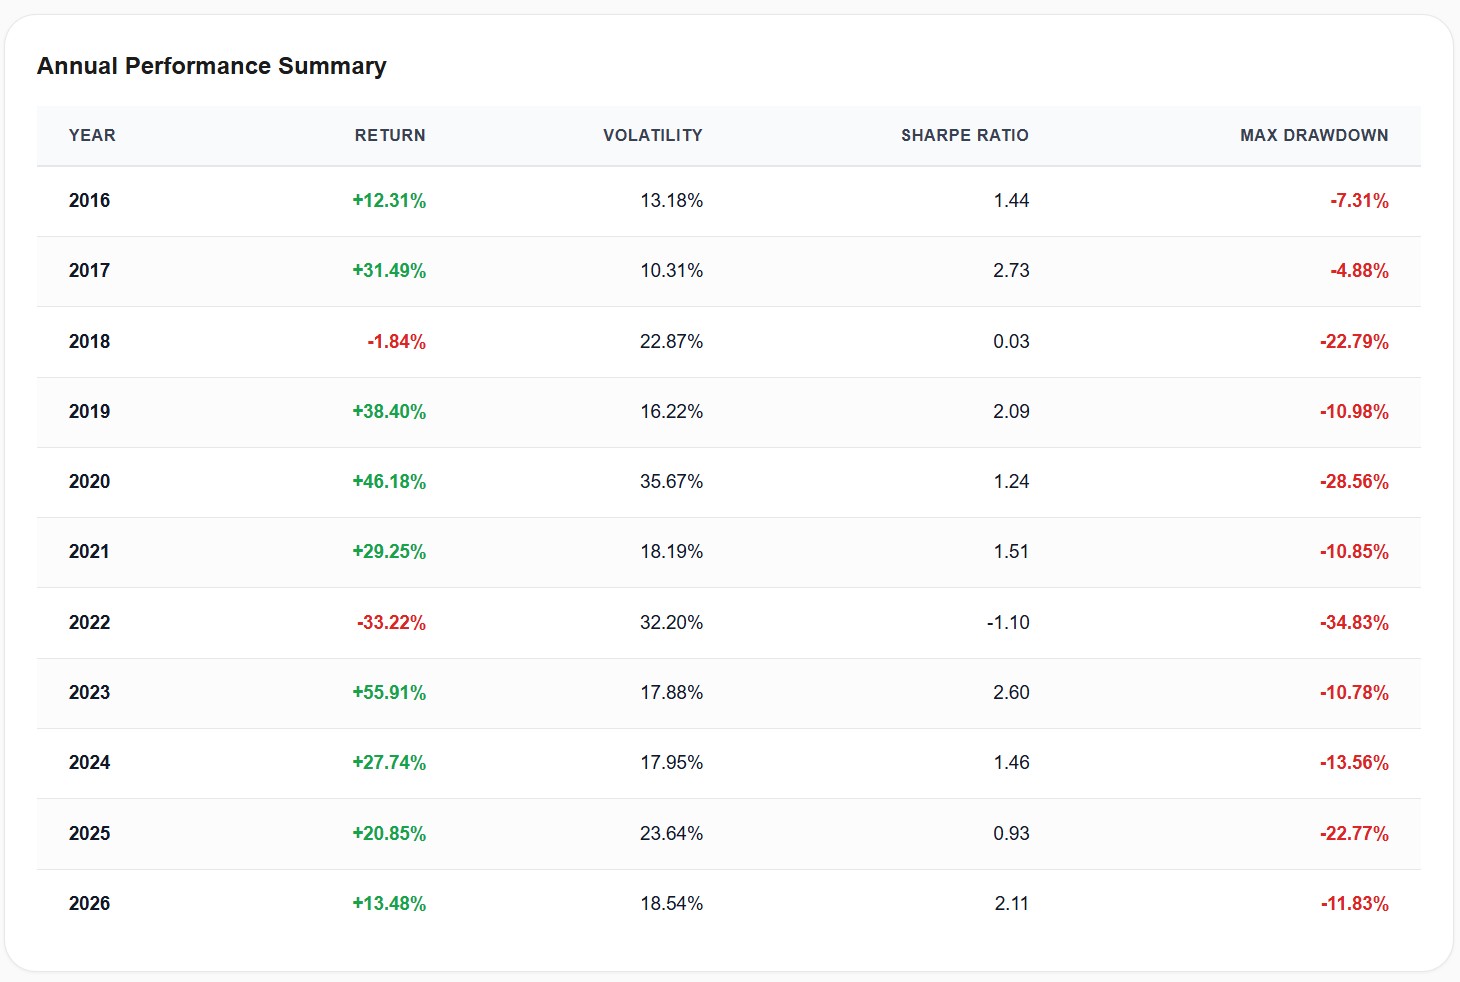
Two years closed red: 2018 and 2022. Five years returned over 27%: 2017, 2019, 2020, 2021, 2023, 2024. The decade was dominated by good years, but the bad ones were not equal.
Look at 2018 first. A modest -1.84% close, but with a max drawdown of -22.79% inside the year. The Q4 2018 correction was the second-worst moment of the decade for QQQ. Most holders probably forgot it ever happened because the year ended near flat.
Now look at 2020. The year closed at +46.18%, the second-best annual return of the decade. The volatility column reads 35.67%, nearly triple a calm year. The max drawdown column reads -28.56% inside that same year. Your $35,000 balance from end-of-2019 dropped to about $25,000 by late March 2020, then rocketed past $50,000 by year-end. A green annual print covering one of the most stressful months in market history.
Then 2022 — the year that defines QQQ as an investment.
The annual return was -33.22%. Volatility hit 32.20%, comparable to 2020's chaos but sustained across the entire year. Max drawdown reached -34.83% intra-year, and the year never recovered. From a peak balance of roughly $50,000 in late 2021, your portfolio drifted down to around $33,000 by October. The drawdown was deeper than 2020 in absolute terms, longer in duration, and without the immediate V-shaped bounce. There was no daily moment of "sell now" panic like March 2020. Instead, twelve months of slowly watching the balance fall.
This is the year that separates QQQ holders from QQQ tourists. Most retail investors who bought QQQ during the 2020-2021 boom didn't make it through 2022. The fund saw outflows. Tech ETFs in general bled assets. Investors who treated QQQ as "I'll just hold this for 30 years" discovered they couldn't hold it for one year of actual losses.
Annual Returns at a Glance
Here's the same data as a line chart. The shape of the decade is easier to see in one image.
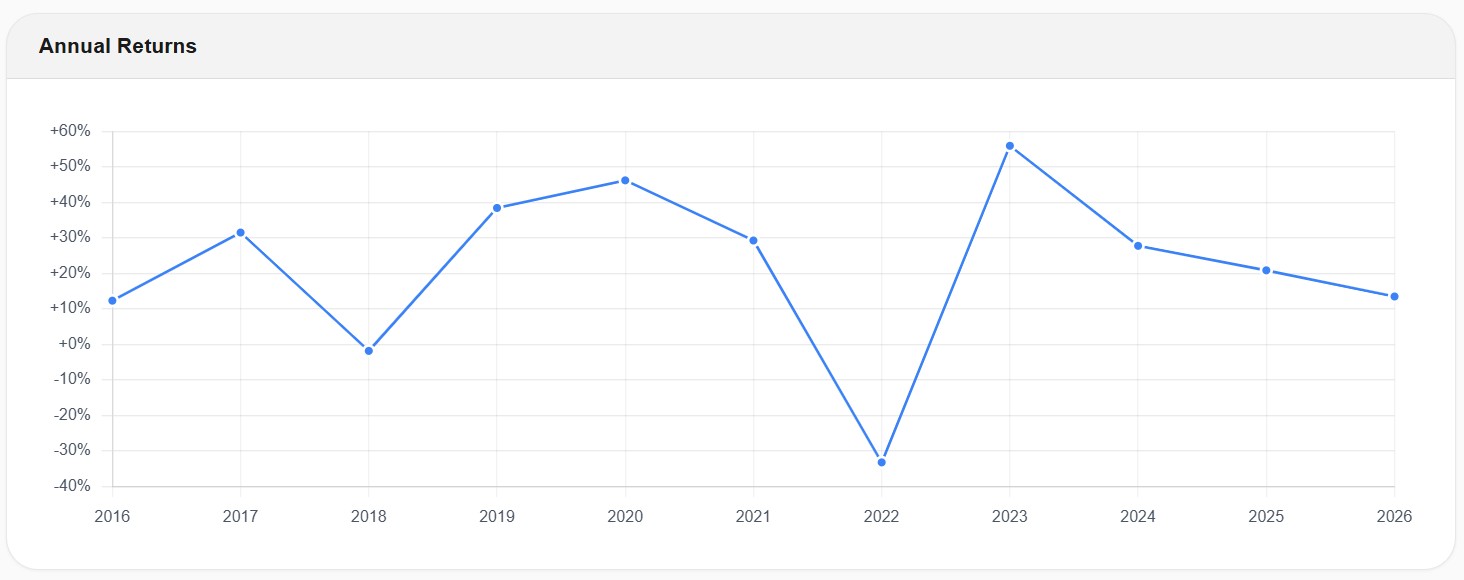
Eight points above zero. Two below. QQQ's 10-year performance is built almost entirely on those eight positive years. The 2022 trough is the deepest point on the chart by a wide margin, lower than 2018 (which was only slightly negative). The 2023 rebound (+55.91%) is the highest point. Together, 2022 and 2023 cancel out almost perfectly, but the experience of living through them in sequence is not a wash. The investor who sold near the bottom of 2022 to "preserve capital" missed the entire 55% rebound, and is statistically the median retail QQQ buyer from that period.
This pattern of huge swings is the price QQQ charges for its long-term outperformance. The S&P 500 doesn't move like this. It would be useful to see exactly how much extra ride QQQ asked you to absorb in exchange for the extra return.
QQQ vs S&P 500 — Where the Premium Came From
The chart below plots semi-annual returns for QQQ (purple) against SPY (dashed blue) over the full decade.
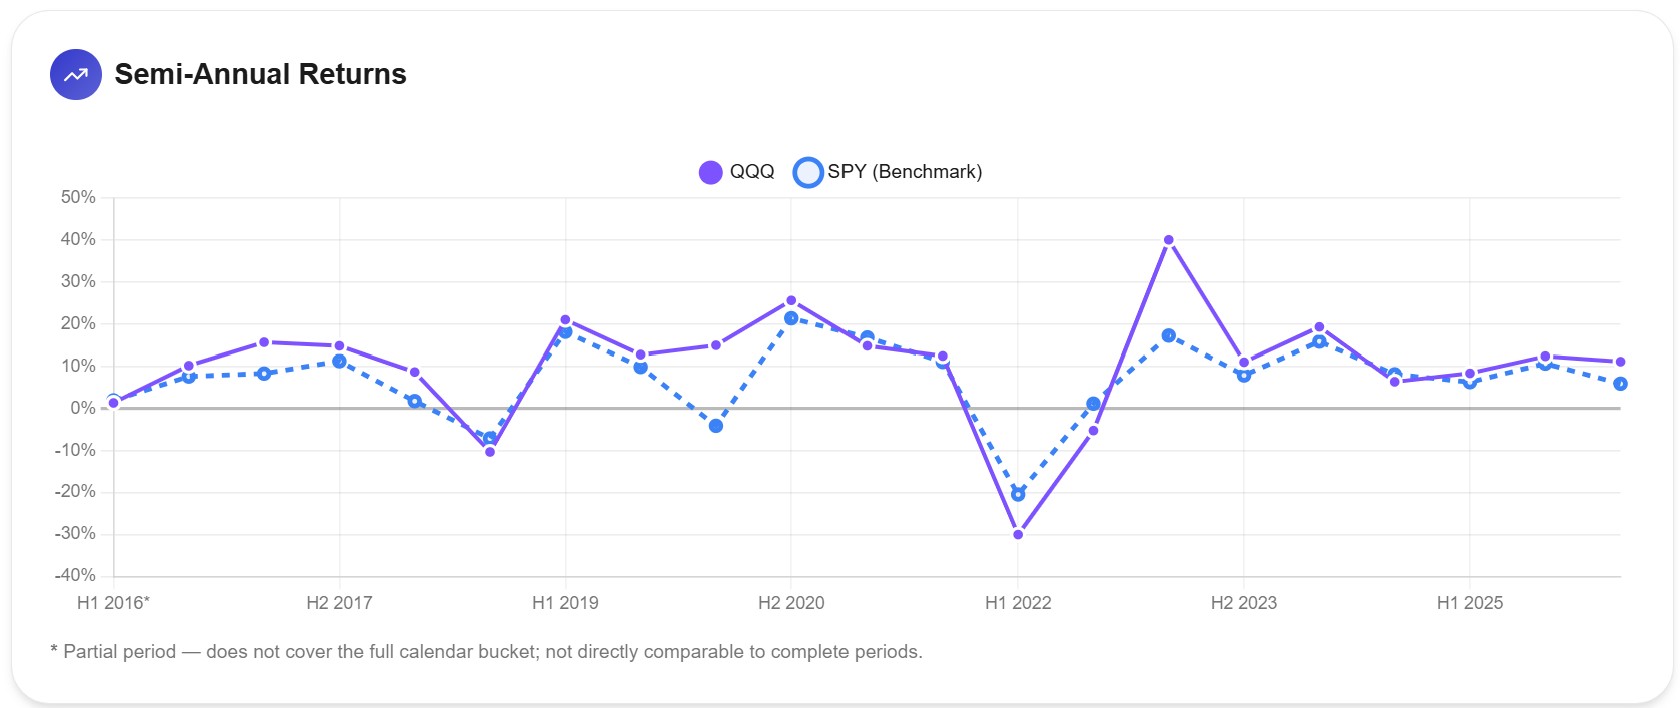
The pattern is more interesting than "QQQ always wins." It doesn't.
QQQ beat SPY in most periods of the decade, sometimes by enormous margins — H2 2023 (+40% vs +17%), H2 2020 (+25% vs +21%), early 2019. But it lost meaningfully in others. H1 2022, the worst half of the decade, was almost twice as bad for QQQ as for SPY (-30% vs -20%). Mid-2018 saw QQQ lag SPY by several points. H2 2019 was roughly tied.
The 285-point outperformance of QQQ vs SPY over the full decade came almost entirely from three windows: 2017, 2019-2020, and 2023. Outside those windows, QQQ and SPY moved very similarly. When QQQ lost to SPY, it lost more than when it won.
This asymmetry is structural. QQQ is a concentrated bet on the tech-and-growth segment of the US market. When mega-cap tech leads (low rates, AI optimism, multiple expansion), QQQ wins big. When mega-cap tech reverses (rate shocks, inflation concerns, growth-to-value rotation), QQQ loses worse than the broader market. The 285-point outperformance is real, but it's not a steady drip. It's a few big leaps separated by drawdowns that are harder to sit through than SPY's.
How Much of QQQ Is Just Concentrated S&P 500?
The correlation chart between QQQ and SPY over the full decade tells a quiet but important story.
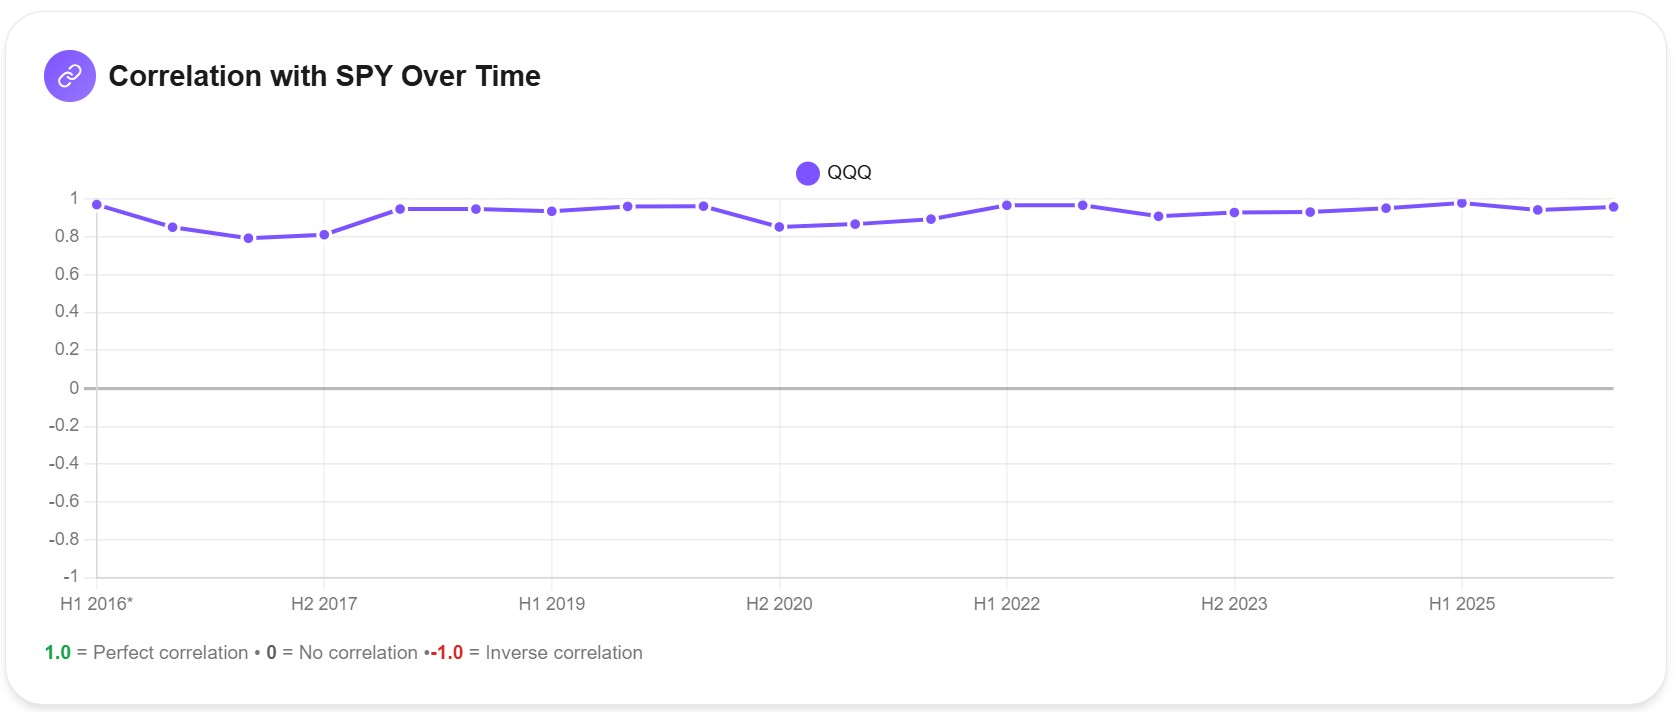
QQQ's correlation with SPY ranges from about 0.80 to 0.97 across the decade. It never drops below 0.79. In the most recent two years it sits consistently above 0.93, meaning QQQ and SPY move together more than 93% of the time on a daily basis.
This matters for anyone holding both. If your portfolio is 60% VOO and 40% QQQ thinking you've diversified across "broad US" and "tech," the correlation chart says you haven't. You've concentrated. You own the S&P 500 with an extra tilt toward mega-cap tech. The diversification benefit is real but small, and it disappears entirely in stress periods (the correlation in 2022 stayed above 0.90).
I covered this layer of "fake diversification" in detail in What Is Portfolio Diversification? — the short version is that the number of ETFs you own says little about how independently your bets actually move. QQQ + VOO is mostly the same bet, twice.
What's Actually Inside QQQ
The sector breakdown explains where the volatility and the outperformance both come from.
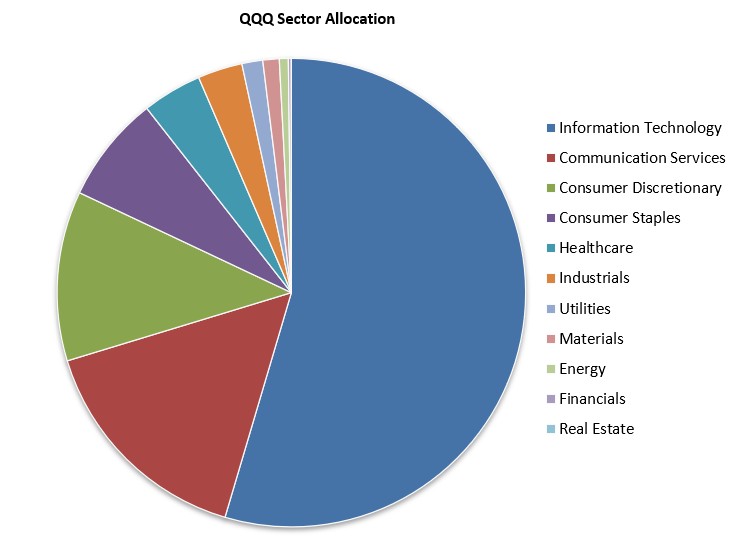
Information Technology occupies more than half the fund. Add Communication Services (mostly Alphabet, Meta, and Netflix — tech-adjacent businesses) and Consumer Discretionary (heavily weighted toward Amazon and Tesla), and you're looking at roughly 85% of QQQ being some flavor of tech. Healthcare, Industrials, and Consumer Staples each get a small slice. Financials, Energy, and Real Estate are nearly absent.
This is what people mean when they call QQQ a "tech fund." It's technically the Nasdaq-100, but the Nasdaq-100 is heavily tilted toward the same handful of mega-cap names that dominate every index, just at higher weights. Apple, Microsoft, Nvidia, Alphabet, Amazon, Meta and a few others account for a majority of the fund's value.
That concentration is why QQQ outperformed in the AI rally, and why it collapsed in 2022 when rates rose and growth multiples compressed. It's the same handful of stocks doing the heavy lifting in both directions.
Can You Expect the Next 10 Years to Look Like This?
This is the section most similar articles skip. I think it's the most important one.
QQQ historical returns over the last decade clocked in at 21.54% annualized, well above the long-term historical average of the Nasdaq-100, which sits closer to 13-14% per year over multi-decade windows including major crashes (2000-2002 dot-com, 2008 financial crisis). The 2016-2026 decade missed both of those. It was bookended by ultra-low interest rates, massive tech profitability, and the AI rally that pushed mega-cap valuations to record highs.
Plug a more conservative 13% CAGR assumption into the same $10,000 starting balance for the next 10 years, and the math is very different. Your money grows to about $33,900, not $70,000. Still excellent — more than tripling your capital — but roughly half of what the past decade delivered.
A 15% assumption produces about $40,500. A more pessimistic 10% (closer to broad-market long-term) produces about $25,900. The honest range is somewhere between $26,000 and $40,000 if the next decade looks like a normal Nasdaq-100 environment rather than the exceptional one we've just lived through.
None of this means "don't invest in QQQ." Tech concentration is a real strategic choice, and the long-term direction has favored it. It just means treating the last ten years as information, not forecast. The path to any future $70,000 outcome will likely include at least one year worse than 2022, at least one stretch of multi-year underperformance against the broad market, and at least one moment where holding will feel impossible.
I aim for at least 20 years of data when I can get it, precisely because of this. Single-decade snapshots mislead in both directions. The 2000s for the Nasdaq-100 were catastrophic. The 2010s and 2020s so far have been exceptional. Your horizon matters more than the window you're staring at today.
Run Your Own
The data in this article came from Awalyt's backtest engine running on daily-precision data, the same 2,511 points shown in every chart above. If you want to test a different amount ($5,000, $50,000, $100,000), a different start date, or a different ETF entirely, you can run your own backtest with the same level of detail.
Free Resource
QQQ — Complete ETF Profile Report
Overview, sector allocation, and top 50 holdings breakdown. The same Excel used to source the data in this article.
Download the Report →No account required — just your email.
Key Takeaways
- $10,000 invested in QQQ on May 11, 2016 is worth $70,138 today. A total return of +601.38% at a CAGR of 21.54%, beating SPY by 285 percentage points over the same window.
- The ride was not smooth. 2022 lost 33% of the value, with a max drawdown of −34.83% inside the year and no V-shaped bounce. The year before, 2021, had ended near $50,000. By October 2022, the balance was around $33,000.
- 2020 was the second-most extreme year. It closed at +46.18% despite a -28.56% mid-year drawdown. Volatility hit 35.67%. The COVID crash was sharper than 2022 but recovered within months.
- QQQ's correlation with SPY stays between 0.80 and 0.97 across the decade. Owning both QQQ and VOO is mostly the same bet held twice, not real diversification.
- The Nasdaq-100 is roughly 85% tech and tech-adjacent. Information Technology alone occupies more than half the fund. That concentration is the source of both the outperformance and the volatility.
- The last decade ran well above the Nasdaq-100's long-term average of 13-14%. A more conservative forward assumption produces roughly $34,000 on the same starting balance instead of $70,000. Still excellent, but half of the past decade.
The number at the top of this article is real. Whether it repeats over the next ten years depends on whether the regime that produced it continues — low rates, megacap tech leadership, AI-driven multiple expansion. That's a separate question, and probably the more important one.
This article is for educational and informational purposes only. It does not constitute financial, investment, or tax advice. Past performance does not guarantee future results. Always do your own research and consider consulting a qualified financial advisor before making investment decisions.
Want to test these insights on your own portfolios?
Awalyt is a portfolio analysis platform: backtesting on daily data, fundamental analysis, asset analysis, and AI-powered insights.
Get Started Free