If You Invested $10,000 in VOO 10 Years Ago, Here's What You'd Have Today [2026]
Ten years ago, on April 23, 2016, $10,000 invested in VOO would be worth $40,067 today. That's the headline number. It's the one everyone writes about.
What nobody shows you is the ride. A 34% crash in five weeks. A full year where your balance went backwards. Four separate moments across the decade where selling would have felt like the smart move.
This article shows both. Daily data, every year, the worst moments and the best. All backed by 2,514 daily data points spanning April 23, 2016 to April 22, 2026.
Disclaimer: This article is for educational and informational purposes only. It does not constitute investment advice. Past performance does not guarantee future results. Always do your own research before making any investment decisions.
The Headline Number
Here's what $10,000 invested in VOO on April 23, 2016 did over the next decade, with dividends reinvested and nothing else touched.
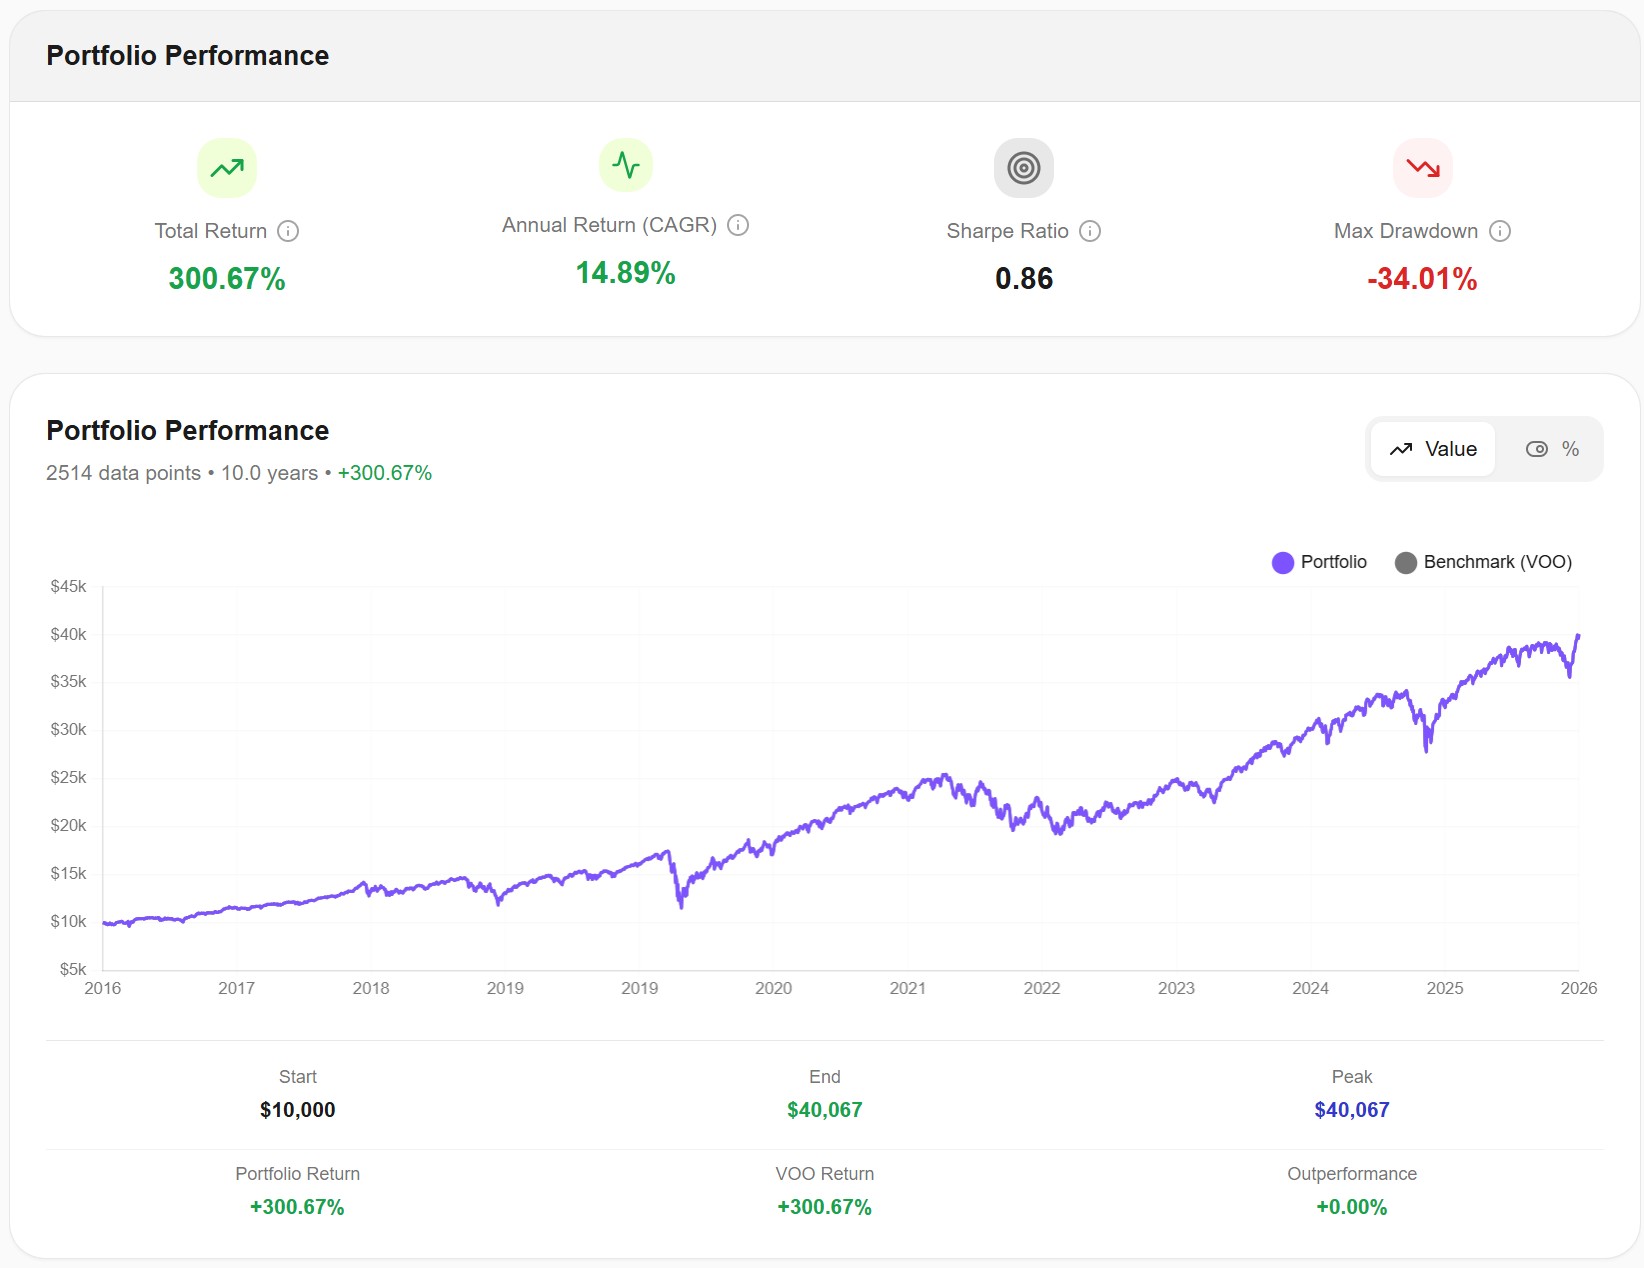
| Metric | Value |
|---|---|
| Start date | April 23, 2016 |
| End date | April 22, 2026 |
| Initial investment | $10,000 |
| Final value | $40,067 |
| Total return | +300.67% |
| Annualized return (CAGR) | 14.89% |
| Max drawdown | −34.01% |
| Sharpe ratio | 0.86 |
| Daily data points used | 2,514 |
Your money roughly quadrupled. At 14.89% CAGR, this decade ran well above the long-term S&P 500 average of roughly 10% per year. Keep that gap in mind. We'll come back to it.
Compared to SPY (the oldest and most traded S&P 500 ETF), VOO returned 301.32% against SPY's 299.30% over the same window. A gap of roughly two percentage points across ten years, almost entirely the result of the expense ratio difference (0.03% vs 0.09%). If you're weighing one against the other, I covered the structural reasons in detail in SPY vs VOO vs IVV.
The Curve Tells the Real Story
Look at the growth chart above again, but pay attention to the shape of the line rather than the endpoints.
From 2016 to late 2019, the curve is almost boring. Steady upward drift, occasional small dips, nothing dramatic. Then comes March 2020, the vertical drop where the line falls off a cliff in a matter of weeks. The recovery is just as fast, and by late 2020 the curve is back above its pre-crash level. A second, slower correction in 2022 pulls the line down about 25% over the course of the year, followed by another recovery. The final stretch of 2024 and most of 2025 is the cleanest bull run of the decade, with a small dip right at the end.
This is what 2,514 daily data points look like. Most free backtest tools online use monthly data, 120 data points total for this same 10-year period. On a monthly chart, that March 2020 cliff looks like a soft dip. The worst single trading week of the decade barely shows up. You'd read "−20% drawdown in Q1 2020" and nod along, when the real intra-month low was −34%.
This is one of the reasons I built Awalyt's backtest engine on daily data from day one. Monthly averaging smooths the worst moments of every crisis, and the worst moments are usually when you'd have been tempted to sell.
The Emotional Path — Best and Worst Years
The headline 14.89% CAGR hides a journey that looked nothing like a 14.89% straight line. Here's what each year returned.
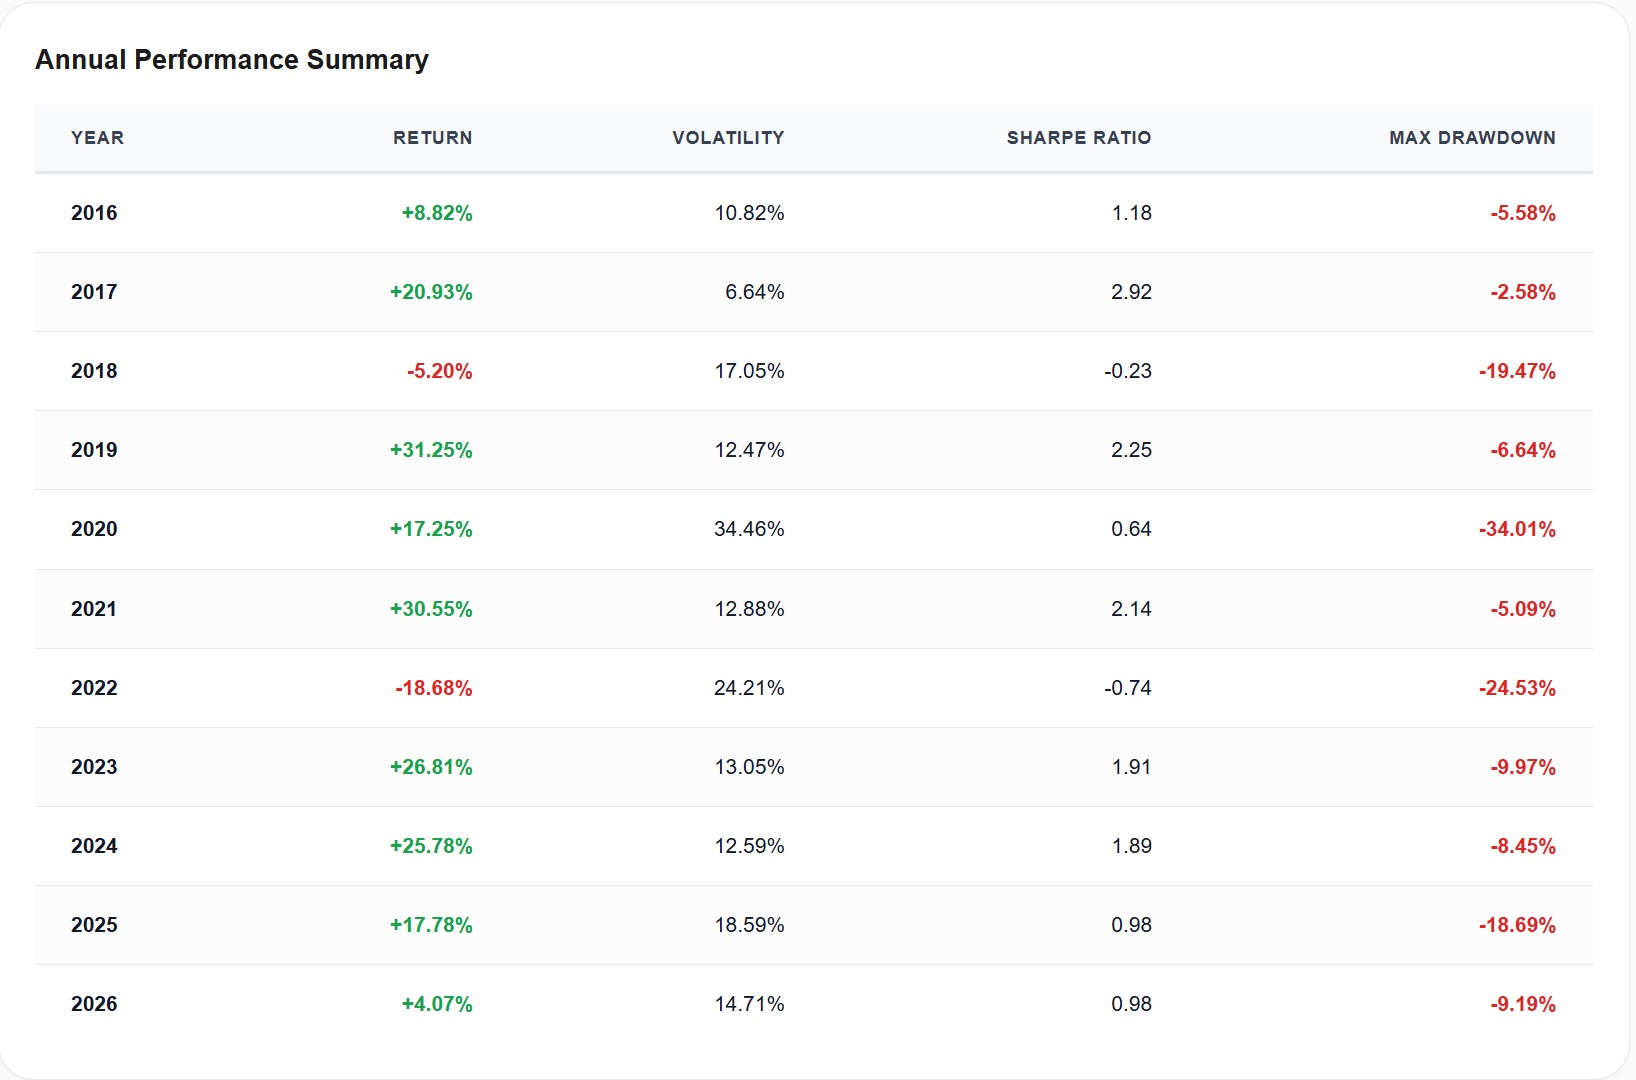
Three years closed red: 2018, 2022, and year-to-date 2026. Four years returned over 25%: 2019, 2021, 2023, 2024. And then there's 2020, the strangest year in the table.
Look at 2020 carefully. The year ended at +17.25%, which would sound like a normal-to-good year. But look at the volatility column: 34.46%, nearly triple the 12% baseline of a calm year. And the max drawdown column: −34.01% inside that same year. The worst drawdown of the entire decade happened during a year that ultimately closed green.
If you had only looked at your account on December 31, 2020, you would have seen a pleasantly green number and moved on. If you had been logging in daily, late March 2020 was probably the hardest moment of the decade to not sell. Your $10,000 starting balance would have been sitting at roughly $12,700 by mid-February, then dropped to around $8,400 by late March. A 34% collapse from peak in about five weeks. The recovery began almost immediately, but nobody knew that in real time.
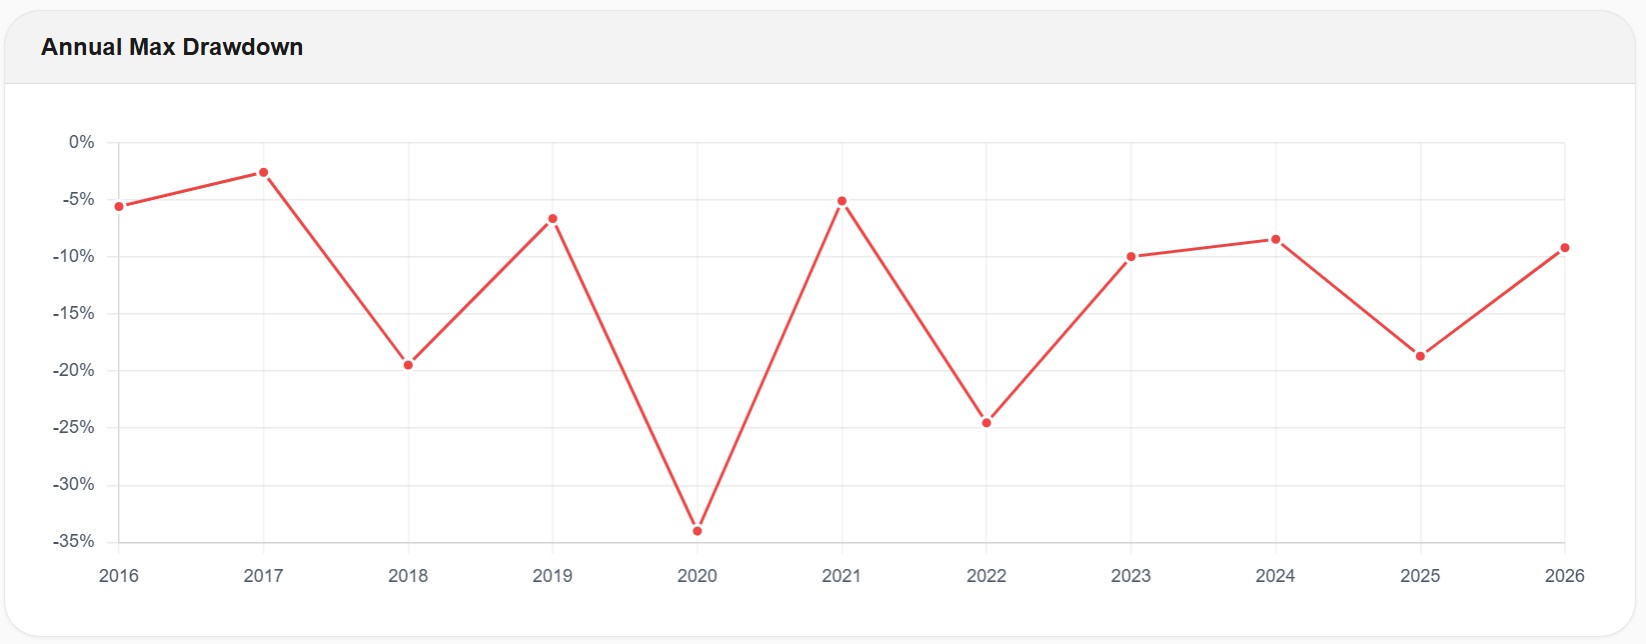
The annual max drawdown chart makes the pattern clear. Even in the good years, VOO dropped 5 to 10% at some point. The calmest year was 2017, with a worst-case dip of only 2.58%. Every other year tested you at least once. 2018, 2020, 2022, and 2025 all had drawdowns of 18% or worse. Four separate stomach-turning moments across a decade.
This is the reality check I run for myself before any serious allocation decision. Not the CAGR. The drawdown chart.
The 12-Month Rolling View — When Things Looked Worst
Annual returns tell you what happened between January 1 and December 31. But that's an arbitrary window. What if you had invested in April 2019, not January 1, 2020? Here's what your rolling 12-month return would have looked like throughout the decade.
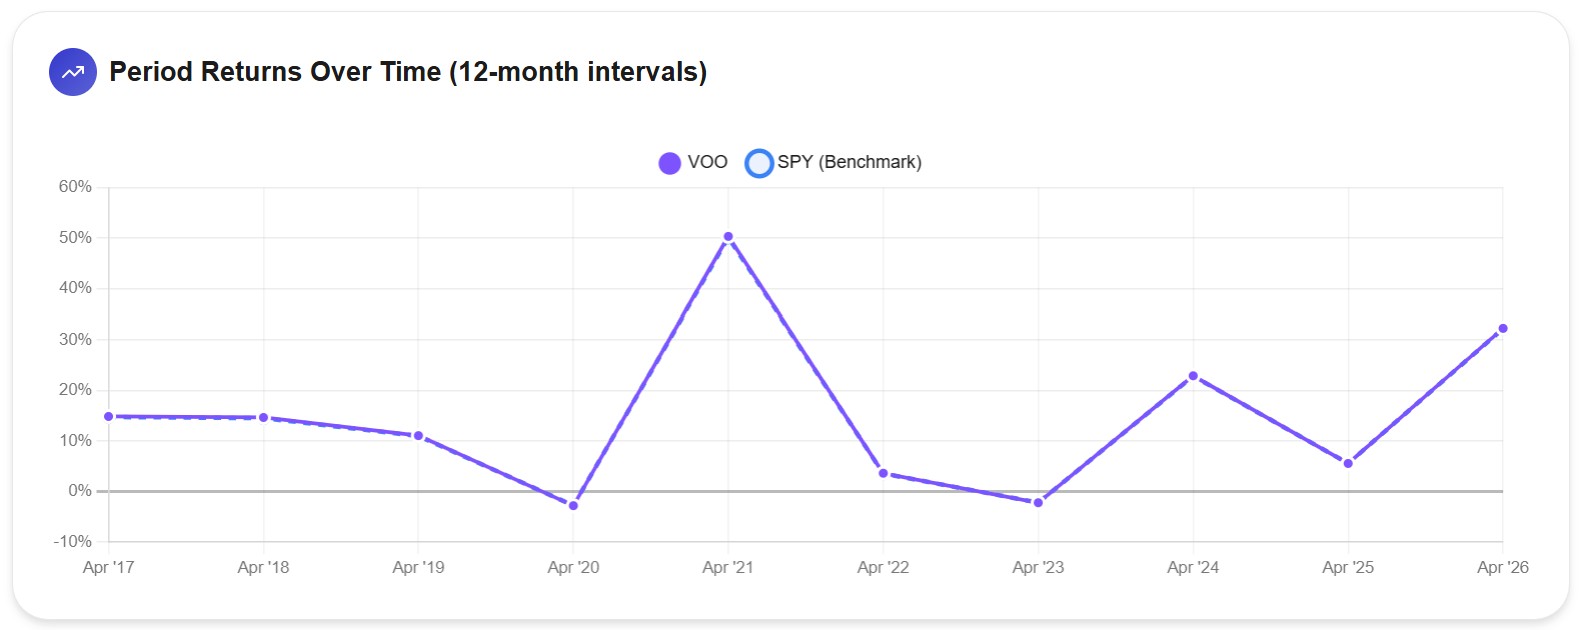
Every point on this chart is the trailing 12-month return as of that date. Follow it left to right.
The early years (Apr 2017 to Apr 2019) cruised around +14 to 15%, exactly what you'd expect from a boring healthy market. Then something strange happens. April 2020: trailing 12-month return of approximately −3%. If you had invested $10,000 in April 2019 and opened your statement in April 2020, you'd have seen your balance sitting at roughly $9,700. A full year in the market, and you were slightly behind where you started.
Then the mirror image. April 2021: trailing 12-month return of roughly +50%. Investors who held through the March 2020 bottom and bought nothing more still saw their money grow 50% in the following twelve months, purely from recovery.
The 2022 bear market pulled the rolling return back down into negative territory (April 2023: approximately −2%), followed by a slow climb and then strong gains in 2024 and 2025.
Your 10-year CAGR is a clean 14.89%. The 12-month rolling return during the same period swung from −3% to +50%. Pick the wrong 12-month window to judge your investment and you'd have concluded very different things about the exact same ETF.
Volatility Over Time — The Rhythm of Risk
If the drawdown chart shows how far your portfolio could fall in a given year, the volatility chart shows how jumpy the ride was throughout.
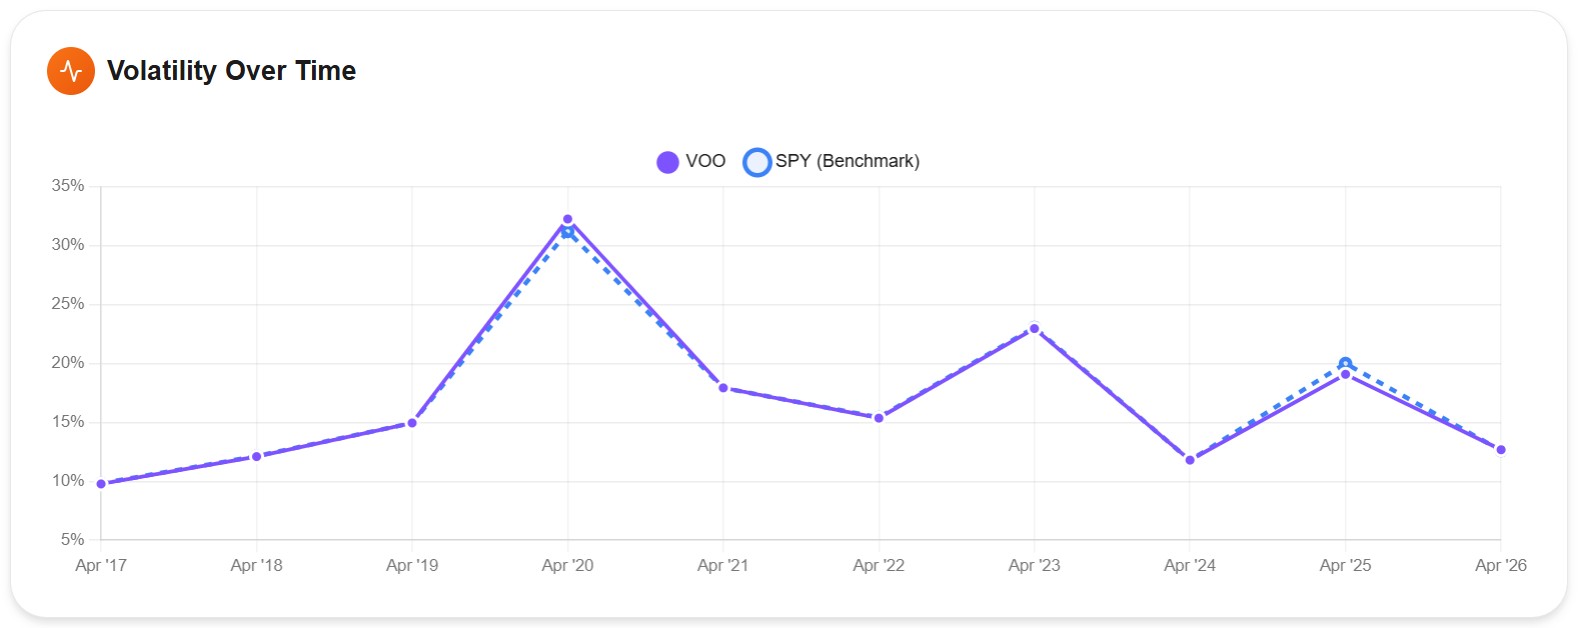
In calm markets, VOO's realized volatility runs at roughly 10 to 15%. That's the baseline. Then the exceptions: a sharp spike to 32% in April 2020 at the peak of the COVID shock, a secondary rise to around 23% during the 2022 bear market, and a smaller bump in early 2025. Each spike lines up with a moment where the headlines were loud and people were questioning whether to stay invested.
Here's what matters about that 32% April 2020 spike. The number is realized daily volatility. On a tool using monthly data, the same period would report a volatility of maybe 16 to 18%, roughly half the reality. The spike would exist in the chart but it would be flattened, smoothed by month-end averaging. If you were evaluating VOO's risk profile from a monthly-data backtest, you'd genuinely think it was less risky than it was.
Monthly data systematically makes portfolios look safer than they were. That's the pattern. And safer-looking in hindsight is useless if the daily experience is what determines whether you hold or sell.
Can You Expect the Next 10 Years to Look Like This?
This is the section most similar articles skip. I think it's the most important one.
The 14.89% annualized return VOO delivered over the last decade is well above the long-term historical average of the S&P 500, which sits closer to 10% per year over multi-decade windows. Several structural tailwinds helped this specific decade. Historically low interest rates for most of the period. The unprecedented run of mega-cap tech profitability. Massive multiple expansion driven in part by passive inflows themselves.
Plug a more conservative 10% CAGR assumption into the same $10,000 starting balance for the next 10 years, and the math looks very different. Your money grows to about $25,900, not $40,000. Still excellent, still more than doubling your capital, but roughly a third less than the past decade delivered.
None of this means "don't invest in VOO." The case for broad US index exposure over long horizons is as robust as any in finance. It just means treating the last ten years as information, not forecast. The path to any future $40,000 outcome will likely include at least one scary drawdown, at least one year where your rolling return is negative, and at least one moment where selling will feel like the smart thing to do.
I aim for at least 20 years of data when I can get it, precisely because of this. Single-decade snapshots mislead in both directions. The 2000s for US equities were brutal. The 2010s and 2020s so far have been exceptional. Your horizon matters more than the window you're staring at today.
Run Your Own
The data in this article came from Awalyt's backtest engine running on daily-precision data, the same 2,514 points per ETF shown in every chart above. If you want to test a different amount ($5,000, $50,000, $100,000), a different start date, or a different ETF entirely, you can run your own backtest with the same level of detail.
Free Resource
VOO — Complete ETF Profile Report
Overview, sector allocation, and top 50 holdings breakdown. The same Excel used to source the data in this article.
Download the Report →No account required — just your email.
Key Takeaways
- $10,000 invested in VOO on April 23, 2016 is worth $40,067 today. A total return of +300.67% at a CAGR of 14.89%.
- The ride wasn't smooth. Three years closed negative, and the worst intra-year drawdown hit −34.01% during the 2020 COVID crash.
- 2020 is the most instructive year of the decade. It ended at +17.25% despite a 34% mid-year collapse. Year-end numbers hide what actually happened in March of that year.
- The 12-month rolling return swung from roughly −3% to +50% during the period. Averages are not experiences.
- The last decade ran well above the long-term S&P 500 average of 10%. A more conservative forward-looking assumption produces roughly $25,900 on the same starting balance. Still excellent, but meaningfully less.
The number at the top of this article is real. Whether it's repeatable over the next ten years is a separate question, and probably the more important one.
This article is for educational and informational purposes only. It does not constitute financial, investment, or tax advice. Past performance does not guarantee future results. Always do your own research and consider consulting a qualified financial advisor before making investment decisions.
Want to test these insights on your own portfolios?
Awalyt is a portfolio analysis platform: backtesting on daily data, fundamental analysis, asset analysis, and AI-powered insights.
Get Started FreeRelated Insights
If You Invested $10,000 in QQQ 10 Years Ago, Here's What You'd Have Today [2026]
10 min read
VOO vs SPMO: Should You Trade the S&P 500 for Its Momentum Version? [2026]
13 min read
VOO vs QQQ: Which Should You Buy? [2026 Data + Overlap Analysis]
11 min read