VOO vs VTI: What's the Actual Difference? [2026 Comparison]
If you've spent any time on investing forums, you've seen this debate. VOO or VTI? S&P 500 or Total Market? It's one of the most asked questions in retail investing — and most answers you'll find are either vague ("it depends on your goals") or misleading ("VTI is more diversified, so it's better").
Let's settle this with actual data. We pulled 15 years of daily performance, full holdings data, and sector breakdowns for both ETFs to show you exactly what's different, what's the same, and when the choice actually matters.
What Each ETF Tracks
VOO (Vanguard S&P 500 ETF) tracks the S&P 500 Index — the 500 largest publicly traded US companies, selected by a committee at S&P Dow Jones Indices. It's the most recognized benchmark in investing.
VTI (Vanguard Total Stock Market ETF) tracks the CRSP US Total Market Index — essentially every investable US stock, from mega-caps like Apple and NVIDIA all the way down to micro-caps you've never heard of.
Here's the profile comparison:
| Metric | VOO | VTI |
|---|---|---|
| Index | S&P 500 | CRSP US Total Market |
| Number of Holdings | 518 | 2,494 |
| Net Assets (AUM) | $1.50T | $2.10T |
| Expense Ratio | 0.03% | 0.03% |
| Portfolio Turnover | 2.00% | 3.00% |
| Dividend Yield | 1.08% | 1.08% |
| Inception Date | Sep 2010 | May 2001 |
The numbers tell the first part of the story. Same expense ratio, same dividend yield, same manager (Vanguard). The structural difference is entirely in scope: VOO holds 518 stocks, VTI holds 2,494. That's roughly 2,000 additional small and mid-cap companies in VTI that VOO doesn't touch.
The 80% Overlap Problem
Here's what most comparisons don't emphasize enough: VTI and VOO share roughly 80% of their total portfolio weight in the same stocks.
The S&P 500 companies that make up VOO are also the largest holdings in VTI — they're just a smaller slice of a bigger pie. Look at the top 10 holdings side by side:
| # | VOO | Weight | VTI | Weight |
|---|---|---|---|---|
| 1 | NVIDIA | 7.83% | Apple | 6.29% |
| 2 | Apple | 6.46% | NVIDIA | 6.21% |
| 3 | Microsoft | 5.39% | Microsoft | 5.56% |
| 4 | Amazon | 3.92% | Amazon | 3.40% |
| 5 | Alphabet (A) | 3.31% | Broadcom | 2.88% |
| 6 | Alphabet (C) | 2.65% | Alphabet (A) | 2.83% |
| 7 | Broadcom | 2.64% | Alphabet (C) | 2.25% |
| 8 | Meta | 2.63% | Meta | 2.14% |
| 9 | Tesla | 2.04% | Tesla | 1.79% |
| 10 | Berkshire Hathaway | 1.49% | Berkshire Hathaway | 1.40% |
Same 10 companies. Same order (with minor shuffling). The difference is concentration: VOO's top 10 represent 38.4% of the fund, while VTI's top 10 represent 34.8%. VTI is slightly less top-heavy because those 2,000 extra stocks dilute the mega-cap weight — but only by about 3.6 percentage points.
The top 50 holdings tell a similar story: 61.8% of VOO vs 55.0% of VTI. The diversification benefit of VTI is real, but it's more modest than the "518 vs 2,494 holdings" headline suggests.
Sector Allocation: Nearly Identical
If the holdings overlap didn't convince you, the sector breakdown will.
| Sector | VOO | VTI |
|---|---|---|
| Information Technology | 33.1% | 31.8% |
| Financials | 11.2% | 11.1% |
| Communication Services | 11.0% | 9.8% |
| Consumer Discretionary | 10.6% | 10.1% |
| Healthcare | 9.5% | 10.0% |
| Industrials | 8.6% | 9.1% |
| Consumer Staples | 5.0% | 4.4% |
| Energy | 3.2% | 2.9% |
| Utilities | 2.3% | 2.3% |
| Materials | 1.9% | 1.9% |
The largest sector difference is Information Technology: 33.1% in VOO vs 31.8% in VTI — a gap of just 1.3 percentage points. Every other sector is within 1% or less. VTI has slightly more Industrials and Healthcare exposure (where small and mid-cap companies are more common), but we're talking about fractions of a percent.
Buying VTI instead of VOO does not meaningfully change your sector exposure.
15 Years of Performance: The Data
Now for the numbers everyone actually wants to see. We backtested VOO and VTI from March 2011 to March 2026 using daily-precision data, with SPY as the benchmark.
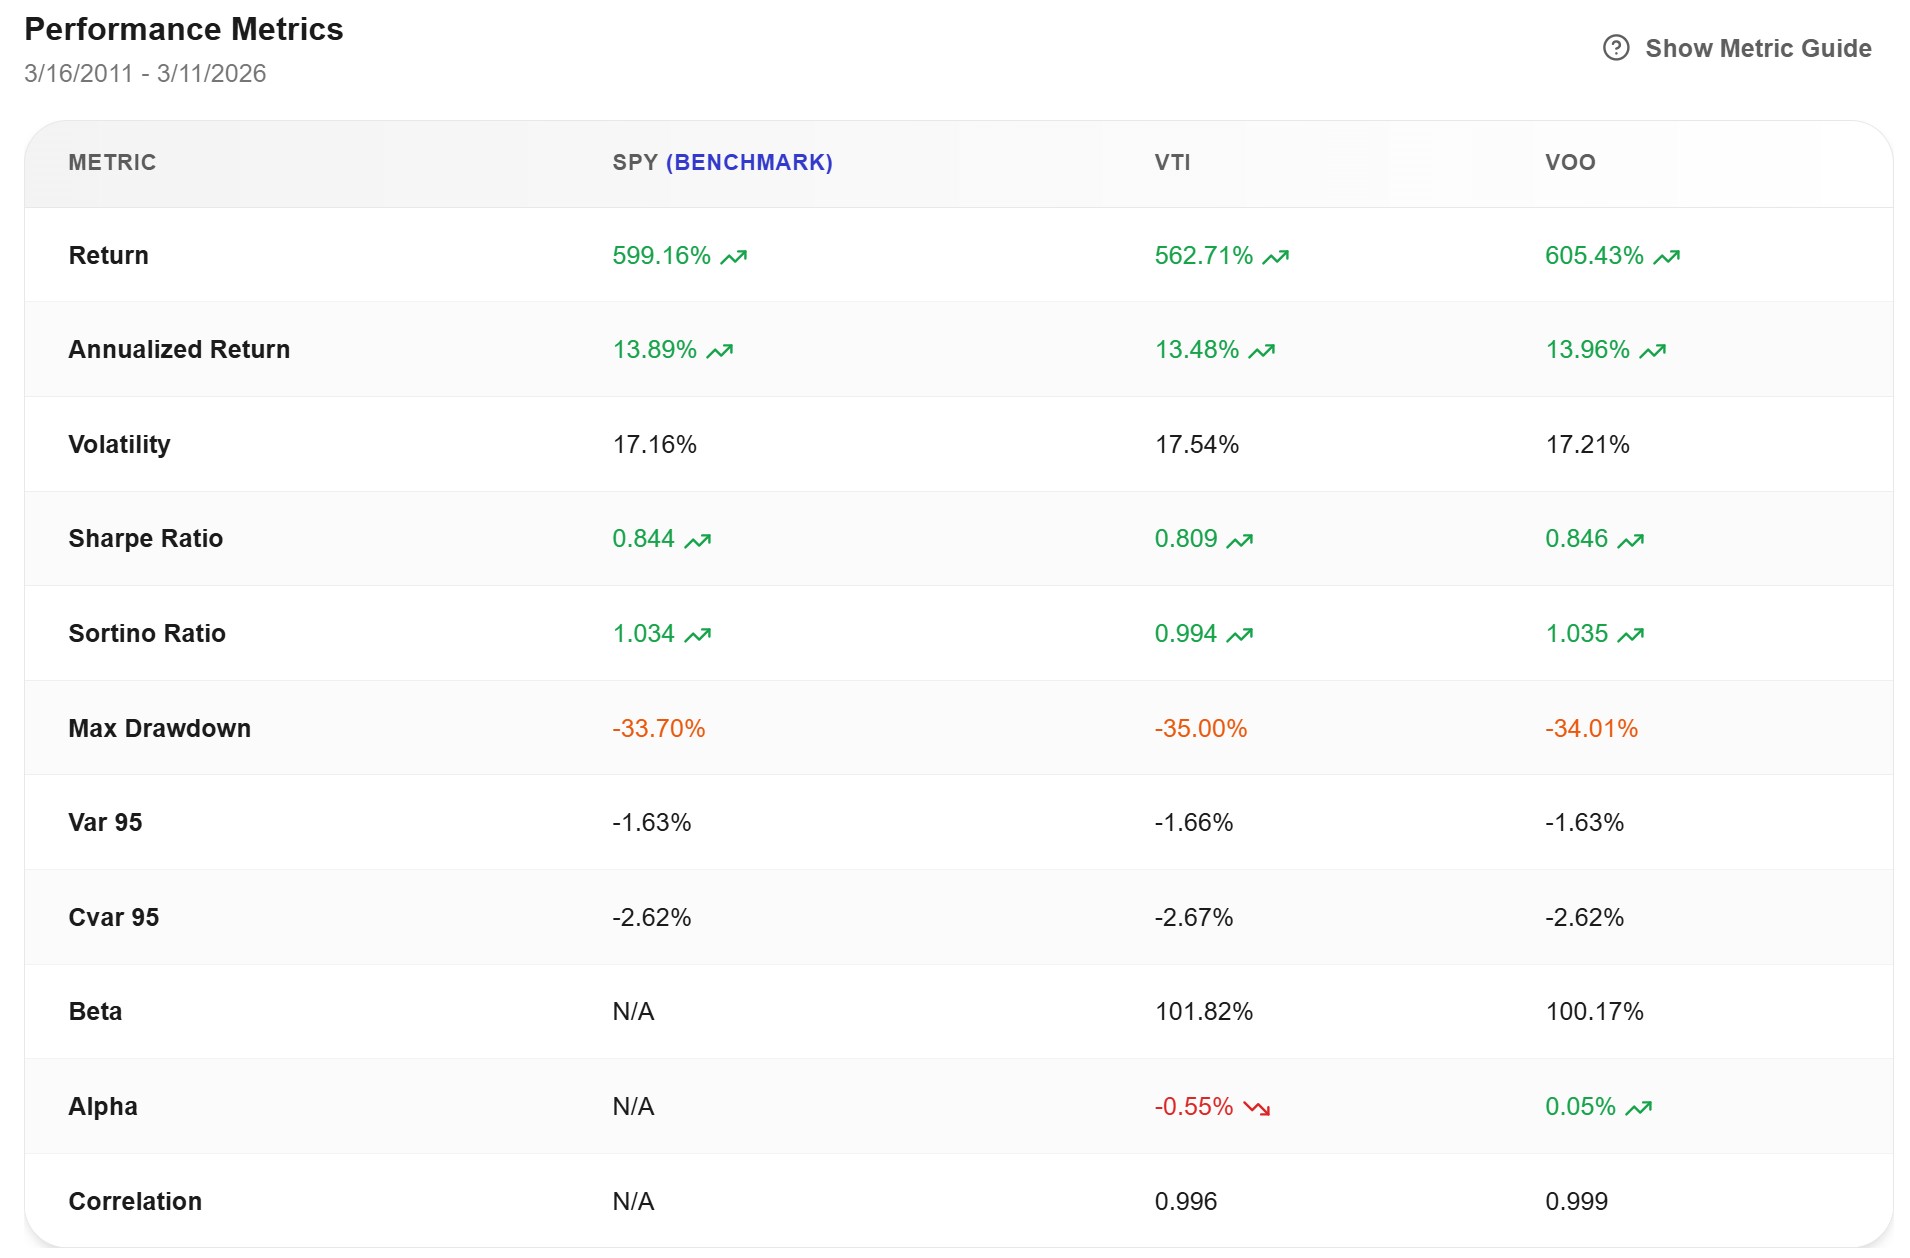
Here are the key numbers:
| Metric | VOO | VTI | Difference |
|---|---|---|---|
| Total Return | 605.43% | 562.71% | +42.72% |
| Annualized Return | 13.96% | 13.48% | +0.48% |
| Volatility | 17.21% | 17.54% | −0.33% |
| Sharpe Ratio | 0.846 | 0.809 | +0.037 |
| Sortino Ratio | 1.035 | 0.994 | +0.041 |
| Max Drawdown | −34.01% | −35.00% | +0.99% |
| Correlation to SPY | 0.999 | 0.996 | — |
VOO outperformed VTI by about 0.48% per year over this 15-year period. That might sound small, but compounded over 15 years it adds up to a 42-point gap in total return. VOO also had slightly lower volatility, a better Sharpe ratio, and a shallower maximum drawdown.
The correlation between the two? 0.996. For practical purposes, they move in lockstep.
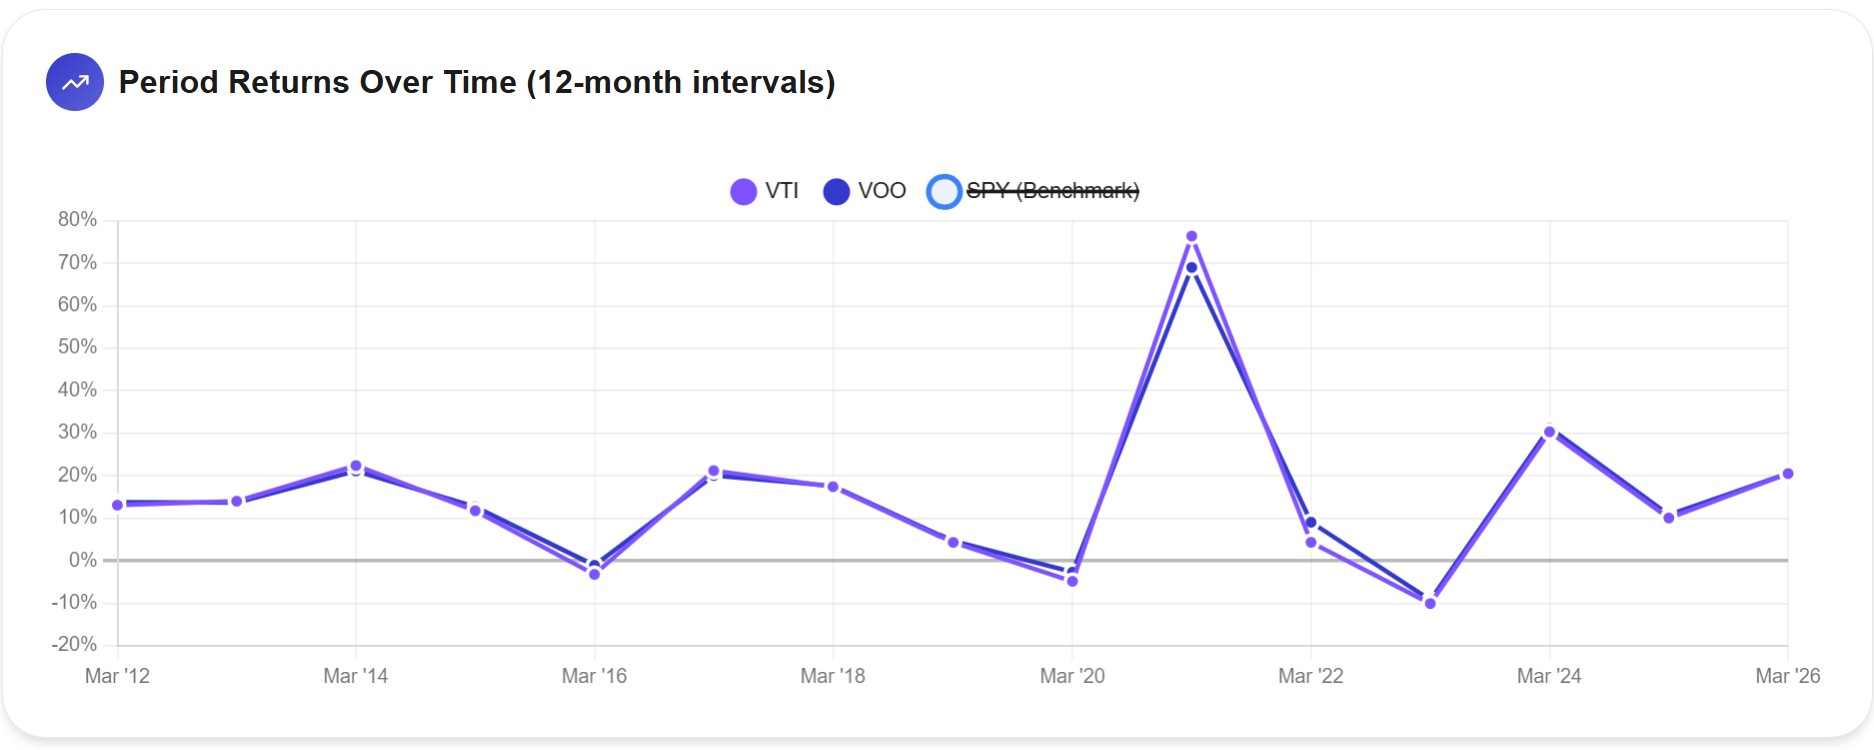
The yearly returns chart makes the correlation visible. The two lines are practically stacked on top of each other across the entire 15-year window. The only moments where you can spot a gap are around 2021 (when small caps briefly outperformed during the post-COVID recovery) and 2022–2023 (when large-cap tech pulled ahead again).
📄 Free resource — Full Excel with holdings, sectors & performance data
Download Report →Why VOO Has Won — So Far
VTI's slight underperformance isn't a flaw in the fund. It's a reflection of what happened in markets over the last 15 years.
This period was dominated by mega-cap technology stocks — Apple, Microsoft, NVIDIA, Amazon, Alphabet, Meta. These companies drove the bulk of S&P 500 returns. Since VOO is 100% large and mega-cap, it captured every bit of that rally. VTI also holds these stocks, but their weight is diluted by the ~2,000 smaller companies that, as a group, underperformed large caps during this period.
VTI's alpha relative to the S&P 500 benchmark is −0.55%, while VOO sits at +0.05%. The small and mid-cap exposure that makes VTI "more diversified" actually dragged returns down in a market cycle that rewarded size and scale.
But here's the important nuance: this isn't a permanent condition. Market leadership rotates. From 2000 to 2010, small-cap and value stocks significantly outperformed large-cap growth. In a different cycle, VTI's broader exposure could be the advantage, not the drag.
The data tells you what happened. It doesn't guarantee what will happen next.
When One Makes More Sense Than the Other
Given the data, here's a practical framework:
VOO might be the better fit if:
You want pure large-cap US exposure with the tightest possible tracking to the S&P 500 benchmark. You're building a portfolio where you'll add small-cap exposure separately through a dedicated fund (like VB or AVUV) to control the exact allocation. Or you simply want the most recognized, liquid, and widely benchmarked US equity ETF.
VTI might be the better fit if:
You want a single-fund solution for all US equities and don't want to manage multiple ETF positions. You believe small and mid-cap stocks will have stronger relative performance going forward and want that exposure built in. Or you prefer the philosophical simplicity of "owning the entire US stock market" in one ticker.
When the choice genuinely doesn't matter:
If you're investing a lump sum into a single US equity ETF and holding for 20+ years, the performance difference between VOO and VTI will likely be small enough that other factors — like consistently investing, keeping costs low, and not panic-selling — will matter far more than which of these two you picked.
Tax Efficiency: A Wash
Both VOO and VTI are among the most tax-efficient ETFs available, thanks to Vanguard's patented heartbeat trade mechanism (which allows ETFs to shed low-cost-basis shares without triggering capital gains distributions).
Neither fund has distributed significant capital gains in recent years. The expense ratios are identical at 0.03%. Dividend yields are identical at 1.08%. From a tax perspective, there is no meaningful difference between the two.
If you're doing tax-aware portfolio analysis — modeling how rebalancing costs and capital gains impact your real after-tax returns — the choice between VOO and VTI won't move the needle. The rebalancing strategy, tax bracket, and holding period matter far more than which of these two funds you hold.
Run Your Own Comparison
The data in this article was generated using Awalyt's backtesting engine with daily-precision historical data. If you want to test VOO vs VTI with different time periods, add other ETFs to the mix, or see how they perform inside a broader portfolio with rebalancing, you can run your own backtest on Awalyt.
Free Resource
VOO vs VTI — Complete Data Report
Holdings breakdown, sector allocation, and 15 years of performance metrics.
Download the Report →No account required — just your email.
The Bottom Line
VOO and VTI are two of the best equity ETFs ever created. They share the same expense ratio, the same dividend yield, the same top holdings, and a 0.996 correlation over 15 years. The structural difference — 518 stocks vs 2,494 — is real but its practical impact has been modest: roughly half a percentage point per year in this market cycle.
If you already own one, there's no compelling reason to switch. If you're choosing for the first time, either one gives you broad, low-cost US equity exposure. The decision is more about portfolio philosophy than performance: do you want pure large-cap, or do you want the full market including small and mid-caps?
What matters more than this choice is that you invest consistently, keep costs low, and have a plan you can stick with through downturns. VOO and VTI are both excellent vehicles for that.
This article is for educational and informational purposes only. It does not constitute financial, investment, or tax advice. Past performance does not guarantee future results. Always do your own research and consider consulting a qualified financial advisor before making investment decisions.
Want to test these insights on your own portfolios?
Awalyt is a portfolio analysis platform: backtesting on daily data, fundamental analysis, asset analysis, and AI-powered insights.
Get Started Free