SPY vs VOO vs IVV: Which S&P 500 ETF Should You Pick? [2026]
"SPY or VOO?" is probably the most Googled question in index fund investing. Add IVV to the mix and you've got three funds that collectively hold over $2.7 trillion in assets, all tracking the exact same index. Millions of investors agonize over this choice every year.
Most answers you'll find online are some version of "they're basically the same, just pick one." That's not wrong, but it's lazy. We ran a 15-year backtest with daily-precision data on all three to show you exactly how similar they are, where the small differences come from, and what should actually drive your decision.
Disclaimer: This article is for educational purposes only and does not constitute financial advice. Past performance does not guarantee future results. Always do your own research before making investment decisions.
Three Funds, One Index
SPY, VOO, and IVV all track the S&P 500 — the 500 largest US publicly traded companies. Same index, same stocks, same weighting methodology. But they're managed by three different companies with slightly different structures.
| Metric | SPY | VOO | IVV |
|---|---|---|---|
| Provider | State Street (SPDR) | Vanguard | BlackRock (iShares) |
| Index | S&P 500 | S&P 500 | S&P 500 |
| Inception | Jan 1993 | Sep 2010 | May 2000 |
| Net Assets | $651.6B | $1.40T | $720.5B |
| Expense Ratio | 0.09% | 0.03% | 0.03% |
| Turnover | 3.0% | 2.0% | 3.0% |
| Dividend Yield | 1.13% | 1.09% | 1.05% |
| Holdings | 504 | 490 | 507 |
The numbers that matter most here are expense ratio and structure. VOO and IVV charge 0.03% per year. SPY charges 0.09% — three times as much. We'll come back to what that costs you over time.
98.8% Identical — The Overlap Data
Before looking at performance, here's the overlap picture. Out of 509 unique stocks across the three funds, 503 are shared. That's 98.8% overlap by holdings count, and 99.6–99.9% by portfolio weight.
The top 10 holdings are the same stocks in nearly the same order:
| # | Stock | SPY | VOO | IVV |
|---|---|---|---|---|
| 1 | NVIDIA | 7.57% | 7.31% | 7.63% |
| 2 | Apple | 6.56% | 6.63% | 6.65% |
| 3 | Microsoft | 4.92% | 4.96% | 4.91% |
| 4 | Amazon | 3.60% | 3.47% | 3.63% |
| 5 | Alphabet (A) | 3.00% | 3.08% | 3.05% |
| 6 | Broadcom | 2.68% | 2.56% | 2.64% |
| 7 | Alphabet (C) | 2.40% | 2.46% | 2.44% |
| 8 | Meta | 2.30% | 2.40% | 2.22% |
| 9 | Tesla | 1.91% | 1.92% | 1.80% |
| 10 | Berkshire Hathaway | 1.56% | 1.57% | 1.55% |
Top 10 concentration is nearly identical too: SPY 36.5%, IVV 36.5%, VOO 36.4%. The small weight differences (tenths of a percent) come from slightly different rebalancing schedules and portfolio management methods, not from different stock selection.
Sector allocation tells the same story. Information Technology dominates all three at 32.2–33.0%, followed by Financials at 10.6–10.8%. The largest sector gap between any two funds is 0.8 percentage points. You'd need a magnifying glass to spot the difference.
📄 Free resource — Full Excel with holdings, sectors & overlap data for SPY, VOO, and IVV
Download Report →15 Years of Performance: The Backtest
We backtested all three ETFs from April 2011 to April 2026 using daily-precision data — 252 trading days per year, roughly 3,780 data points per fund over the full period.
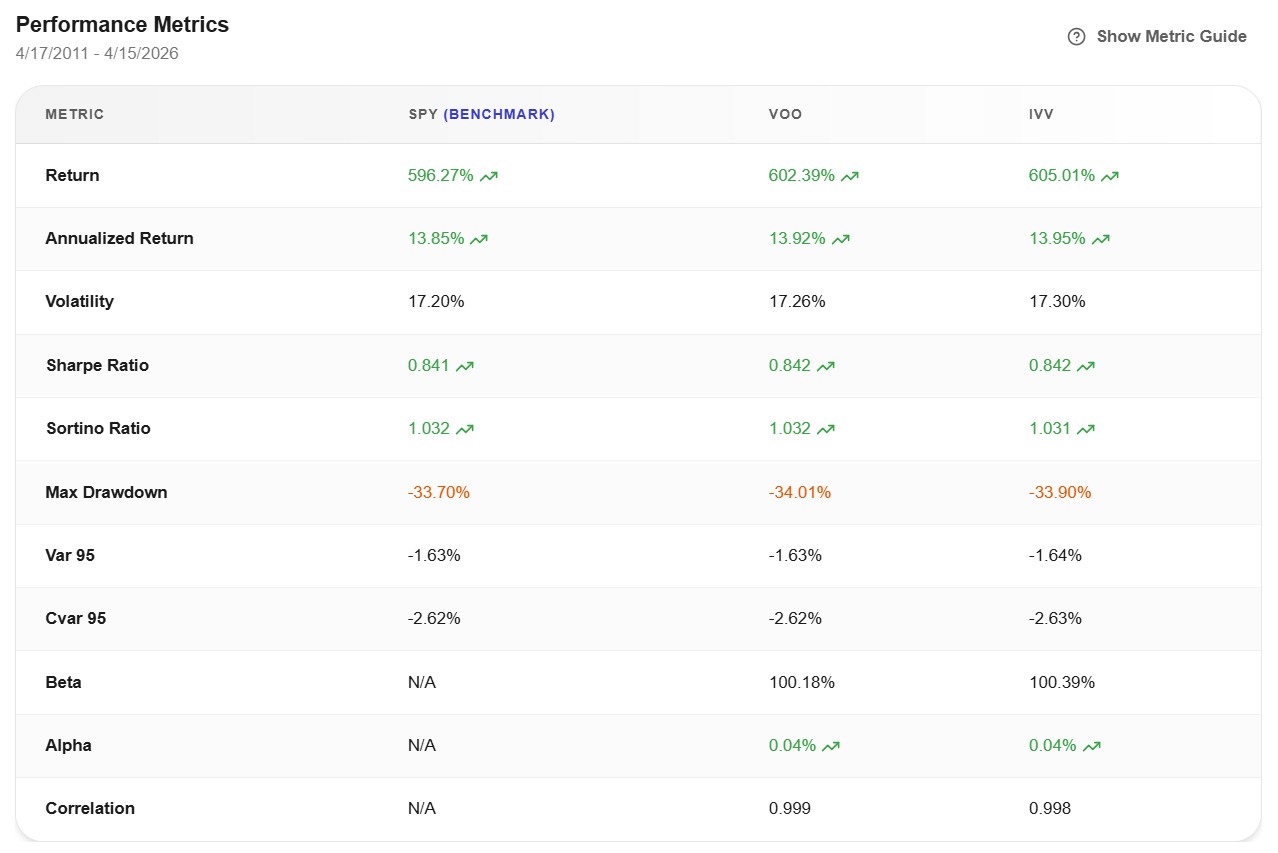
| Metric | SPY | VOO | IVV |
|---|---|---|---|
| Total Return | 596.27% | 602.39% | 605.01% |
| CAGR | 13.85% | 13.92% | 13.95% |
| Volatility | 17.20% | 17.26% | 17.30% |
| Sharpe Ratio | 0.841 | 0.842 | 0.842 |
| Sortino Ratio | 1.032 | 1.032 | 1.031 |
| Max Drawdown | −33.70% | −34.01% | −33.90% |
| VaR 95 | −1.63% | −1.63% | −1.64% |
Read those numbers carefully. The total return spread over fifteen years is 8.74 percentage points — from SPY's 596.27% to IVV's 605.01%. That sounds like a gap until you realize it's compounded over 15 years. In annualized terms, it's 0.10%. A dime for every hundred dollars, every year.
Sharpe ratios? 0.841 vs 0.842. Sortino ratios? 1.032 vs 1.031. Max drawdown? Within 0.31% of each other. These are not meaningfully different numbers. They're rounding noise on functionally identical portfolios.
The Chart That Tells the Whole Story
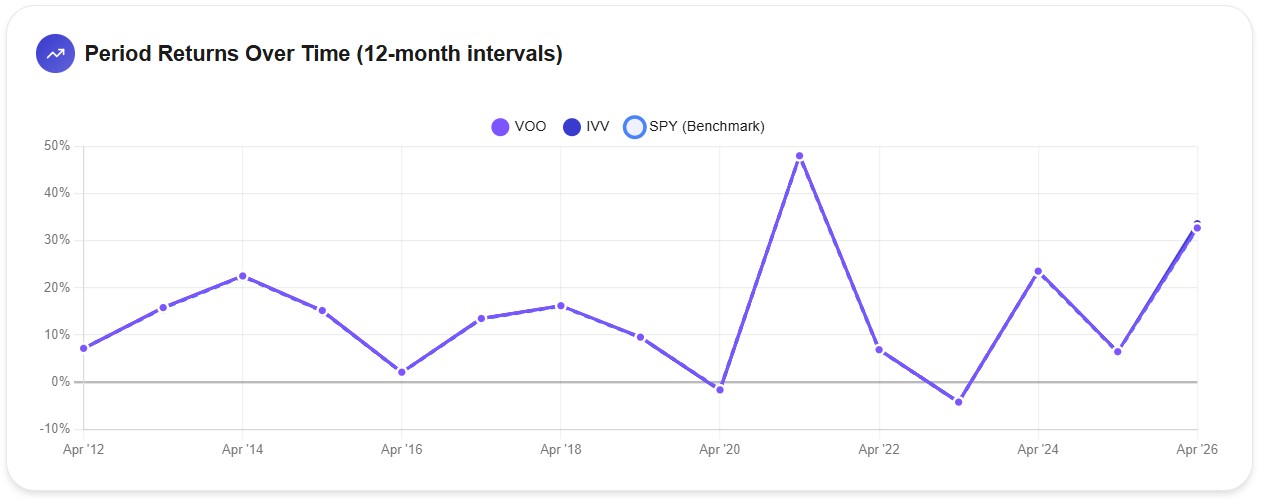
That's a chart of yearly rolling returns for all three ETFs. If you can tell the lines apart, you have better eyes than I do. Through the 2015–2016 correction, the late-2018 sell-off, the COVID crash, the 2022 bear market, and the 2024–2025 recovery — they moved in perfect lockstep every single time.
The correlation data confirms it. VOO's correlation to SPY is 0.999. IVV's is 0.998. For all practical purposes, these are the same investment.
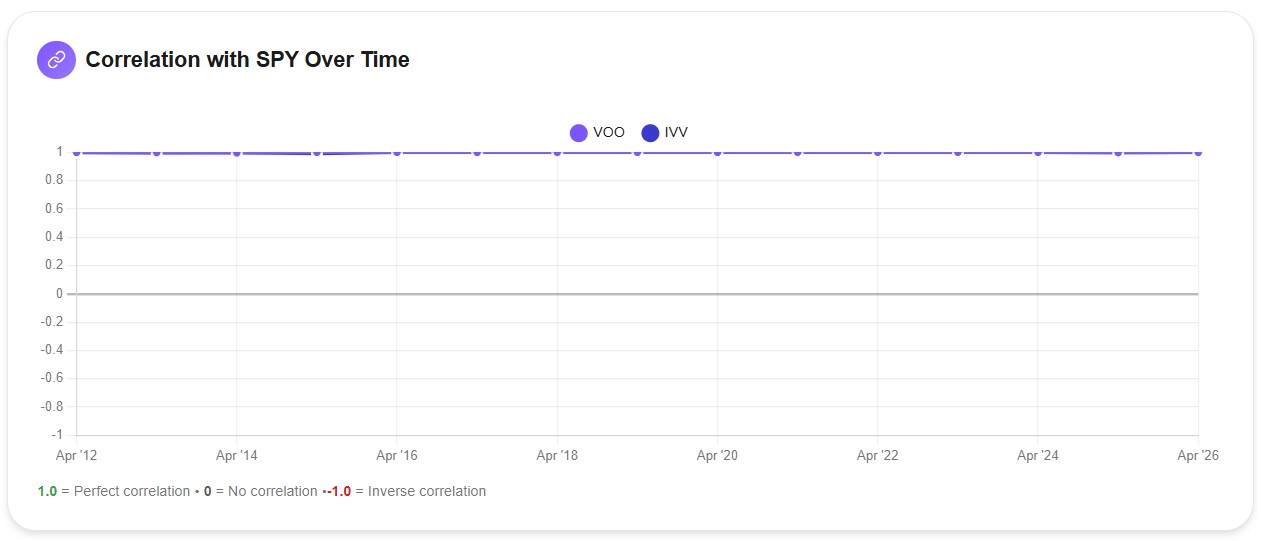
That flat line at 1.0 across 15 years says more than any paragraph I could write. There is no period in market history where choosing one of these over another would have changed your outcome in any meaningful way.
The One Real Difference: Expense Ratio Drag
If the performance gap is 0.10% per year and the expense ratio gap is 0.06%, where does the rest come from?
SPY has a structural disadvantage. It's organized as a Unit Investment Trust (UIT) — a legacy structure from 1993 when it launched as the first-ever US ETF. This means SPY can't reinvest dividends between distribution dates (creating "cash drag"), can't lend securities for extra income, and can't hold non-index securities even temporarily. VOO and IVV are structured as standard open-end ETFs, giving their managers more flexibility.
The combined effect of the higher expense ratio plus structural drag adds up to roughly 0.10% per year. On a $100,000 investment over 15 years, that's approximately $6,000 less in your account with SPY versus VOO or IVV. Not catastrophic, but real.
Here's another way to think about it. You invest $100,000 today. Over the next 15 years, assuming the same returns continue:
| Fund | Final Value | Cost vs Best |
|---|---|---|
| IVV (0.03%) | ~$705,000 | — |
| VOO (0.03%) | ~$702,400 | ~$2,600 |
| SPY (0.09%) | ~$696,300 | ~$8,700 |
The VOO/IVV difference is essentially zero and could flip in either direction depending on the period. The SPY gap is small but consistent — it's a structural cost that compounds quietly.
Volatility: Also Identical
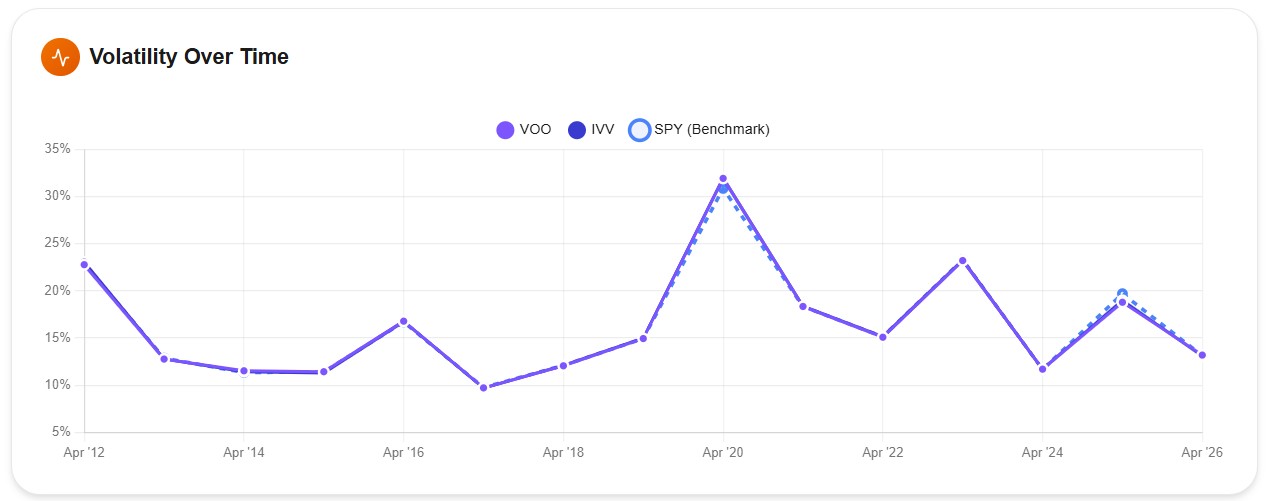
The volatility chart reinforces the same conclusion. All three spiked to ~30–32% during COVID, settled back to ~11% in calm markets, and tracked each other through every regime in between. No fund is "safer" than the others. If you own the S&P 500, you own the same risk regardless of which wrapper you choose.
So Which One Should You Actually Pick?
Since performance won't help you decide, here's a framework based on what actually differs.
Pick VOO if you have a Vanguard brokerage account. Zero commissions, seamless integration, and you're already in Vanguard's ecosystem. It's the largest of the three by AUM ($1.4T), which signals massive investor confidence, and Vanguard's unique ownership structure — the fund company is owned by the funds themselves — means costs tend to stay low permanently.
Pick IVV if you use Fidelity, Schwab, or another non-Vanguard broker. Same 0.03% expense ratio as VOO, same structure, same performance. IVV is also useful for tax-loss harvesting: if you sell VOO at a loss, you can immediately buy IVV (or vice versa) to maintain your S&P 500 exposure without triggering wash sale rules, since they're different funds despite being functionally identical.
Pick SPY if you actively trade options or need maximum intraday liquidity. SPY has the most liquid options market of any ETF in the world — the bid-ask spreads are tighter than anything VOO or IVV can offer. For buy-and-hold investors this doesn't matter, but for options strategies it's a genuine advantage that can outweigh the extra expense ratio.
Pick any of them if you're investing through a 401(k) or employer plan that only offers one. Seriously. The difference between the "best" and "worst" choice here is $6,000 on a $100,000 investment over 15 years. That's $400 per year. Don't let this decision delay you from investing — the cost of sitting in cash while you decide is far higher than picking the "wrong" S&P 500 ETF.
A Note on Data Granularity
One observation from running this comparison. The max drawdown numbers across all three funds landed between −33.70% and −34.01%. These figures capture the actual bottom of the COVID crash in March 2020 — not a month-end approximation.
Tools that use monthly data would show a shallower drawdown for this period because the S&P 500 had already recovered several percent by March 31. Daily data captures the real trough on March 23, 2020. For a comparison like this one, where the funds are nearly identical, the granularity difference doesn't change the conclusion. But for portfolios with different compositions — say, comparing a stock/bond allocation versus pure equities — daily precision matters significantly more.
The Bottom Line
We tested this so you don't have to. SPY, VOO, and IVV delivered within 0.10% per year of each other over 15 years. The correlation is 0.999. The holdings overlap is 98.8%. The sector allocations are within a percentage point across the board.
The right answer for most buy-and-hold investors is VOO or IVV — they're cheaper by 0.06% per year, and that compounds. If you trade options or need the tightest possible spreads for intraday execution, SPY earns its higher fee. Beyond that, pick whichever your broker offers commission-free and move on.
The decision that actually matters isn't which S&P 500 ETF you buy. It's what you pair it with — international exposure, bonds, small caps, alternatives — and how you build the rest of the portfolio around it.
All backtest data shown in this article was generated using Awalyt's daily-granularity backtesting engine with 252 data points per year. Past performance does not guarantee future results. This content is educational and does not constitute financial advice.
Want to test these insights on your own portfolios?
Awalyt is a portfolio analysis platform: backtesting on daily data, fundamental analysis, asset analysis, and AI-powered insights.
Get Started Free