SCHD vs VYM vs VIG: 14-Year Backtest — Which Dividend Strategy Actually Wins?
"Should I buy SCHD, VYM, or VIG?" is one of the most-asked questions on r/dividends, r/Bogleheads, and every investing forum in between. The three ETFs are often mentioned together, but they represent fundamentally different philosophies about dividend investing — and those differences compound dramatically over time.
We ran a 14-year backtest (March 2012 – February 2026) using AWALYT's daily-data backtesting engine, covering 3,528 trading days per ETF. That's roughly 10,500 data points — enough to capture the 2015–2016 correction, the late-2018 drawdown, the March 2020 COVID crash, the 2022 bear market, and the 2023–2025 recovery. More importantly, daily precision reveals the real drawdowns that monthly tools systematically underestimate.
Here's what the data actually shows.
Three Strategies, One Goal
Before diving into the numbers, it's worth understanding what each ETF is actually trying to do. They all pay dividends, but they get there through very different paths.
SCHD (Schwab U.S. Dividend Equity ETF) follows the Dow Jones U.S. Dividend 100 Index. It selects 100 stocks based on four quality metrics: cash flow to debt, return on equity, dividend yield, and 5-year dividend growth rate. The result is a concentrated portfolio that blends current yield (~3.3%) with quality screens. Top sectors include energy (~19%), consumer defensive (~18%), and healthcare (~18%). Expense ratio: 0.06%.
VYM (Vanguard High Dividend Yield ETF) tracks the FTSE High Dividend Yield Index. It takes a simpler approach: rank U.S. large-caps by forecast dividend yield, take the top half, and weight by market cap. With ~450 holdings, it's the broadest of the three but applies no quality filter. The approach is straightforward — maximize current income. Yield: ~2.4%. Expense ratio: 0.06%.
VIG (Vanguard Dividend Appreciation ETF) follows the S&P U.S. Dividend Growers Index. It requires at least 10 consecutive years of dividend increases to qualify. This creates a growth-tilted portfolio with significant tech exposure (~28%) and financials (~21%), holding companies like Microsoft and Broadcom. It pays the lowest yield (~1.6%) but bets on dividend growth rather than dividend size. Expense ratio: 0.05%.
In short: SCHD filters for quality, VYM filters for yield, and VIG filters for consistency. Same category, three very different bets.
The 14-Year Performance Results
Here are the full metrics from our backtest, with SPY (S&P 500) as the benchmark.
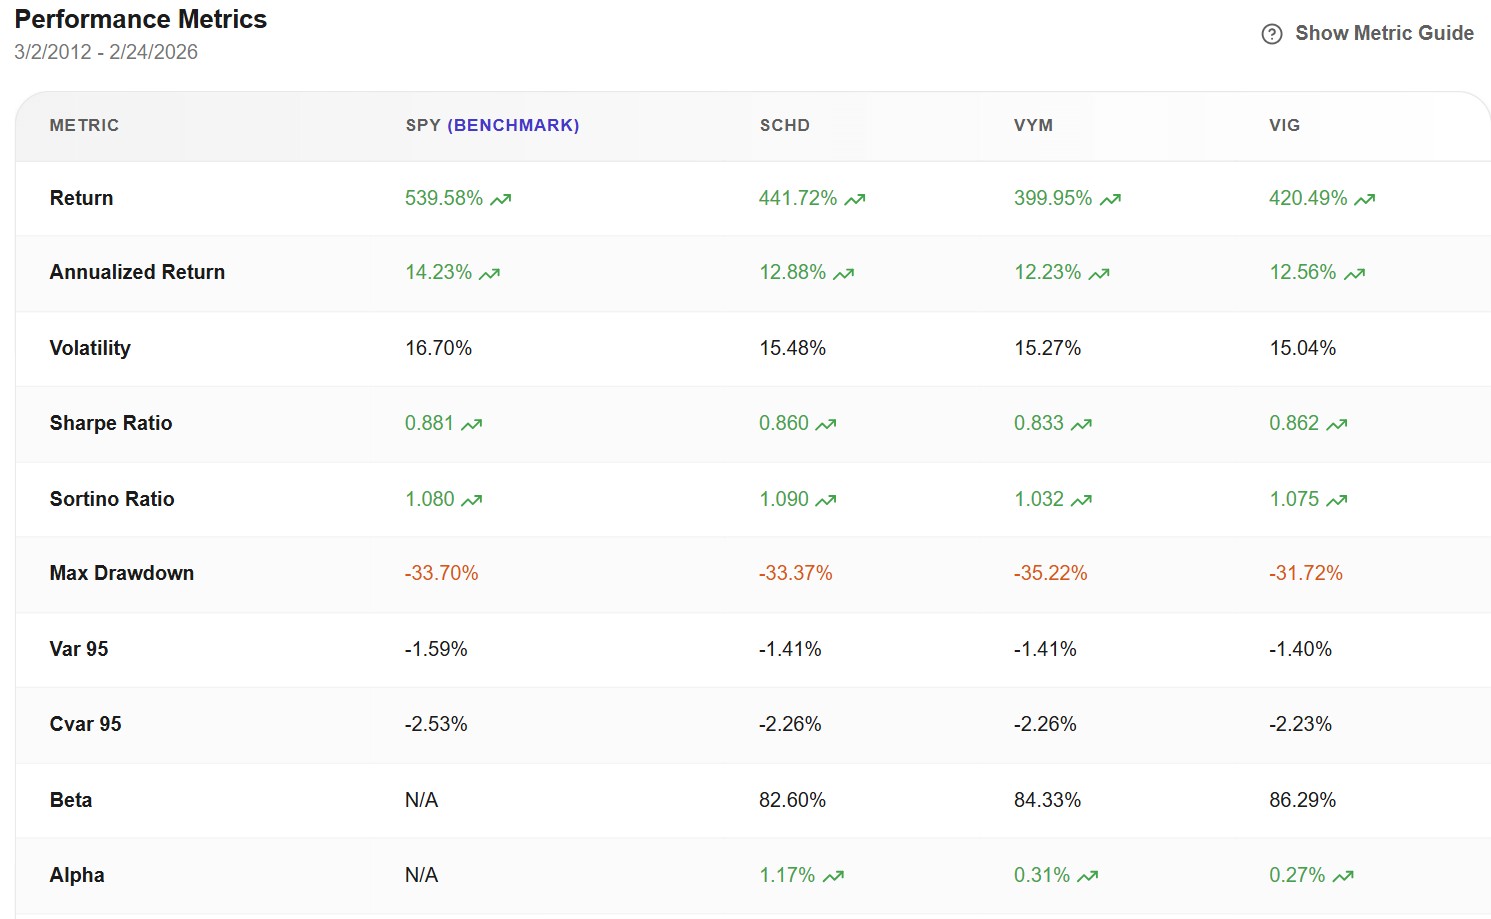
| Metric | SPY (Benchmark) | SCHD | VYM | VIG |
|---|---|---|---|---|
| Total Return | 539.58% | 441.72% | 399.95% | 420.49% |
| Annualized Return | 14.23% | 12.88% | 12.23% | 12.56% |
| Volatility | 16.70% | 15.48% | 15.27% | 15.04% |
| Sharpe Ratio | 0.881 | 0.860 | 0.833 | 0.862 |
| Sortino Ratio | 1.080 | 1.090 | 1.032 | 1.075 |
| Max Drawdown | -33.70% | -33.37% | -35.22% | -31.72% |
| VaR 95 | -1.59% | -1.41% | -1.41% | -1.40% |
| CVaR 95 | -2.53% | -2.26% | -2.26% | -2.23% |
| Beta | N/A | 82.60% | 84.33% | 86.29% |
| Alpha | N/A | 1.17% | 0.31% | 0.27% |
Data: AWALYT backtest using daily data (252 data points/year), March 2, 2012 – February 24, 2026. All returns include dividends reinvested.
The first takeaway: none of the three matched SPY's total return. The S&P 500 returned 539.58% versus SCHD's 441.72% at the top of the dividend group. That ~100-point gap is the "cost" of choosing dividends over the broad market during a period dominated by growth stocks. This is expected and not necessarily a problem — dividend strategies prioritize income and lower volatility, not maximizing absolute return.
The real question is how they compare against each other.
SCHD Wins on Return and Alpha
SCHD delivered the highest total return (441.72%) and the highest annualized return (12.88%) of the three dividend ETFs. But the most telling number is its alpha: 1.17%.
Alpha measures how much excess return an ETF generated beyond what its market exposure (beta) alone would predict. SCHD's beta of 0.826 means it captured about 83% of SPY's movements — yet it delivered a return that exceeded what that level of market participation would have produced by a meaningful margin. Over 14 years, that 1.17% of annual alpha compounds into a significant wealth difference.
VYM and VIG, by contrast, posted alpha values of just 0.31% and 0.27% respectively. Their returns are largely explained by their market exposure alone. SCHD's quality screens — particularly the cash flow to debt and ROE filters — appear to have genuinely added value beyond simple market participation.
SCHD also posted the highest Sortino ratio (1.090), which matters because Sortino only penalizes downside volatility. A high Sortino means SCHD's return came with fewer painful down days relative to the returns generated — exactly what income investors care about.
VIG Wins on Downside Protection
If your priority is sleeping well at night during a market crash, VIG is the clear winner. Its max drawdown of -31.72% was nearly 3.5 percentage points shallower than VYM's -35.22% and nearly 2 points better than SPY's -33.70%.
VIG also had the lowest VaR 95 (-1.40%) and CVaR 95 (-2.23%), meaning that on the 5% worst trading days, VIG lost less than the other two. For investors approaching retirement or those who know they'll panic-sell during a downturn, that gap can be the difference between staying invested and locking in losses.
This makes sense when you consider VIG's construction. Its requirement of 10 consecutive years of dividend growth naturally selects for financially strong, mature companies — the kind that tend to hold up better during market stress. Its tech tilt (companies like Microsoft and Broadcom that are also consistent dividend growers) gives it some growth exposure without the speculative names that drive the worst drawdowns.
The trade-off is that VIG's returns are almost entirely explained by its market exposure. With a beta of 0.863 — the highest of the three — and an alpha of just 0.27%, VIG essentially gives you a smoother ride on the same market wave, but it doesn't add much independent value through stock selection.
VYM: The Compromise That Doesn't Compromise Well
VYM sits in an uncomfortable middle position in this analysis. It delivered the lowest total return (399.95%), the deepest max drawdown (-35.22%), and the weakest Sharpe ratio (0.833). Its alpha of 0.31% suggests that the "high yield" approach — simply buying the highest-paying stocks without quality filters — doesn't generate meaningful independent returns.
With ~450 holdings versus SCHD's 100, VYM is significantly more diversified. But that diversification hasn't translated into better risk metrics. Its max drawdown was the worst of the three, worse even than SPY's. More holdings doesn't automatically mean less risk — it depends on which holdings.
The one area where VYM delivers is current income. Its ~2.4% yield sits between SCHD's ~3.3% and VIG's ~1.6%, and its broad approach means it captures dividend-paying stocks across more sectors. For investors who need reliable current income and prioritize simplicity over optimization, VYM remains a solid choice. But the data suggests it's neither the best for returns (SCHD) nor the best for risk management (VIG).
Correlation with SPY: SCHD Is Diverging
One of the most interesting patterns emerges from the correlation chart over time.
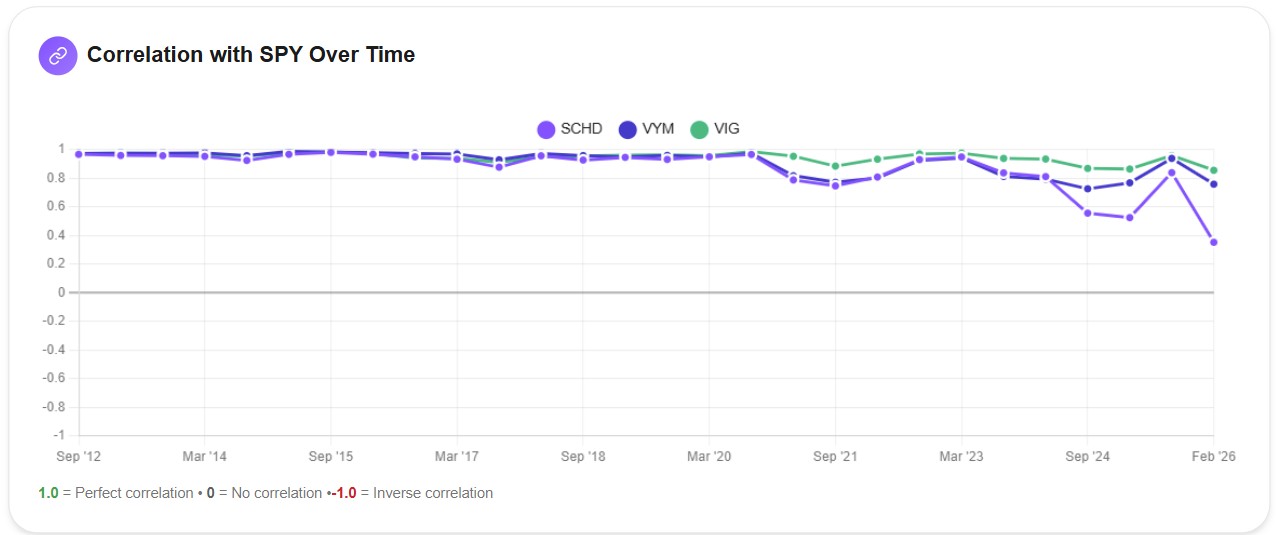
From 2012 through mid-2020, all three ETFs moved almost in lockstep with SPY — correlations stayed near 0.95. But starting in late 2024, something changed. SCHD's correlation with SPY dropped sharply, falling to roughly 0.3 by early 2026. VYM also dipped to ~0.75, while VIG stayed the most correlated at ~0.85.
What does this mean practically? SCHD is becoming a genuine diversifier relative to the broad market. As the S&P 500 has become increasingly concentrated in mega-cap tech, SCHD's quality-dividend approach — heavy on energy, consumer staples, and healthcare — is creating real separation. For investors worried about S&P 500 concentration risk, this divergence makes SCHD more valuable as a portfolio complement, not just a dividend play.
Volatility Spikes: Who Held Up Best?
The volatility chart reveals how each ETF responded to market stress.
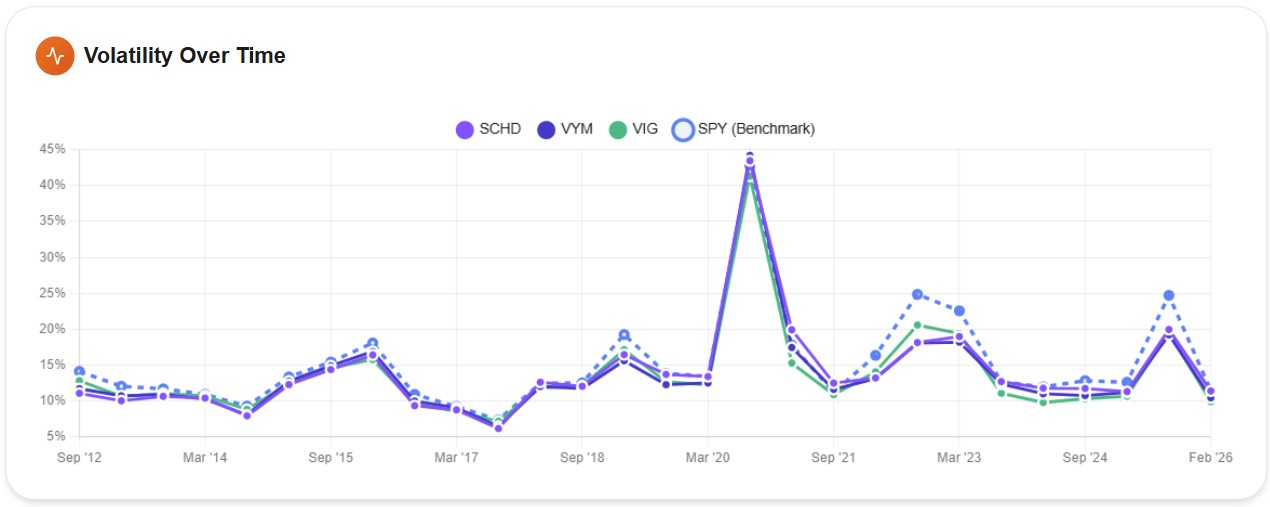
The March 2020 COVID crash is the defining event: volatility spiked to ~40-44% for all four, with VIG (green) showing a slightly lower peak. Outside of crisis periods, VIG consistently runs at the lowest volatility — roughly 10-12% in calm markets versus 12-15% for SCHD and VYM.
But look at late 2025 into early 2026: SPY's volatility jumped to ~25% while VIG stayed notably calmer at ~11%. This confirms VIG's role as the "sleep well at night" option during periods of market uncertainty.
Period Returns: When Each ETF Shines
The 6-month rolling returns chart shows how leadership rotates between strategies.
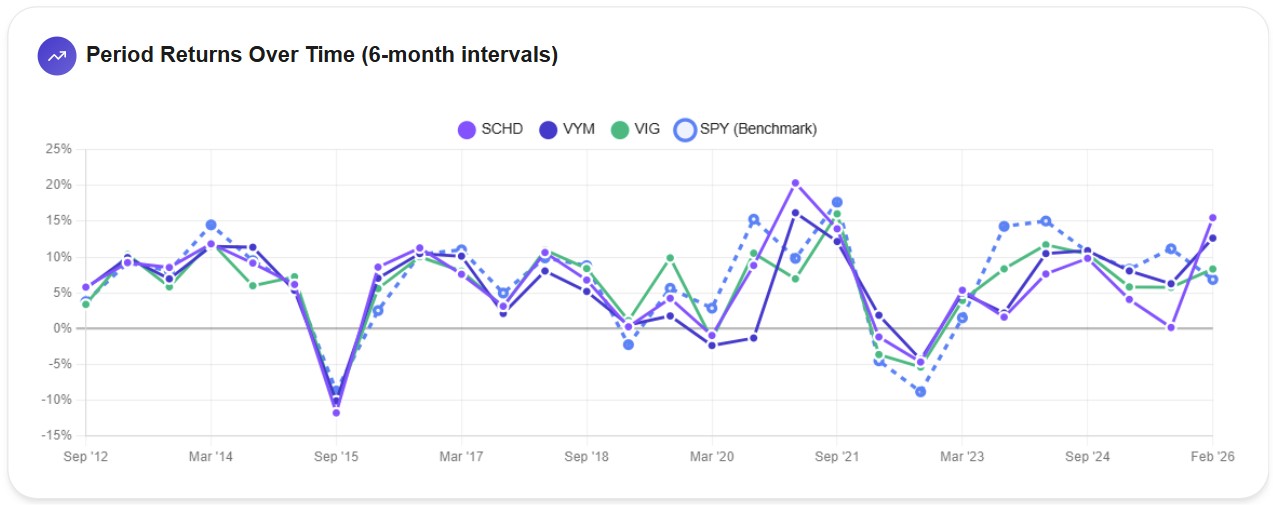
A few notable patterns stand out. During the September 2021 recovery period, SCHD posted the strongest 6-month return of the group (~20%), outperforming even SPY. This was the value/dividend rotation in action. In contrast, during 2023–2024 when growth stocks dominated, SPY (dashed blue) often led while all three dividend ETFs lagged. Most recently, in the final data points, VYM is actually outperforming — suggesting that the value rotation into 2026 may be favoring high-yield names.
The key insight: no single dividend ETF leads in every period. Their strategies rotate in and out of favor, which is another argument for holding more than one.
What 14 Years of Daily Data Reveals That Monthly Data Hides
One detail that stands out in this analysis: the max drawdown values. If you run this same comparison using monthly data on other platforms, you'll typically see shallower drawdowns — because monthly data only captures where the portfolio stood at month-end, not the worst intra-month levels.
For example, during the March 2020 COVID crash, markets dropped sharply and recovered partially within the same month. Monthly data smooths this into a more modest decline. Daily data from AWALYT captures the actual -35.22% trough for VYM and the -31.72% trough for VIG. These are the drawdowns investors actually experienced — the numbers they saw on their screens when deciding whether to hold or panic-sell.
For risk management, this distinction matters. If you're planning retirement withdrawals or stress-testing a portfolio, you need the worst-case scenario, not a smoothed approximation.
The Yield vs. Growth Trade-Off
This backtest reinforces a pattern we've documented in our broader dividend ETF analysis: higher current yield tends to mean lower total return over time.
VYM chases yield and delivered the weakest total performance. VIG prioritizes dividend growth (accepting a lower yield today) and delivered better risk-adjusted returns with the smallest drawdowns. SCHD balances both — moderate yield with quality screens — and came out ahead on total return and alpha.
For younger investors with a long time horizon, the data supports prioritizing dividend growth (VIG or SCHD) over dividend yield (VYM). The compounding effect of companies that increase their dividends year after year ultimately generates more wealth than collecting the highest yield today.
For investors already in or near retirement who need income now, the choice is between SCHD's higher yield with better alpha or VYM's simpler approach with more holdings. SCHD's concentrated 100-stock portfolio carries more individual stock risk, but its quality filters have historically compensated for that.
Summary: Which ETF Is Right for You?
There's no single "best" among these three — it depends on what you're optimizing for.
Choose SCHD if you want the highest return potential among dividend ETFs and are comfortable with a more concentrated, quality-screened portfolio. Over 14 years, SCHD's stock selection generated genuine alpha (1.17%) that VYM and VIG did not. It offers the best balance of yield and growth.
Choose VIG if you prioritize stability and downside protection. VIG experienced the shallowest drawdowns, the lowest tail risk (VaR/CVaR), and the lowest volatility. Its 10-year dividend growth requirement creates a portfolio of financially resilient companies — ideal if you know a deep drawdown would cause you to sell at the worst time.
Choose VYM if you want the simplest, broadest exposure to high-dividend stocks. VYM's ~450 holdings provide maximum diversification within the dividend space. But understand that this breadth hasn't translated into better risk-adjusted returns over this 14-year period.
Or consider holding more than one. SCHD and VIG pair well together — SCHD provides yield and alpha, VIG provides stability. Their sector exposures are quite different (SCHD leans energy/consumer defensive, VIG leans tech/financials), which adds genuine diversification.
Run Your Own Comparison
This analysis was generated using AWALYT's portfolio backtesting tool, which runs simulations on daily market data — 252 data points per year instead of the 12 that monthly tools use. Every metric you see here reflects what actually happened in the market, including intra-month volatility, real drawdown depth, and true risk-adjusted performance.
Want to test a different combination? Compare SCHD vs DGRO, add bonds to the mix, or test how rebalancing between dividend ETFs changes the outcome.
AWALYT provides analytical tools for educational and informational purposes. Past performance is not indicative of future results. This analysis does not constitute investment advice or a recommendation to buy or sell any security.
Want to test these insights on your own portfolios?
Awalyt is a portfolio analysis platform: backtesting on daily data, fundamental analysis, asset analysis, and AI-powered insights.
Get Started FreeRelated Insights
SCHD vs DGRO vs VYM vs HDV vs SPYD: 10-Year Backtest [2026]
12 min read
VOO vs SPMO: Should You Trade the S&P 500 for Its Momentum Version? [2026]
13 min read
SPY vs VOO vs IVV: Which S&P 500 ETF Should You Pick? [2026]
10 min read