SCHD vs DGRO vs VYM vs HDV vs SPYD: 10-Year Backtest [2026]
Dividend ETFs are among the most popular investment vehicles for income-focused investors. But behind the headline yield numbers, each fund follows a very different methodology — and those differences lead to dramatically different outcomes over time.
We ran a 10-year backtest (February 23, 2016 – February 17, 2026) on five of the most widely held US dividend ETFs — DGRO, SCHD, VYM, HDV, and SPYD. The goal was simple: look beyond the yield and understand what actually happened to investors' money, how much risk they took on, and why each fund performed the way it did.
The 10-Year Performance Overview
Here are the full performance metrics from our backtest.
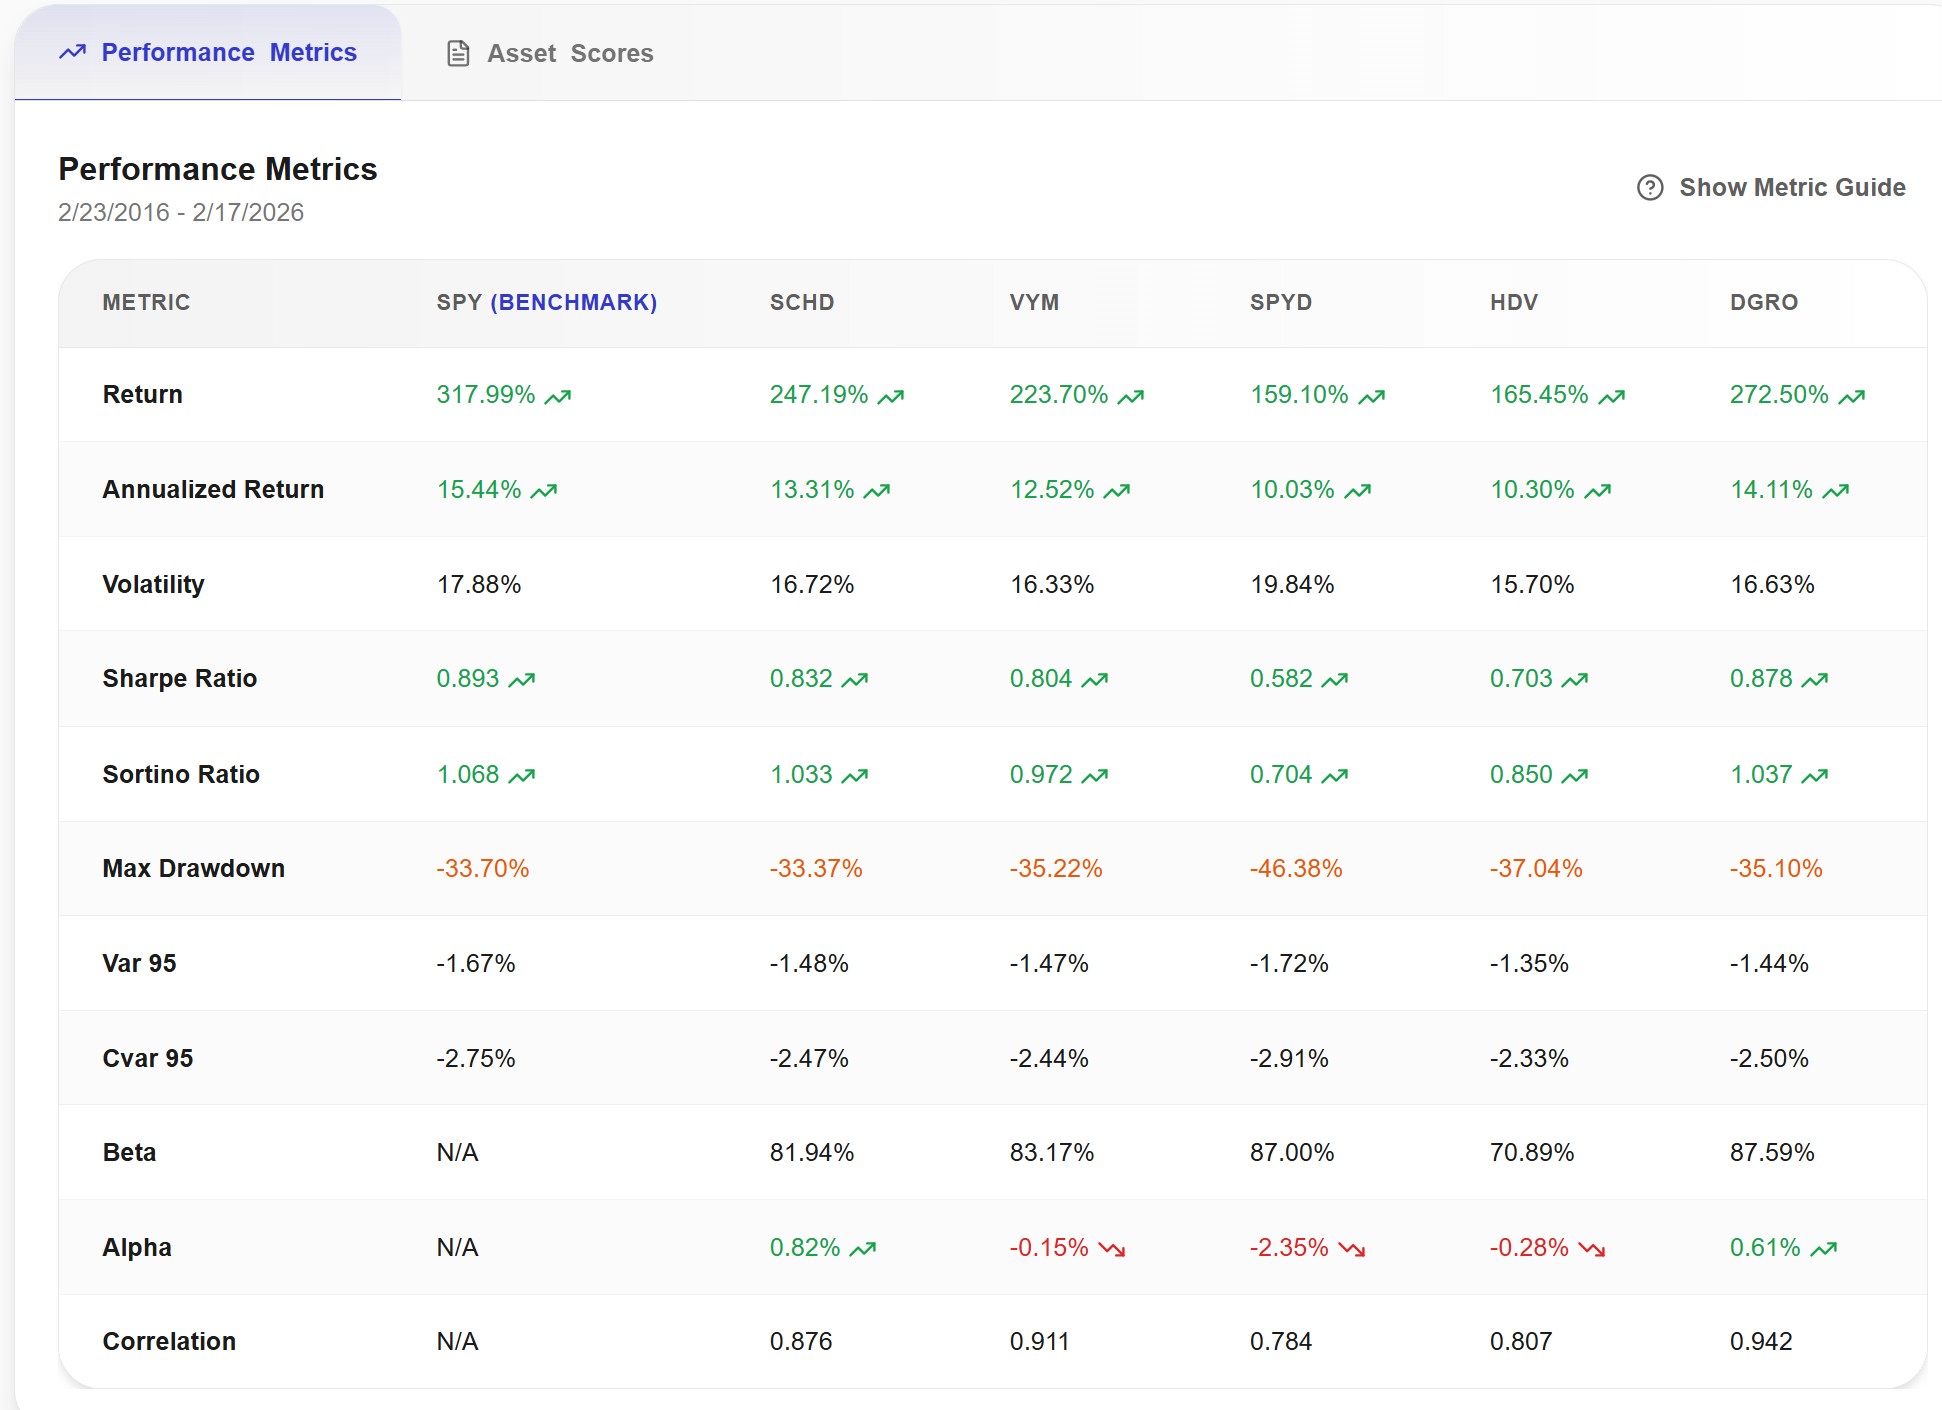
The first thing that jumps out is the sheer spread between these five funds. The gap between the best performer (DGRO at +272.50%) and the worst (SPYD at +159.10%) is over 113 percentage points. That's a massive difference for funds that all belong to the same "dividend ETF" category. It's a clear reminder that not all dividend strategies are created equal.
The second pattern is even more striking: the funds with the highest dividend yields delivered the lowest total returns, and vice versa. SPYD offers the highest yield (~4.85%) but sits at the bottom of the performance table. DGRO has the lowest yield (~2.01%) but generated the most wealth. This yield-vs-growth trade-off is the central story of this analysis.
Here's the full comparison:
| Ticker | ETF Name | Expense Ratio | Dividend Yield (Est.) | Total Return (10Y) | Annualized Return | Sharpe Ratio | Max Drawdown |
|---|---|---|---|---|---|---|---|
| DGRO | iShares Core Div Growth | 0.08% | ~2.01% | +272.50% | 14.11% | 0.878 | -35.10% |
| SCHD | Schwab US Div Equity | 0.06% | ~3.31% | +247.19% | 13.31% | 0.832 | -33.37% |
| VYM | Vanguard High Div Yield | 0.06% | ~2.25% | +223.70% | 12.52% | 0.804 | -35.22% |
| HDV | iShares Core High Div | 0.08% | ~3.79% | +165.45% | 10.30% | 0.703 | -37.04% |
| SPYD | SPDR S&P 500 High Div | 0.07% | ~4.85% | +159.10% | 10.03% | 0.582 | -46.38% |
Data: Awalyt backtest using daily data, Feb 2016 – Feb 2026. Expense ratios and estimated yields from fund prospectuses and recent market data as of Feb 2026.
For context, the S&P 500 (SPY) returned +317.99% over the same period with a Sharpe ratio of 0.893. None of the five dividend ETFs matched the broad market — but that's expected, since dividend strategies prioritize income and stability over pure growth. The real question is how they compare to each other.
Let's break down what drives these differences — because the real story is in each fund's index methodology.
DGRO — iShares Core Dividend Growth ETF
The approach: DGRO tracks the Morningstar US Dividend Growth Index. Its methodology prioritizes companies that are growing their dividends rather than paying the highest yields today. To qualify, a company must have at least 5 consecutive years of dividend growth and a payout ratio below 75%. Notably, it also excludes the top 10% highest-yielding stocks — a deliberate filter against companies whose yields are elevated simply because their share prices have been falling.
Composition: With approximately 400 holdings, DGRO is broadly diversified. Its quality-growth screens give it meaningful exposure to sectors like Technology (~16%), Healthcare (~17%), and Financials (~21%) — a very different profile from traditional high-yield funds. This means it holds names like Microsoft and Apple, which pay modest dividends but have delivered significant capital appreciation.
What the data shows: DGRO posted the highest total return among the five (+272.50%) and the strongest risk-adjusted performance with a Sharpe ratio of 0.878. Its alpha of +0.61% versus the benchmark confirms it added value over the period. The trade-off is clear: at ~2.01%, its current yield is the lowest in the group. If you need income today, DGRO won't deliver much. But if you're reinvesting dividends and focused on long-term compounding, the data shows it has been the most effective wealth builder of the five.
Cost: 0.08% expense ratio.
SCHD — Schwab U.S. Dividend Equity ETF
The approach: SCHD tracks the Dow Jones U.S. Dividend 100 Index and applies one of the stricter screening processes in the dividend ETF space. Companies must have paid dividends for at least 10 consecutive years, then are ranked on four fundamental metrics: cash flow to total debt, return on equity, dividend yield, and 5-year dividend growth rate.
Composition: The fund holds exactly 100 stocks with strict concentration limits — no single stock above 4% weight, no sector above 25%. This creates a value-oriented portfolio currently heavy in Financials, Healthcare, and Industrials, with meaningful Energy exposure through names like Chevron and ConocoPhillips. Unlike DGRO, SCHD has minimal exposure to mega-cap tech.
What the data shows: SCHD returned +247.19% with a Sharpe ratio of 0.832, placing it second in total return. Where it stands out is the combination of yield and resilience: it offers a meaningful ~3.31% dividend yield — significantly higher than DGRO — while posting the lowest max drawdown of any fund in the group at -33.37%. It's also the only dividend ETF in this comparison with a clearly positive alpha (+0.82%), suggesting its quality screens genuinely added value. For investors who want both income and downside protection, SCHD hit a rare sweet spot in this period.
Cost: 0.06% expense ratio.
VYM — Vanguard High Dividend Yield ETF
The approach: VYM tracks the FTSE High Dividend Yield Index. Its methodology is straightforward: rank all US dividend-paying stocks by forecasted yield, select the top half, and weight by market capitalization. It explicitly excludes REITs, which can carry different tax treatment.
Composition: With over 550 holdings, VYM is the most diversified fund in this comparison by a wide margin. Its market-cap weighting means the largest, most stable companies naturally form the core of the portfolio. Sector exposure is broad, tilting toward Financials (~20%), Industrials, and Consumer Staples.
What the data shows: VYM returned +223.70% with a Sharpe ratio of 0.804 and moderate volatility at 16.33%. Its dividend yield of ~2.25% is modest — lower than SCHD, HDV, and SPYD. Its alpha was slightly negative at -0.15%, meaning it essentially tracked the broad dividend universe without adding or subtracting much. VYM is the "index fund" of dividend investing: broad, cheap, predictable, and unlikely to surprise you in either direction. For investors who want simple, diversified exposure to dividend payers without a strong tilt toward any particular strategy, it does the job.
Cost: 0.06% expense ratio.
HDV — iShares Core High Dividend ETF
The approach: HDV tracks the Morningstar Dividend Yield Focus Index and uses a proprietary screening process centered on financial health. It looks for companies with sustainable competitive advantages (Morningstar's "moat" ratings) and low probability of default. Only about 75 stocks pass these filters.
Composition: The strict screens and small holding count lead to significant sector concentration. HDV is currently heavily weighted toward Energy (~24%) and Consumer Staples (~28%). These are typically stable, cash-generating businesses — think Exxon Mobil, Verizon, Philip Morris — but they tend to be slow-growing. The fund has minimal exposure to Technology or high-growth sectors.
What the data shows: HDV returned +165.45% with an annualized return of 10.30% and a Sharpe ratio of 0.703. Despite offering one of the higher yields in the group (~3.79%), the total return trailed DGRO by over 107 percentage points. The concentration in defensive sectors provided the lowest volatility of the five (15.70%) but limited upside significantly. Its alpha of -0.28% was slightly negative. HDV is built for investors who prioritize stable income from financially sound companies and are willing to accept lower growth — but the data shows that over a full decade, this trade-off had a meaningful cost.
Cost: 0.08% expense ratio.
SPYD — SPDR Portfolio S&P 500 High Dividend ETF
The approach: SPYD tracks the S&P 500 High Dividend Index with the most yield-focused methodology of the group. It takes the 80 highest-yielding stocks in the S&P 500 and equal-weights them at roughly 1.25% each. This is the most mechanically aggressive income strategy in this comparison.
Composition: Equal-weighting means every company — regardless of size or stability — has the same portfolio impact. A $15 billion utility carries the same weight as a $500 billion financial giant. The methodology also tends to accumulate stocks whose yields are high because their share prices have been declining — a dynamic that can become a drag on performance when those declines reflect genuine business deterioration rather than temporary market sentiment.
What the data shows: SPYD delivered the highest current yield of the group (~4.85%) but the lowest total return (+159.10%) and the worst risk metrics across every dimension: highest volatility (19.84%), deepest max drawdown (-46.38%), lowest Sharpe ratio (0.582), and the most negative alpha (-2.35%). Its low correlation with SPY (0.784) confirms it behaves quite differently from the broad market — though in this 10-year period, that difference consistently worked against investors. The high yield comes at a real cost in both total return and portfolio stability.
Cost: 0.07% expense ratio.
The Yield vs. Total Return Trade-Off
The most important takeaway from this analysis is the inverse relationship between dividend yield and total return across these five funds:
| Ranked by Yield (High → Low) | Dividend Yield | Total Return (10Y) |
|---|---|---|
| SPYD | ~4.85% | +159.10% |
| HDV | ~3.79% | +165.45% |
| SCHD | ~3.31% | +247.19% |
| VYM | ~2.25% | +223.70% |
| DGRO | ~2.01% | +272.50% |
The pattern is almost perfectly linear: higher yield, lower total return. This isn't a coincidence — it reflects the mechanics of how these funds are built. Funds that chase the highest yields end up concentrating in slower-growing, sometimes declining businesses. Funds that screen for dividend growth and quality tend to hold companies that are reinvesting in their business, leading to both rising dividends and capital appreciation over time.
This doesn't mean high-yield funds are "bad." It means they serve a different purpose. An investor who needs $4,000 per year in income from a $100,000 portfolio today has different needs than someone who wants to maximize the value of that portfolio in 10 years. The data helps clarify the trade-off so investors can choose with clear expectations.
How the Index Methodology Drives Results
Expense ratios are nearly identical across these five funds (0.06%–0.08%), so cost isn't the differentiator. What drives the performance gap is how each index selects and weights its holdings:
DGRO filters for dividend growth and screens out the highest yielders. This keeps it away from distressed stocks and tilts it toward quality companies with room to grow. Result: best total return, lowest yield.
SCHD demands 10 years of dividend history and ranks on four fundamental metrics. This creates a concentrated, quality-focused portfolio. Result: strong balance of yield and resilience.
VYM takes a broad, passive approach — top half of dividend payers by yield, market-cap weighted. Result: middle-of-the-road performance with maximum diversification.
HDV uses Morningstar's moat and financial health screens on only ~75 stocks. Result: defensive and stable, but concentrated in slow-growth sectors.
SPYD mechanically buys the 80 highest-yielding S&P 500 stocks with equal weighting. Result: highest yield but also highest risk and lowest total return.
The lesson is clear: the index methodology matters far more than the expense ratio. Two funds that both cost 0.08% (DGRO and HDV) delivered total returns 107 percentage points apart.
Choosing the Right Dividend ETF
There is no single "best" dividend ETF — the right choice depends on what you're optimizing for.
If your priority is long-term wealth accumulation and you don't need current income, DGRO's growth-oriented approach delivered the best combination of return and risk-adjusted performance in this period, with a Sharpe ratio nearly matching the S&P 500.
If you want a balance of meaningful income and capital resilience, SCHD stands out with a ~3.31% yield, the lowest drawdown in the group, and positive alpha — a rare combination that suggests its quality screens genuinely add value.
If you want broad, passive exposure to dividend-paying stocks with minimal single-stock risk, VYM's 550+ holdings and market-cap weighting make it the simplest "set and forget" option.
If you need maximum current income and accept the trade-offs, SPYD and HDV offer higher yields — but the 10-year data shows this comes with significantly lower total returns and, in SPYD's case, considerably higher volatility.
For financial advisors, these distinctions matter in client conversations. A client asking for "dividend income" may have very different expectations depending on whether they're comparing yield numbers or total return. This data provides a concrete framework for aligning expectations with outcomes, and for explaining why a lower-yielding fund might actually be the better choice for certain financial plans.
A Note on Limitations
This analysis covers a specific 10-year window (2016–2026) that included a strong run for US growth and technology stocks, which naturally favored funds like DGRO with tech exposure. A different decade — one dominated by energy, utilities, or value stocks — could produce a different ranking. Past performance does not predict future results.
Additionally, this backtest does not account for taxes on dividend distributions, which can significantly affect after-tax returns depending on the investor's jurisdiction and account type. A high-yield fund like SPYD generates more taxable events annually than a growth-oriented fund like DGRO — a hidden cost that further widens the gap in after-tax performance for many investors.
All five funds are extremely cost-efficient, with expense ratios between 0.06% and 0.08%. On a $100,000 portfolio, that's $60–$80 per year in fees — a fraction of what actively managed funds typically charge.
Want to run your own analysis with different time periods, benchmarks, or tax assumptions? Try Awalyt — our backtesting engine uses daily data precision for more accurate results than the monthly approximations used by most tools.
Disclaimer: This article is for informational and educational purposes only. It does not constitute financial advice. Past performance is not indicative of future results. Always consult a qualified financial advisor before making investment decisions.
Want to test these insights on your own portfolios?
Awalyt is a portfolio analysis platform: backtesting on daily data, fundamental analysis, asset analysis, and AI-powered insights.
Get Started FreeRelated Insights
SCHD vs VYM vs VIG: 14-Year Backtest — Which Dividend Strategy Actually Wins?
12 min read
SPY vs VOO vs IVV: Which S&P 500 ETF Should You Pick? [2026]
10 min read
Does Adding AVUV to VOO Improve Your Portfolio? [2026]
10 min read