VT vs VTI: Is a World ETF Actually More Diversified? [2026]
This article is for educational and informational purposes only. It does not constitute investment advice. Past performance does not guarantee future results. Always do your own research before making any investment decisions.
Buy VT and you own a slice of roughly 10,000 companies spread across nearly 50 countries. Buy VTI and you own the US stock market — about 2,500 companies, one country. By any reasonable definition, VT is the more diversified fund. It isn't close.
So the result is a little awkward. Over the last 16 years, $10,000 in VTI grew to about $82,800. The same $10,000 in VT grew to roughly $53,500. The fund that spreads your money across the entire planet trailed the one that bet on a single country by nearly $30,000.
There's a reason for that, and it isn't the one most people reach for. The deeper issue is that VT and VTI overlap far more than the "world vs US" label suggests. About half of VT, by weight, is the exact same stocks already sitting inside VTI. If you bought VT believing that single ticker was your diversification, the data has a few things to show you.
What Each ETF Tracks
VT (Vanguard Total World Stock ETF) tracks the FTSE Global All Cap Index. That index reaches developed and emerging markets, large caps down to small caps — close to the entire investable global stock market in one fund.
VTI (Vanguard Total Stock Market ETF) tracks the CRSP US Total Market Index — essentially every investable US stock, from Apple and NVIDIA down to micro-caps you've never heard of. It's the same fund we put under the microscope in VOO vs VTI, where the question was large-cap versus total US market. This time the question moves up a level, from US to global.
Here's the profile comparison:
| Metric | VT | VTI |
|---|---|---|
| Index | FTSE Global All Cap | CRSP US Total Market |
| Holdings | ~10,000 stocks, ~50 countries | ~2,500 US stocks |
| Net Assets (AUM) | $89.9B | $2.20T |
| Expense Ratio | 0.06% | 0.03% |
| Portfolio Turnover | 3.00% | 3.00% |
| Dividend Yield | 1.67% | 1.17% |
| Inception | June 2008 | May 2001 |
Two differences are worth holding onto. VT costs twice as much (0.06% vs 0.03%), which on a $100,000 position is $60 a year against $30 — real, but not decisive. And VT pays a noticeably higher dividend yield, 1.67% vs 1.17%, because international stocks as a group distribute more of their earnings than US growth companies do. Everything else looks like what it is: two broad, cheap, cap-weighted Vanguard index funds.
The Overlap Most "World" Investors Miss
This is the part that reframes the whole comparison.
VT is roughly 60% US stocks and 40% international. That single fact is widely quoted and easy to shrug at. What's harder to shrug at is what it means at the holdings level.
Running both funds through Awalyt's ETF analysis, VT and VTI share 268 of the same stocks. Those shared holdings account for 50.2% of VT's total weight and 80.1% of VTI's. Read that again. Half of your "whole world" fund is the same companies that make up four-fifths of a fund explicitly built to own nothing but America.
The top holdings make it concrete:
| # | VT | Weight | VTI | Weight |
|---|---|---|---|---|
| 1 | Apple | 4.10% | Apple | 6.29% |
| 2 | NVIDIA | 3.59% | NVIDIA | 6.21% |
| 3 | Microsoft | 3.58% | Microsoft | 5.56% |
| 4 | Amazon | 2.35% | Amazon | 3.40% |
| 5 | Meta | 1.47% | Broadcom | 2.88% |
| 6 | Alphabet (A) | 1.28% | Alphabet (A) | 2.83% |
| 7 | Tesla | 1.28% | Alphabet (C) | 2.25% |
| 8 | Broadcom | 1.20% | Meta | 2.14% |
| 9 | Alphabet (C) | 1.05% | Tesla | 1.79% |
| 10 | Berkshire Hathaway | 0.81% | Berkshire Hathaway | 1.40% |
Every one of VT's ten largest holdings is an American company. Not "mostly." All ten. The first international stock in VT doesn't appear until you're well down the list. VT's top 10 represents 20.7% of the fund; VTI's top 10 is heavier at 34.8%, but the names are the same names.
One note on the data behind these numbers. Holdings detail comes from a third-party provider that, for simplicity, exposes roughly the top 300 constituents of VT and the full ~2,500 of VTI. Both funds are market-cap weighted, so the names left out of VT are its smallest positions, and the captured set still covers the large majority of the fund's weight. The overlap percentages hold; if anything, the true overlap by raw stock count is slightly higher than 268.
The 40% of VT that genuinely is international does add something VTI cannot: thousands of Japanese, British, Canadian, and emerging-market companies that VTI will never hold. That exposure is real. But the diversification story sold around VT — "own the world, stop worrying" — quietly skips over the fact that the fund's center of gravity is the identical cluster of US mega-caps you'd get from VTI, QQQ, or any S&P 500 fund. If you want to see exactly where two funds duplicate each other, that's what the overlap analysis is built to surface.
16 Years of Performance
We backtested VT and VTI from May 2010 to May 2026 using daily-precision data, with SPY (the S&P 500) as the benchmark. That's 16 years and just over 4,000 daily data points, covering the post-2010 bull market, the 2020 COVID crash, and the 2022 bear market.
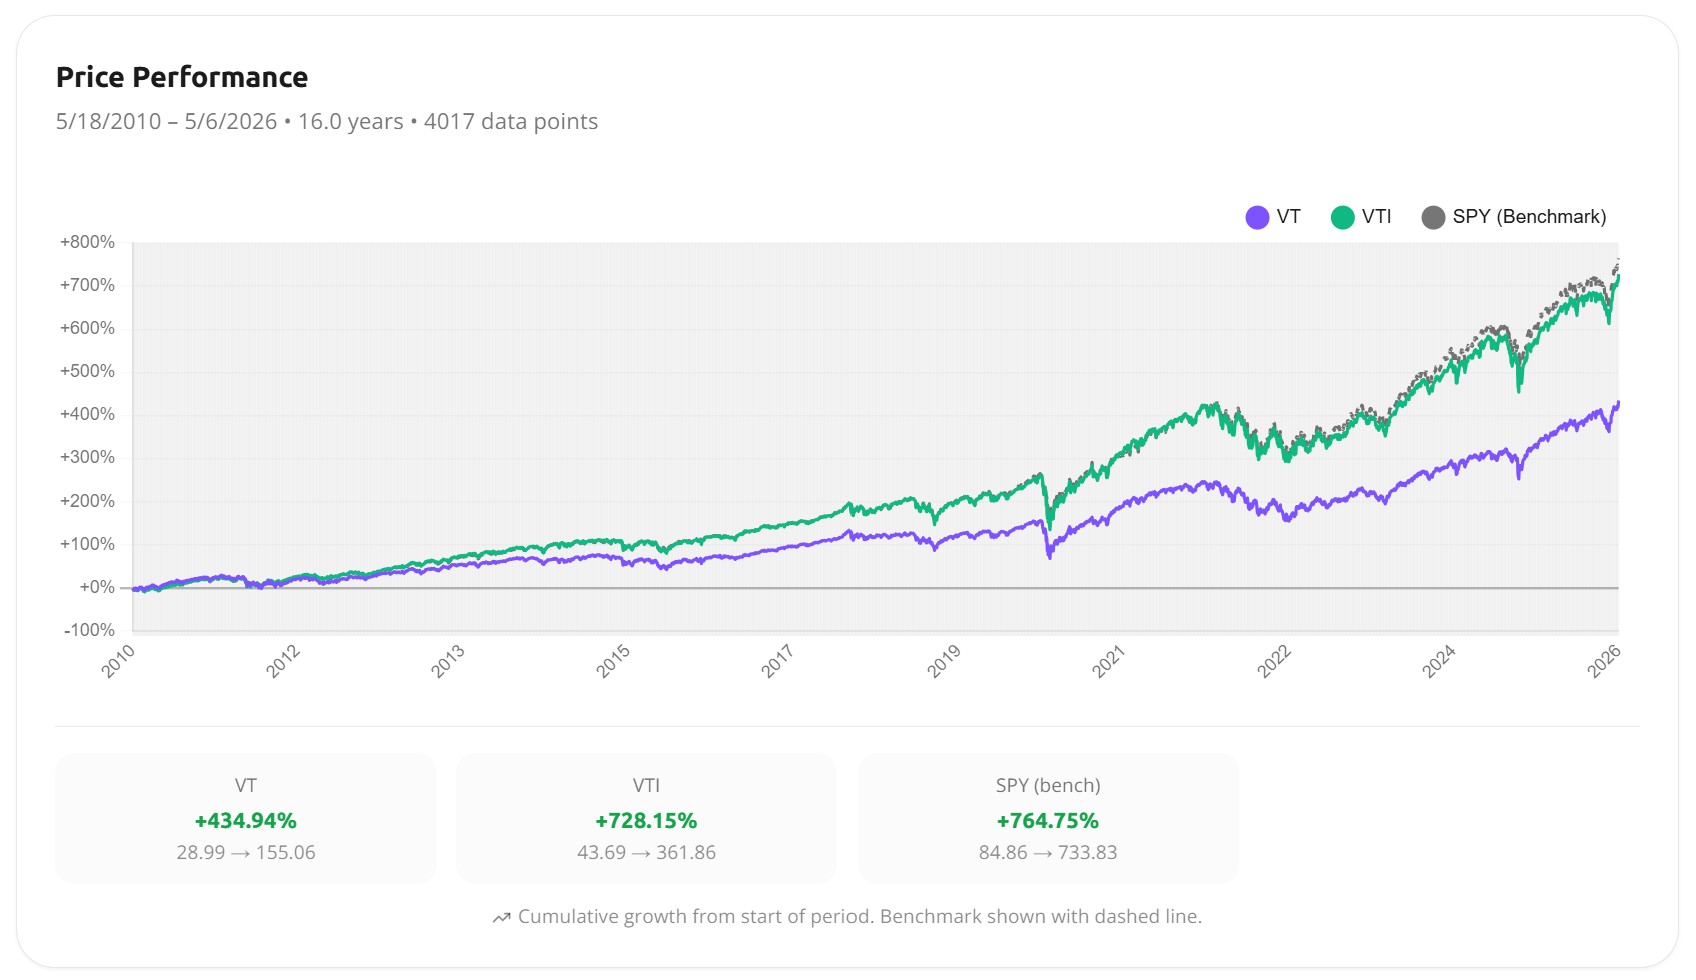
The chart tells the story before any table does. VTI shadows the S&P 500 closely across the whole window. VT separates early, around 2013, and the gap widens every year after. There is no point on this chart where owning the world paid off relative to owning America.
The metrics fill in the detail:
| Metric | VT | VTI | SPY (benchmark) |
|---|---|---|---|
| Total Return | 434.94% | 728.15% | 764.75% |
| Annualized Return | 11.10% | 14.19% | 14.50% |
| Volatility | 17.32% | 17.53% | 17.14% |
| Sharpe Ratio | 0.695 | 0.845 | 0.876 |
| Sortino Ratio | 0.861 | 1.043 | 1.079 |
| Max Drawdown | −34.23% | −35.00% | −33.70% |
| Correlation to SPY | 0.967 | 0.996 | — |
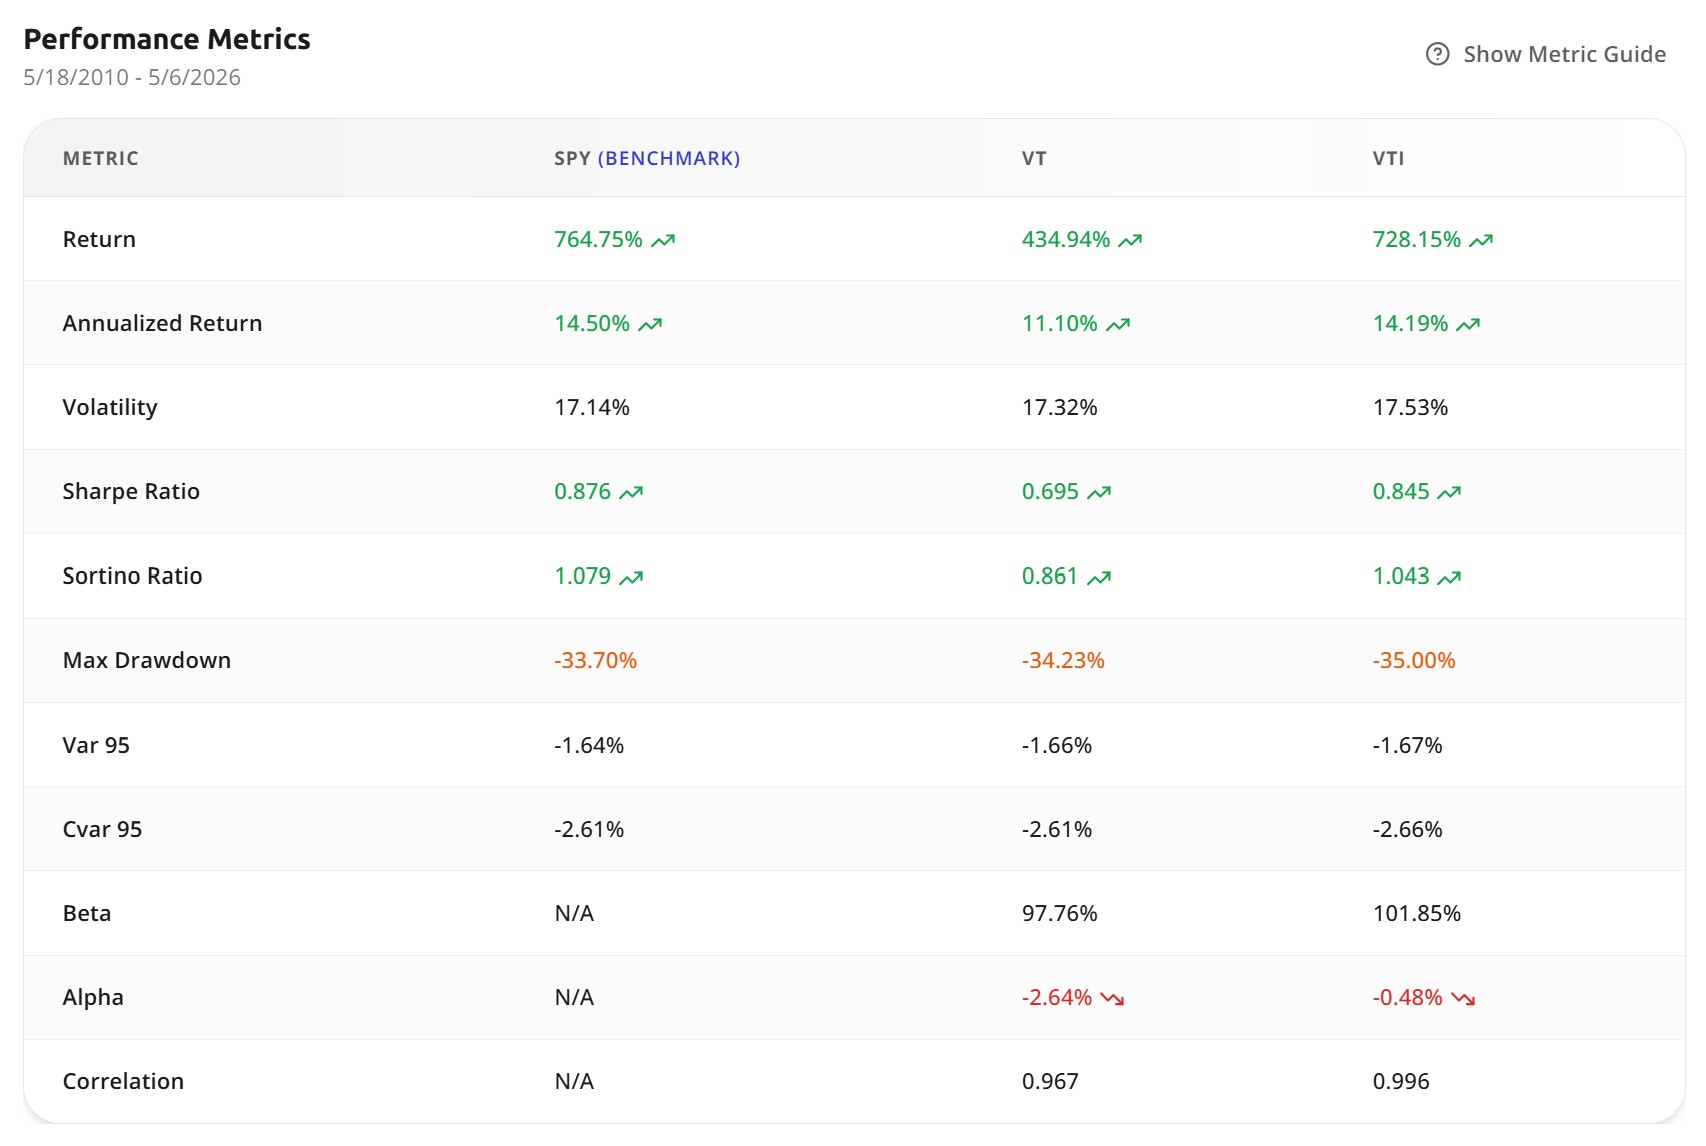
VTI returned about 3.1 percentage points more per year than VT. Over 16 years of compounding, that's the difference between roughly $82,800 and $53,500 on a $10,000 start.
Now look at the columns that aren't return. VT's volatility was 17.32%. VTI's was 17.53%. Its maximum drawdown was −34.23% against VTI's −35.00%. For all practical purposes, the global fund was just as bumpy and fell just as hard. This is the finding that should give a "diversify internationally for safety" investor pause: over these 16 years, holding the entire world instead of just the US did not lower volatility and did not soften the worst drawdown. It only lowered the return. That shows up directly in the Sharpe ratio — 0.695 for VT versus 0.845 for VTI — which is the cleanest single number for "return earned per unit of risk taken."
A caveat the data demands: this is the verdict of this 16-year window, a period defined by US mega-cap dominance. It is not a law of nature. More on that below.
The Annual Returns Tell the Same Story
A single 16-year number can hide a lot. Year by year, it doesn't here.
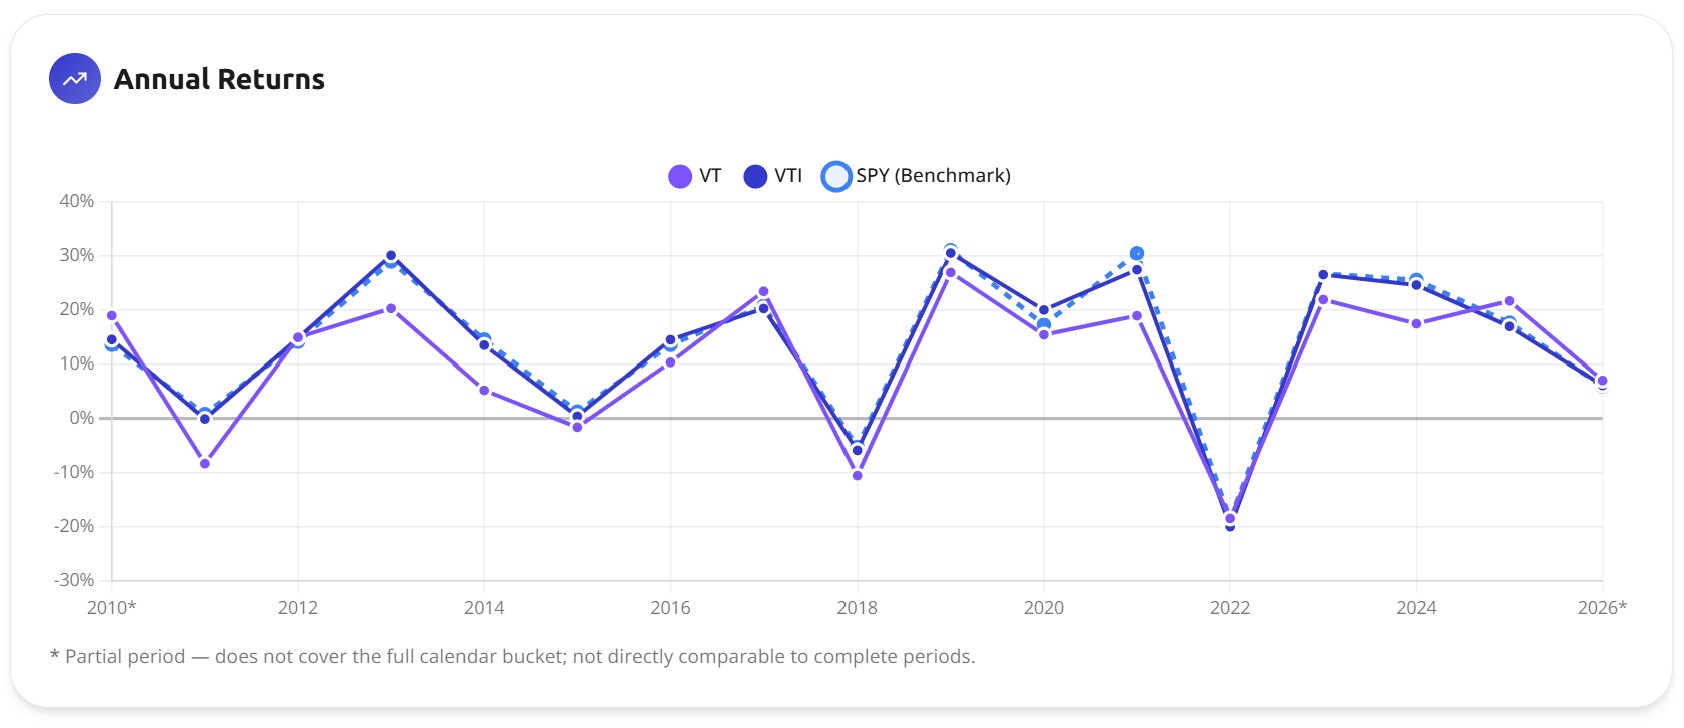
VT finished below VTI in most calendar years on the chart. In the up years that drove the decade — 2013, 2019, 2021, 2023 — VTI consistently captured more of the move. In 2011, VT was down around 8% while VTI was roughly flat.
The years that matter most for the diversification argument are the bad ones, and they don't rescue VT either. In 2018 and again in 2022, VT fell essentially in line with VTI rather than cushioning the drop. The international sleeve wasn't a counterweight during stress. It mostly went down at the same time, for the same reasons.
Correlation: Adding the World Didn't Decouple You From America
If geographic diversification were doing heavy lifting, you'd expect VT to move differently from the S&P 500. It doesn't.
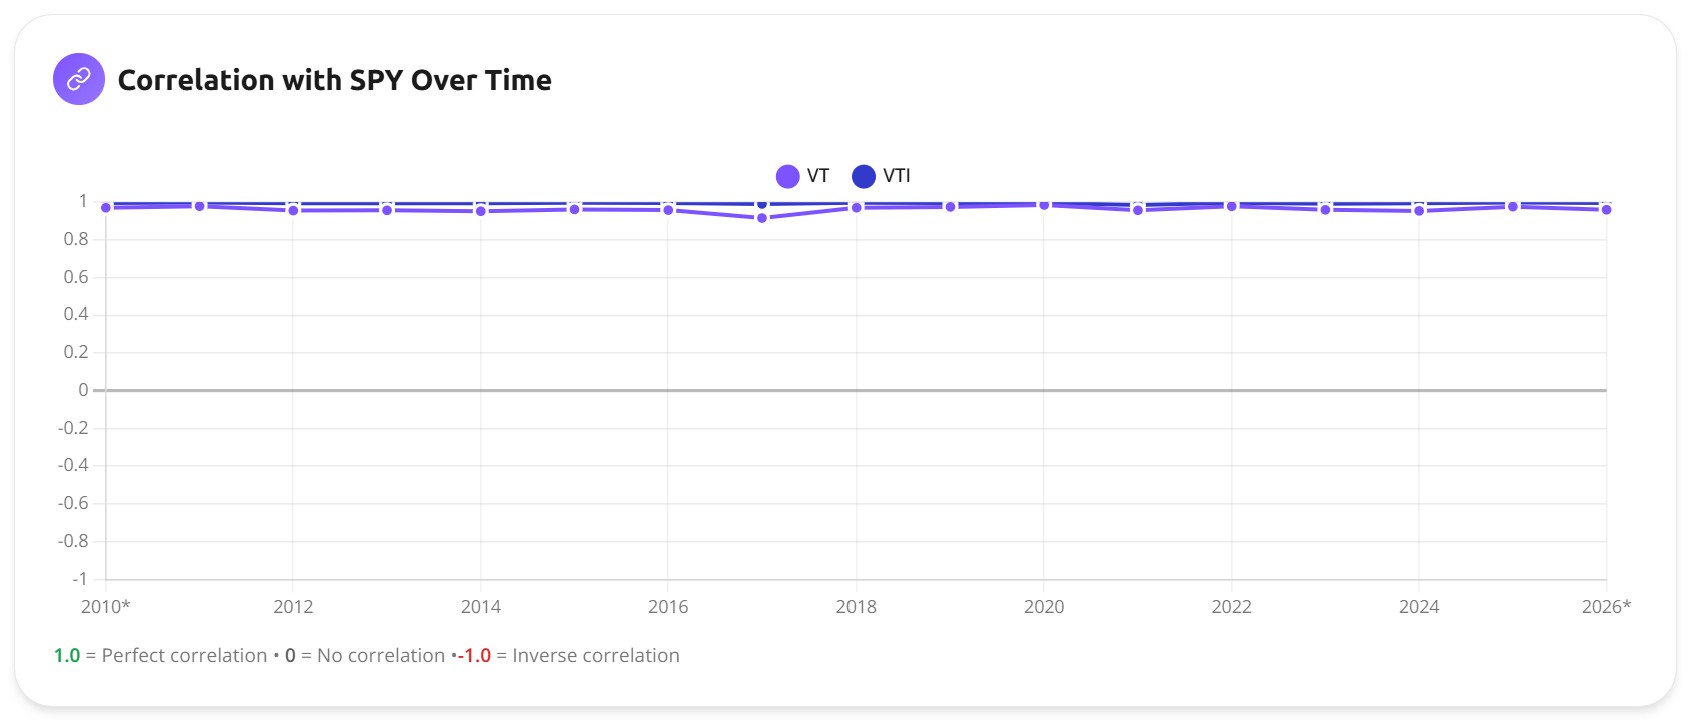
VTI's correlation with the S&P 500 is 0.996 — they are, mechanically, almost the same thing. The number worth sitting with is VT's: 0.967. Lower than VTI, yes, but only barely. A "total world" fund still moved almost in lockstep with a US large-cap index across 16 years.
There are two reasons. The first is structural: 60% of VT is US stocks, so it inherits most of the S&P 500's behavior by construction. The second is broader and easy to underestimate. Global equity markets have become highly correlated with each other. When US stocks sell off hard, developed and emerging markets tend to sell off too. The diversification you get from spreading across countries is real over long horizons, but it is not the crash-day insurance many investors assume it is. Genuine decorrelation in a portfolio tends to come from owning different asset classes — bonds, gold, real assets — not from owning equities in different postal codes. That's the distinction at the heart of what portfolio diversification actually means.
I'll add one note on method here. Awalyt runs these backtests on daily data, not the monthly data most free tools use. For correlation and drawdown specifically, that matters: monthly sampling skips the worst single days and quietly flatters every "safety" metric. The −34% drawdown above is the real one, not a smoothed estimate.
Why VT Lagged — So Far
VT's underperformance isn't a flaw in the fund. It's a faithful recording of what global markets did for 16 years.
This period belonged to US mega-cap technology. Apple, Microsoft, NVIDIA, Amazon, Alphabet, Meta — those companies drove the bulk of global equity returns, and they are all American. VTI is 100% exposed to that engine. VT holds the same stocks, but their weight is diluted by a 40% international allocation that, as a group, badly underperformed the US over this stretch. The backtest puts a number on the drag: VT's alpha against the benchmark was −2.64%, against VTI's −0.48%.
Here's the part that keeps this from being a simple "VTI wins" article. Market leadership rotates, and it has rotated hard before. Through the 2000s — the so-called lost decade for the S&P 500 — international and emerging-market stocks meaningfully outperformed US equities. An investor who ran this exact comparison in 2010 would have seen VT's global exposure as the obvious advantage, not the obvious cost. More recently, 2025 was a year where international holdings helped global funds rather than hurt them.
I don't know which way the next decade breaks, and neither does anyone selling you a confident answer. What I'd push back on is the framing that treats VT's recent record as proof that international diversification "doesn't work." It worked badly in this window. The honest version is narrower: a 16-year backtest tells you what happened, not what happens next.
Free Resource
VT vs VTI — Complete Data Report
Holdings breakdown, ETF overlap, sector allocation, and 16 years of performance metrics.
Download the Report →No account required — just your email.
So, Is VT More Diversified Than VTI?
Technically, yes. VT holds thousands of companies VTI will never touch, across markets VTI doesn't reach. On a pure count of exposures, it wins easily.
But that's the wrong test, and it's worth being precise about why. Diversification isn't a property you confirm by reading a fund's fact sheet. It's something you measure by how the portfolio actually behaves. And on that test — volatility, drawdown, correlation, the path through 2020 and 2022 — VT and VTI behaved almost identically. Swapping one for the other barely changed the ride. It mostly changed the destination, and not in VT's favor.
So should you hold VT or VTI? The useful answer isn't a verdict, it's a different question. The real decision was never "which single ticker." It's how much international exposure you actually want, and whether you believe in it enough to hold it through a stretch like the last 16 years.
Maybe you're someone who wants one fund, never wants to think about a US-versus-international split again, and is genuinely fine underperforming a US-only portfolio for years if that's how the cycle runs. VT is a clean, defensible, genuinely global choice for that person. Or maybe you want US exposure as your core and would rather control the international slice deliberately — 20%, 30%, whatever fits your conviction — using a separate fund. In that case VTI plus a dedicated international ETF gives you a dial that VT welds shut at 40%. We backtested exactly that trade-off across several allocations in 60/40 vs 70/30 vs 80/20: VTI/VXUS, and the split you pick turns out to matter more than most forum debates admit.
What VT doesn't do is let you skip the question. I've lost count of the Bogleheads threads where "just buy VT" is offered as the end of the diversification conversation. It isn't the end. It's a 60/40 US-international bet with the ratio chosen for you — a reasonable default, but a choice, not an escape from one.
The Bottom Line
"World" is a label on a fund. Diversification is a property of a portfolio, and the only way to know if you have it is to measure it.
Sixteen years of daily data say something specific about VT and VTI. The global fund was not safer — same volatility, same drawdown. It was not decoupled from the US — 0.967 correlation with the S&P 500. And it was not free — half its weight overlaps with VTI, while the international 40% cost roughly three points of annual return in this cycle. None of that makes VT a bad fund. It makes VT a fund you should hold for a reason you can actually state, not because the word "total" on the label felt like a finished job.
If you've read this far thinking you want to see what your own portfolio looks like under the same lens — the overlap, the real correlations, the drawdown that monthly data hides — that's the right instinct. Run the backtest and check it. Owning the world should be a decision, not an assumption.
Want to test these insights on your own portfolios?
Awalyt is a portfolio analysis platform: backtesting on daily data, fundamental analysis, asset analysis, and AI-powered insights.
Get Started Free