60/40 vs 70/30 vs 80/20: VTI/VXUS Backtest Results (14 Years)
Walk into any investing forum and you'll find the same debate playing out over and over: how much of your portfolio should be in US stocks versus international?
Some swear by 60/40. Others insist 80/20 is the sweet spot. A few claim you should just go 100% US and forget about international entirely.
Opinions are everywhere. Actual data? Much harder to find.
We decided to put these allocations to the test. We backtested all three popular US/International splits over 14 years of real market data, including bull runs, the COVID crash, and the 2022 bear market.
The results might change how you think about this decision.
What We Tested
We built three portfolios using the most common ETF pairing for US/International exposure:
- VTI — Vanguard Total US Stock Market ETF
- VXUS — Vanguard Total International Stock ETF
The three allocations:
- 60/40 — 60% US, 40% International
- 70/30 — 70% US, 30% International
- 80/20 — 80% US, 20% International
We also included SPY (S&P 500) as a benchmark to see how a 100% US allocation would have performed.
Test period: December 2012 – December 2025 (approximately 14 years)
Rebalancing: Once per year
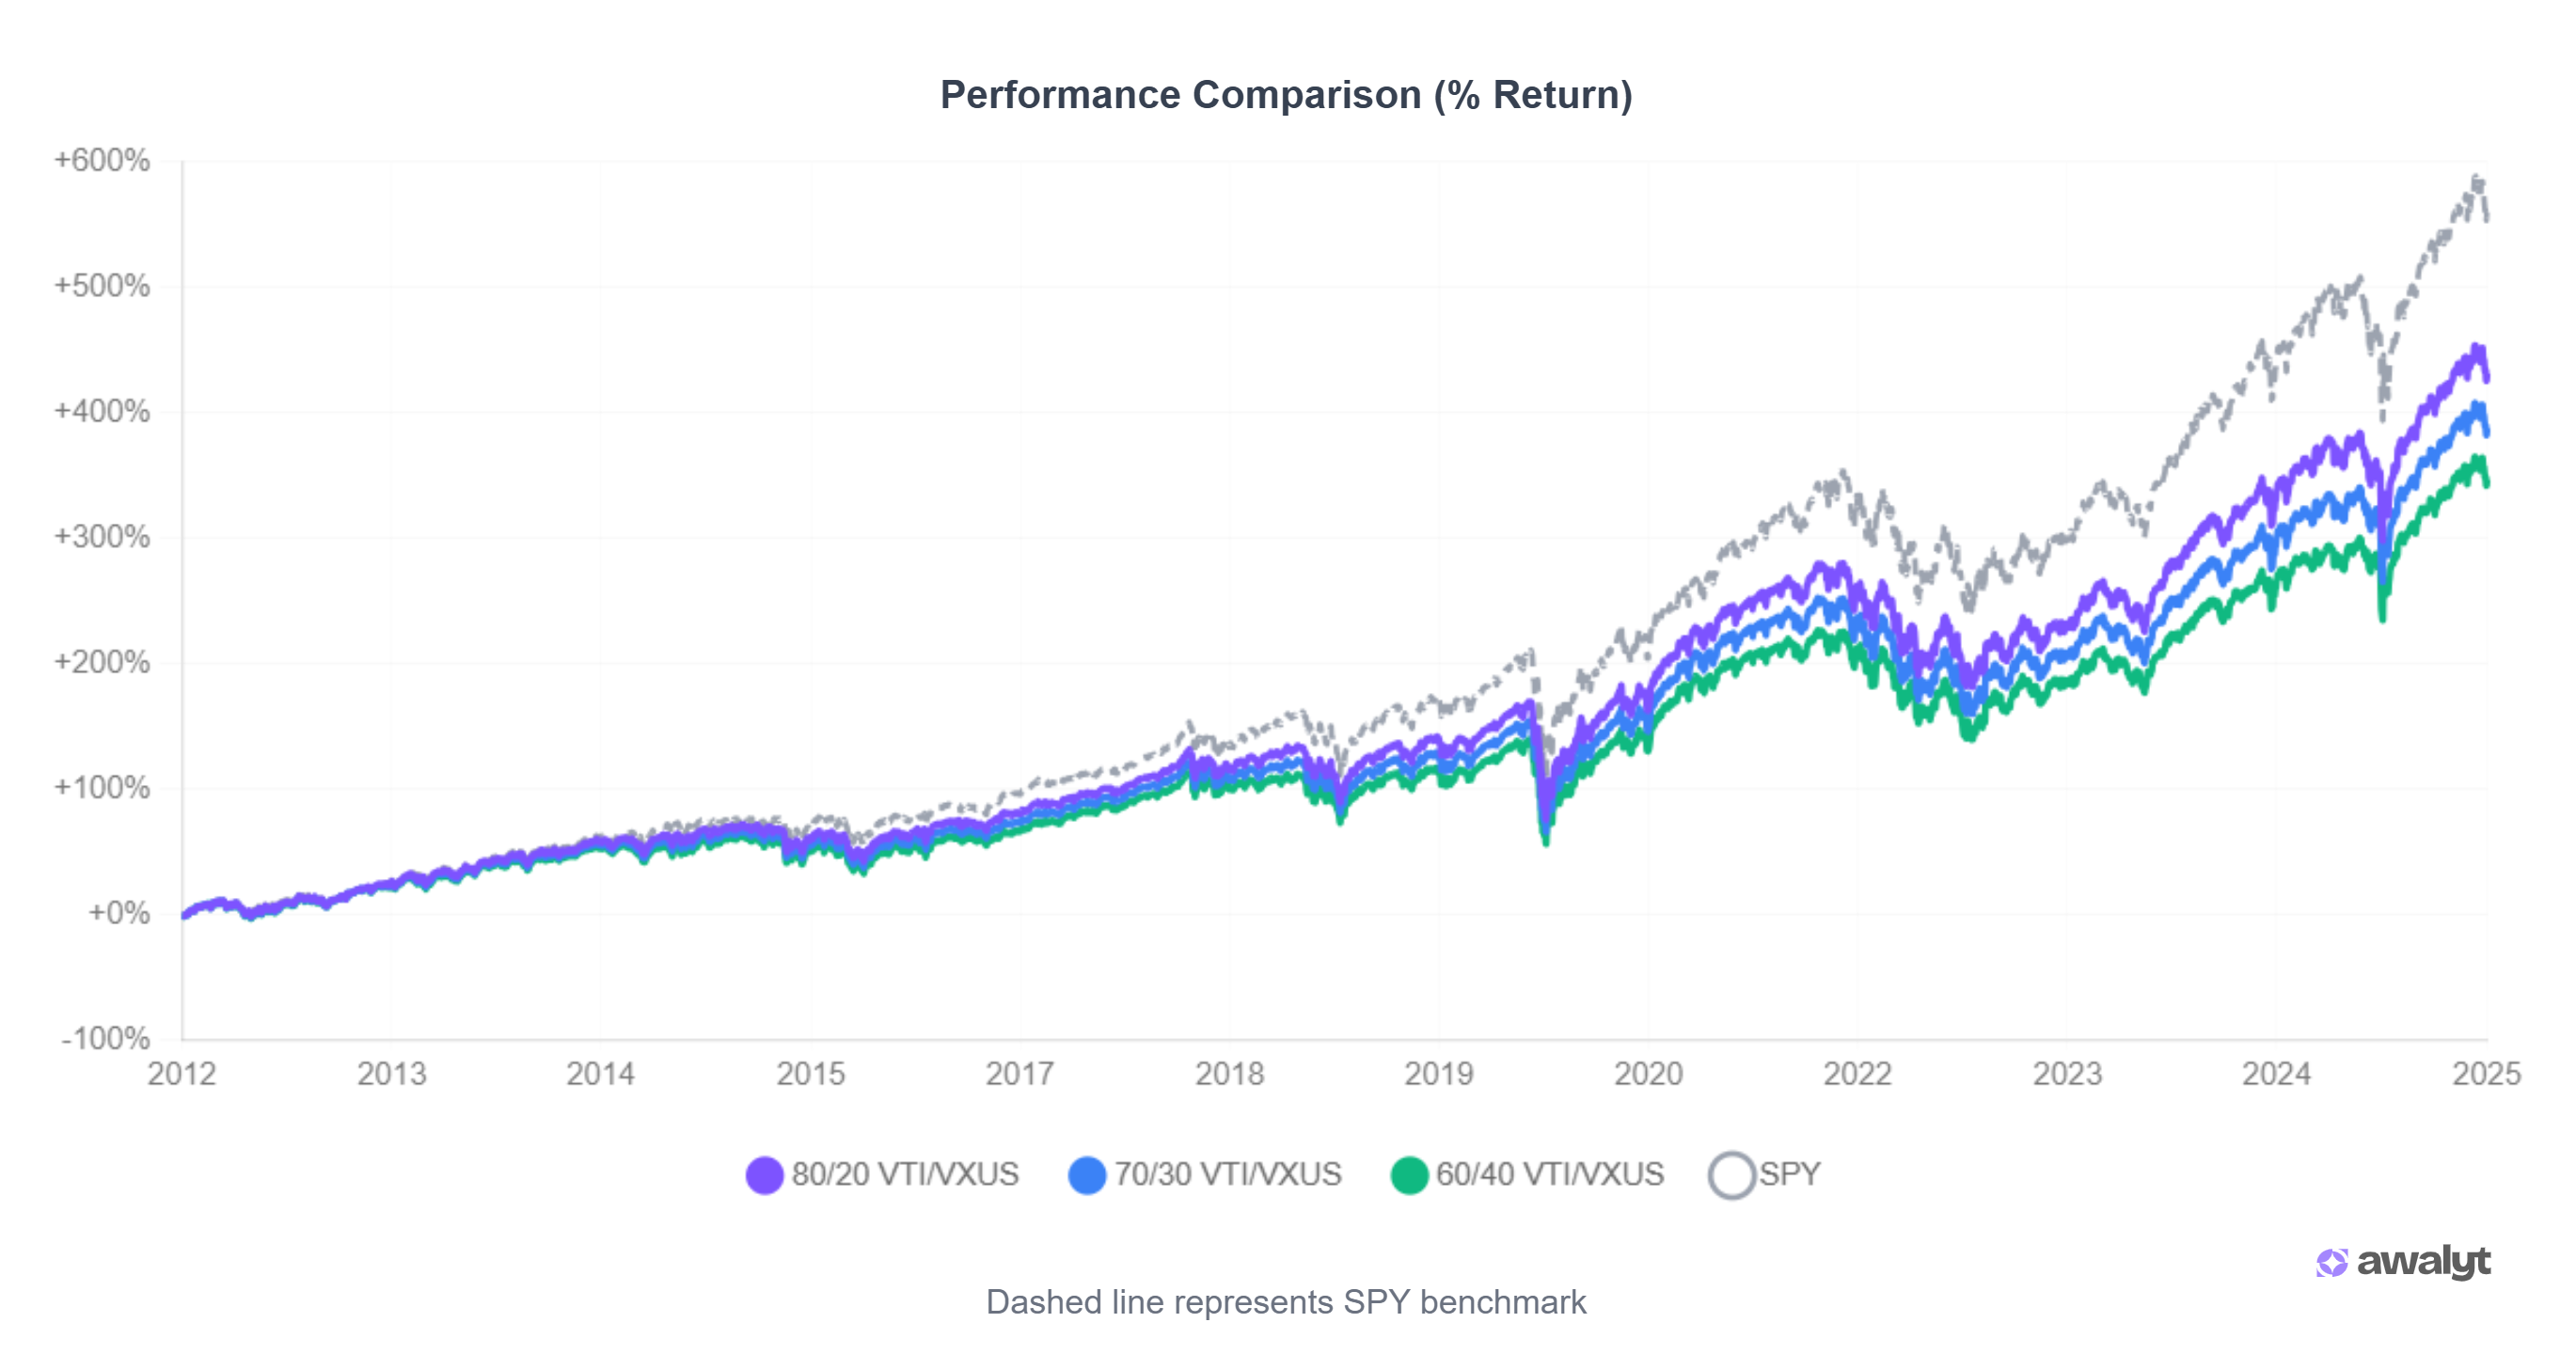
This timeframe captures multiple market regimes: the long post-2012 bull market, the sharp COVID drawdown of March 2020, and the extended 2022 bear market. It's not a cherry-picked window — it's a genuine stress test.
The Results
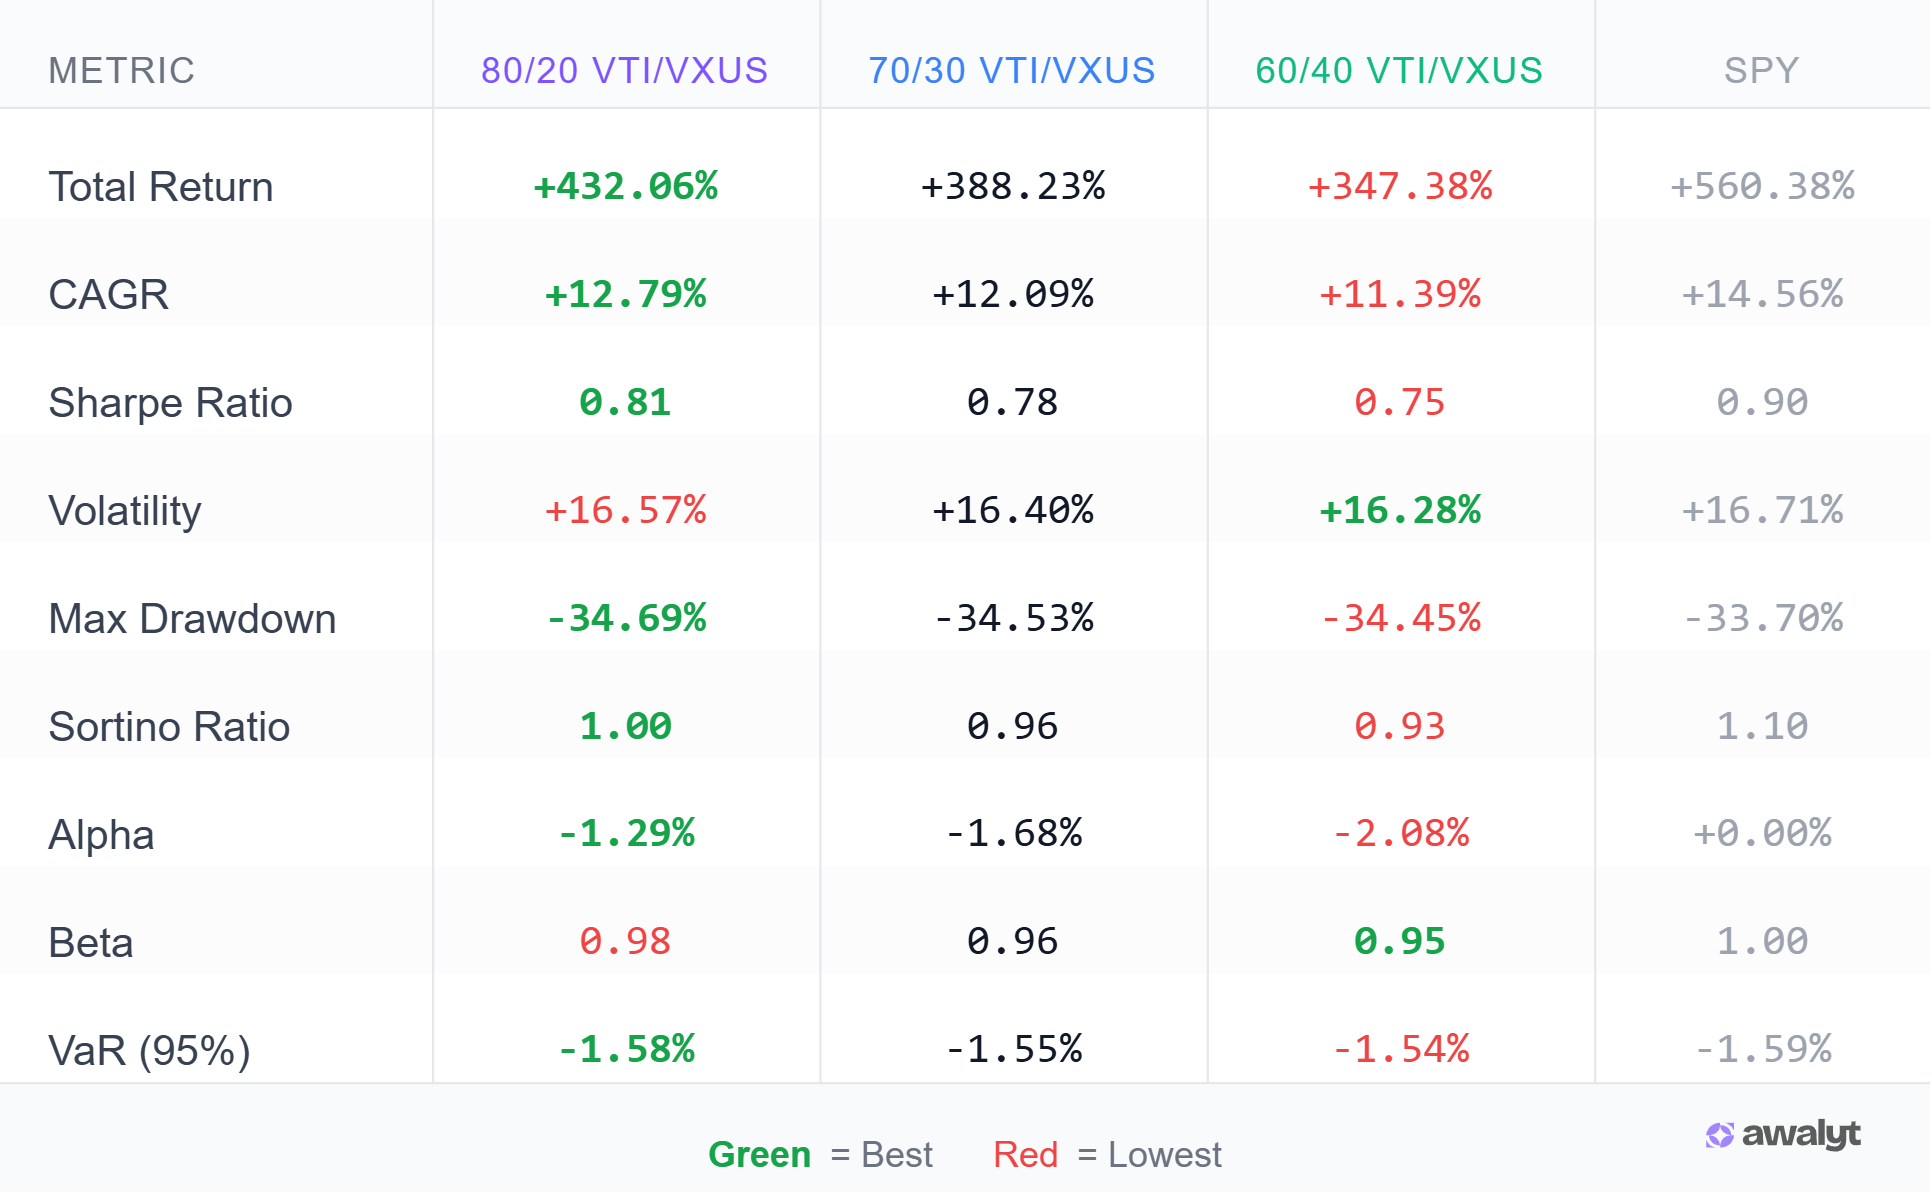
Here's how each allocation performed over the 14-year period:
| Portfolio | Total Return | CAGR | Sharpe Ratio | Max Drawdown | Volatility |
|---|---|---|---|---|---|
| 60/40 | +347.38% | 11.39% | 0.75 | -34.45% | 16.28% |
| 70/30 | +388.23% | 12.09% | 0.78 | -34.53% | 16.40% |
| 80/20 | +432.06% | 12.79% | 0.81 | -34.69% | 16.57% |
| SPY (100% US) | +560.38% | 14.56% | 0.90 | -33.70% | 16.71% |
In dollar terms, $10,000 invested in 2012 would have grown to:
- $44,738 with a 60/40 split
- $48,823 with a 70/30 split
- $53,206 with an 80/20 split
- $66,038 with 100% SPY
The more US exposure, the higher the returns. But that's only half the story.
What the Data Actually Tells Us
At first glance, 80/20 looks like the clear winner. Almost a full percentage point of extra annual return compared to 60/40. Over 14 years, that compounds into a meaningful difference.
But look closer at the risk metrics.
Maximum drawdown — the worst peak-to-trough decline — was virtually identical across all three portfolios:
- 60/40: -34.45%
- 70/30: -34.53%
- 80/20: -34.69%
Volatility tells the same story:
- 60/40: 16.28%
- 70/30: 16.40%
- 80/20: 16.57%
The difference in risk between these allocations is negligible. You're not meaningfully reducing your downside by going 60/40 instead of 80/20. When markets crashed in 2020 and 2022, all three portfolios fell by roughly the same amount.
Here's the counterintuitive finding: SPY actually had the lowest maximum drawdown at -33.70%, slightly better than all three diversified portfolios. In this period, adding international stocks didn't reduce your downside — it increased it marginally while lowering returns.
The Sortino ratio, which specifically measures return per unit of downside risk, confirms this: SPY scored 1.10 compared to 0.93-1.00 for the diversified portfolios.
What you are doing by adding more international exposure is making a bet: a bet that the next 14 years won't look like the last 14.
The Uncomfortable Truth About This Backtest
Here's what the data doesn't tell you: US stocks had an exceptional run from 2012 to 2025.
The S&P 500 crushed international markets during this period. If you had gone 100% US, you would have beaten every diversified portfolio by a wide margin.
But rewind to 2000-2010, and the picture looks completely different. During that decade, international stocks significantly outperformed US stocks. The investors who concentrated in US equities underperformed those who diversified globally.
Nobody knows which regime we're in next.
The point of international diversification was never to maximize returns in every period. It's to avoid catastrophic outcomes if one region underperforms for an extended time.
So Which Allocation Should You Choose?
Based on this data, here's what we can say with confidence:
The difference between 60/40, 70/30, and 80/20 is smaller than most people assume. We're talking about roughly 0.7% annual return per 10% shift in allocation. Meaningful over decades, but not dramatic.
Risk is nearly identical across all three. Don't choose 60/40 thinking you're being "safer." The drawdowns and volatility are almost the same.
Your actual allocation matters less than your consistency. The investor who picks 70/30 and sticks with it for 20 years will almost certainly outperform the investor who switches between allocations chasing recent performance.
If you believe US dominance will continue, lean toward 80/20. If you want to hedge against a potential US underperformance cycle, 60/40 gives you more international exposure. If you want to split the difference, 70/30 is a reasonable middle ground.
None of these choices is wrong. The wrong choice is endlessly optimizing instead of investing.
For the Data Nerds
If you want to dig deeper, here are the advanced metrics:
| Portfolio | Alpha | Beta | Sortino Ratio | VaR (95%) |
|---|---|---|---|---|
| 60/40 | -2.08% | 0.95 | 0.93 | -1.54% |
| 70/30 | -1.68% | 0.96 | 0.96 | -1.55% |
| 80/20 | -1.29% | 0.98 | 1.00 | -1.58% |
| SPY | 0.00% | 1.00 | 1.10 | -1.59% |
The negative alpha across all diversified portfolios tells the story: international exposure was a drag on risk-adjusted returns during this period. Every 10% shift toward international cost roughly 0.4% in annual alpha.
Does this mean international diversification is pointless? No — it means the last 14 years favored US stocks. The next 14 might not.
Key Takeaways
- 60/40, 70/30, and 80/20 all performed within a 1.4% CAGR range over 14 years — significant over time, but not as dramatic as the debates suggest
- Risk metrics (drawdown, volatility) were nearly identical across all three allocations — you're not buying safety with more international exposure
- In this period, 100% US had both higher returns AND lower drawdowns — diversification didn't reduce risk
- 100% US won this period, but history shows that's not always the case
- The best allocation is the one you'll actually hold through the next crash without panic-selling
Stop optimizing. Start investing.
Want to test these insights on your own portfolios?
Awalyt is a portfolio analysis platform: backtesting on daily data, fundamental analysis, asset analysis, and AI-powered insights.
Get Started Free