ChatGPT vs. Reality: We Backtested 3 AI Portfolios for 10 Years
If you ask an AI for investment advice, it sounds incredibly confident. It gives you clever names, perfect percentages, and logical theories. But does "confident" mean "profitable"?
We decided to put AI theory to the test. We asked ChatGPT to design three "diversified, medium-risk" portfolios for a long-term investor. Then, instead of just nodding along, we plugged those exact allocations into Awalyt to run a daily-precision backtest from 2014 to 2026.
The results revealed a crucial lesson: AI is great at organizing concepts, but only historical data reveals how those concepts survive real market stress.
Here is the breakdown of the experiment, the winners, the losers, and the hidden risks the AI didn't warn us about.
The Experiment: 3 AI Strategies
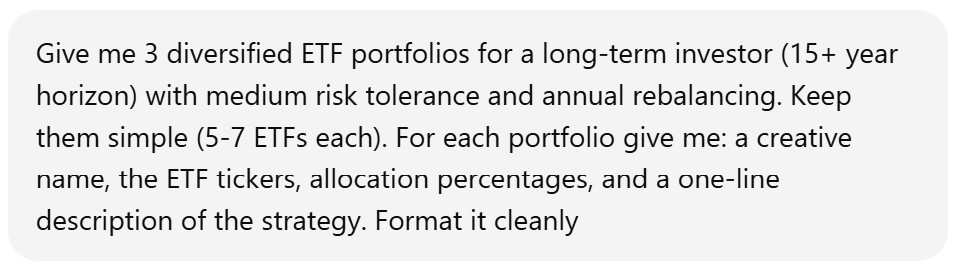
We gave ChatGPT a simple prompt: "Give me 3 diversified ETF portfolios for a long-term investor (15+ year horizon) with medium risk tolerance."
Here are the three distinct portfolios it proposed, which we then replicated in Awalyt:
1. Global Core Navigator
Strategy: A classic "own the whole world" approach with a Value tilt and a stabilizing bond base.
- 35% VTI — US Total Stock Market
- 20% VXUS — International Total Stock Market
- 15% VTV — US Value Stocks
- 15% BND — US Total Bond Market
- 10% BNDX — International Bonds (Hedged)
- 5% VNQ — Global/US REITs
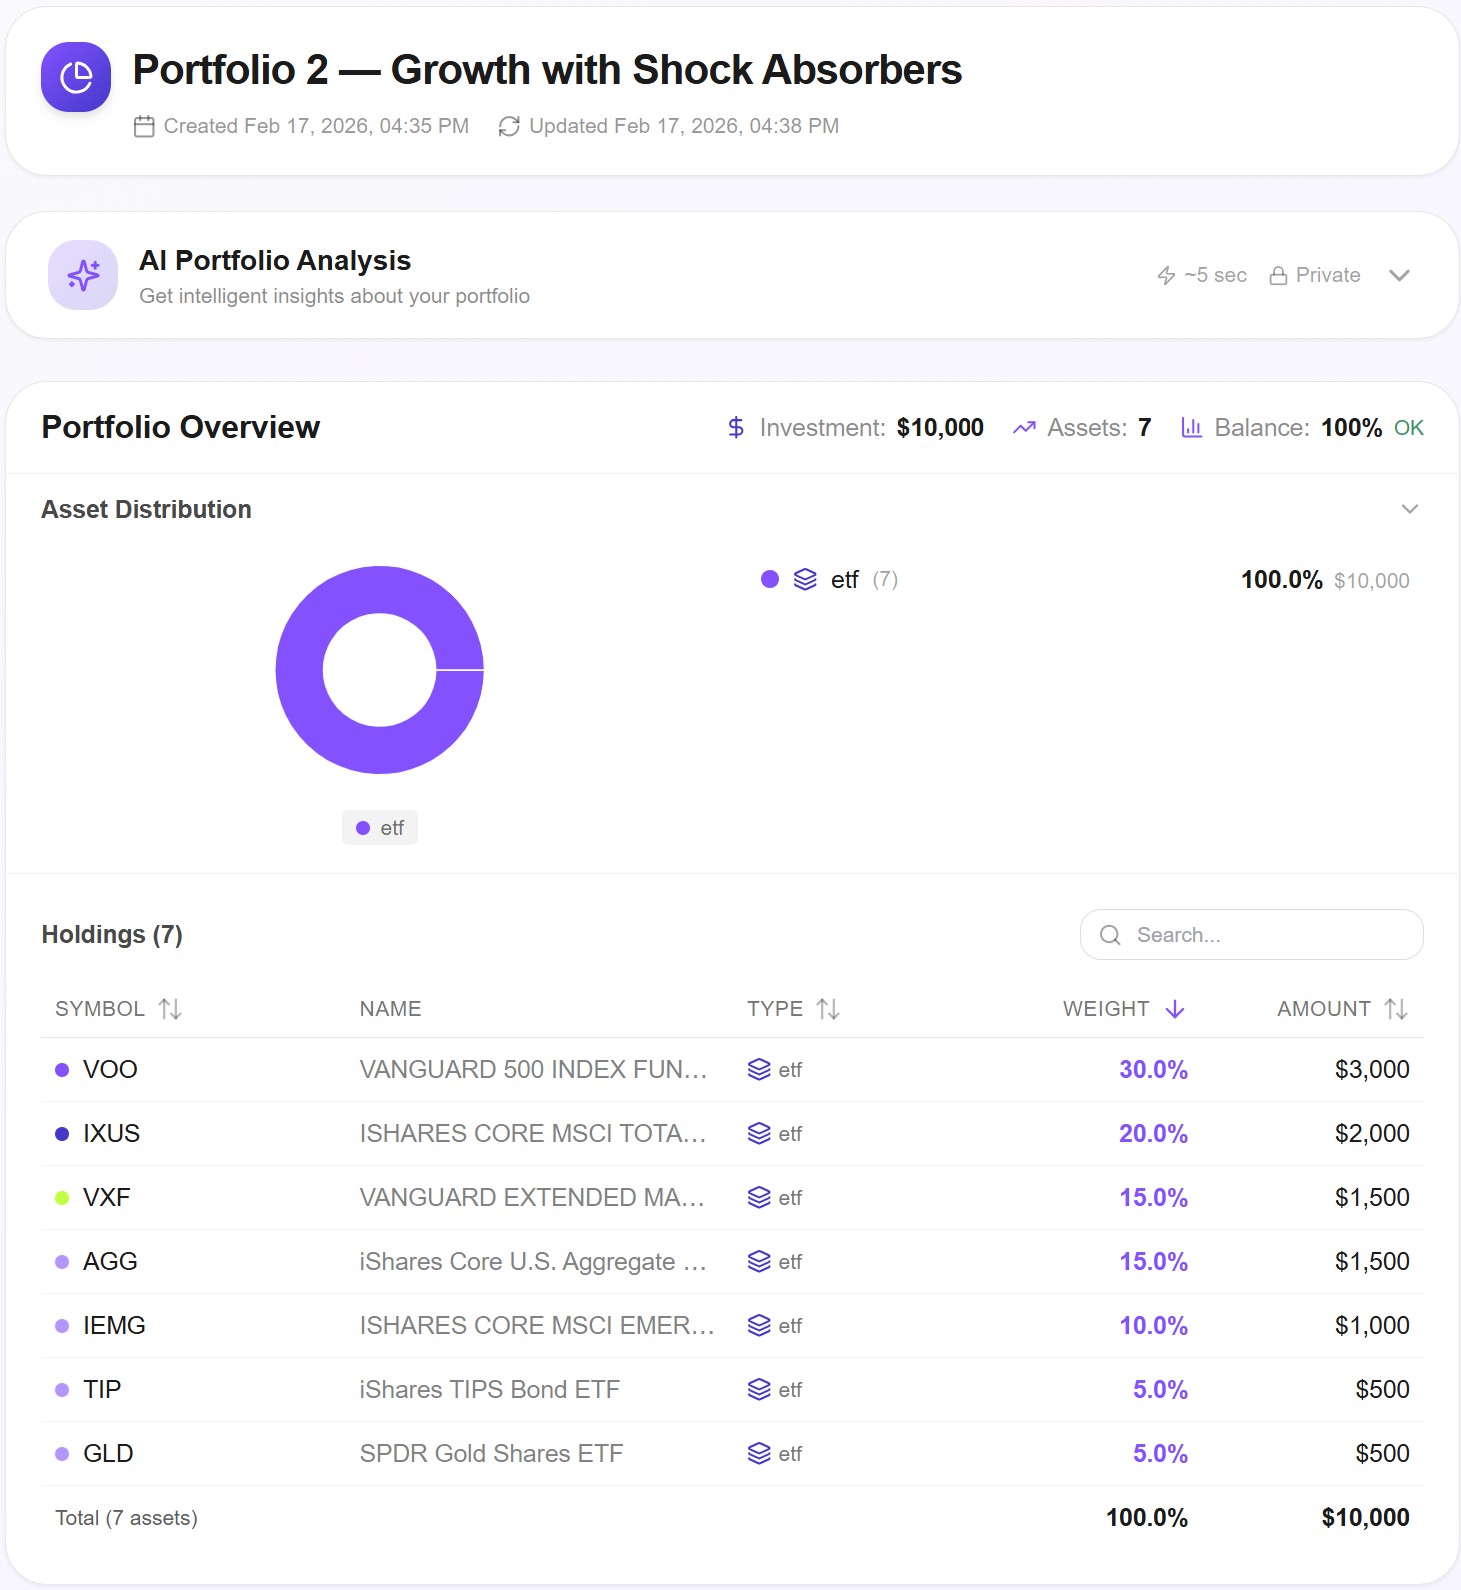
2. Growth with Shock Absorbers
Strategy: Equity-tilted for higher long-term growth, using Gold and Inflation-Protected Bonds as diversifiers.
- 30% VOO — S&P 500
- 20% IXUS — Total International Stocks
- 15% VXF — US Extended Market (Mid/Small Cap)
- 15% AGG — US Aggregate Bonds
- 10% IEMG — Emerging Markets
- 5% TIP — Inflation-Protected Bonds
- 5% GLD — Gold
3. Balanced Factor Explorer
Strategy: A complex, multi-factor mix targeting Small-Cap, Value, and Real Assets.
- 25% VT — Total World Stock Market
- 20% BND — US Total Bond Market
- 15% VBR — US Small Cap Value (Note: Used as a proxy for AVUV for longer history)
- 10% EFV — International Developed Value
- 10% VWO — Emerging Markets
- 10% IGF — Global Infrastructure
- 10% VNQ — REITs
Let's see how they actually performed.
The Results: Who Won the Decade? (2014–2026)
We ran these portfolios through Awalyt's engine, using daily data and annual rebalancing.

The Winner: Portfolio 2 (Growth with Shock Absorbers)
- Total Return: +179.75%
- CAGR: +8.86%
- Sharpe Ratio: 0.73 (Highest)
ChatGPT's "Portfolio 2" was the clear winner. By combining the S&P 500 (VOO) and Extended Market (VXF) with gold (GLD) and inflation-protected bonds (TIP), it captured the massive U.S. bull run while keeping volatility relatively checked.
The Loser: Portfolio 3 (Balanced Factor Explorer)
- Total Return: +138.52%
- CAGR: +7.44%
- Sharpe Ratio: 0.61 (Lowest)
Complexity did not equal performance. This portfolio had the most moving parts—Global Infrastructure (IGF), Real Estate (VNQ), Small-Cap Value (VBR)—yet it delivered the lowest return and the worst risk-adjusted performance. This highlights a classic investing trap: adding more tickers often just adds more fees and drag, not more alpha.
The Benchmark Context
It is important to note that a pure S&P 500 fund (SPY) returned +363% over this period. However, SPY came with a massive 33% drawdown. The AI followed our "medium risk" instruction well: all three portfolios kept drawdowns between 26% and 30%, significantly cushioning the crash compared to the broader market.
Deep Dive: When Diversification Fails (The 2022 Crash)
The most valuable insight from this backtest wasn't the total return—it was the correlation breakdown.
Awalyt allows us to look "under the hood" at specific quarters to see if assets are actually diversifying risk or just pretending to. The 2022 bear market provided the perfect stress test.
Portfolio 2: The Gold Illusion
In Portfolio 2, Gold (GLD) is supposed to be the "shock absorber."
- Q2 2022: It worked. Stocks fell, and Gold had a negative correlation with the S&P 500 (-0.55). It zigged when the market zagged.
- Q3 2022: It failed. The correlation flipped to positive (+0.24).
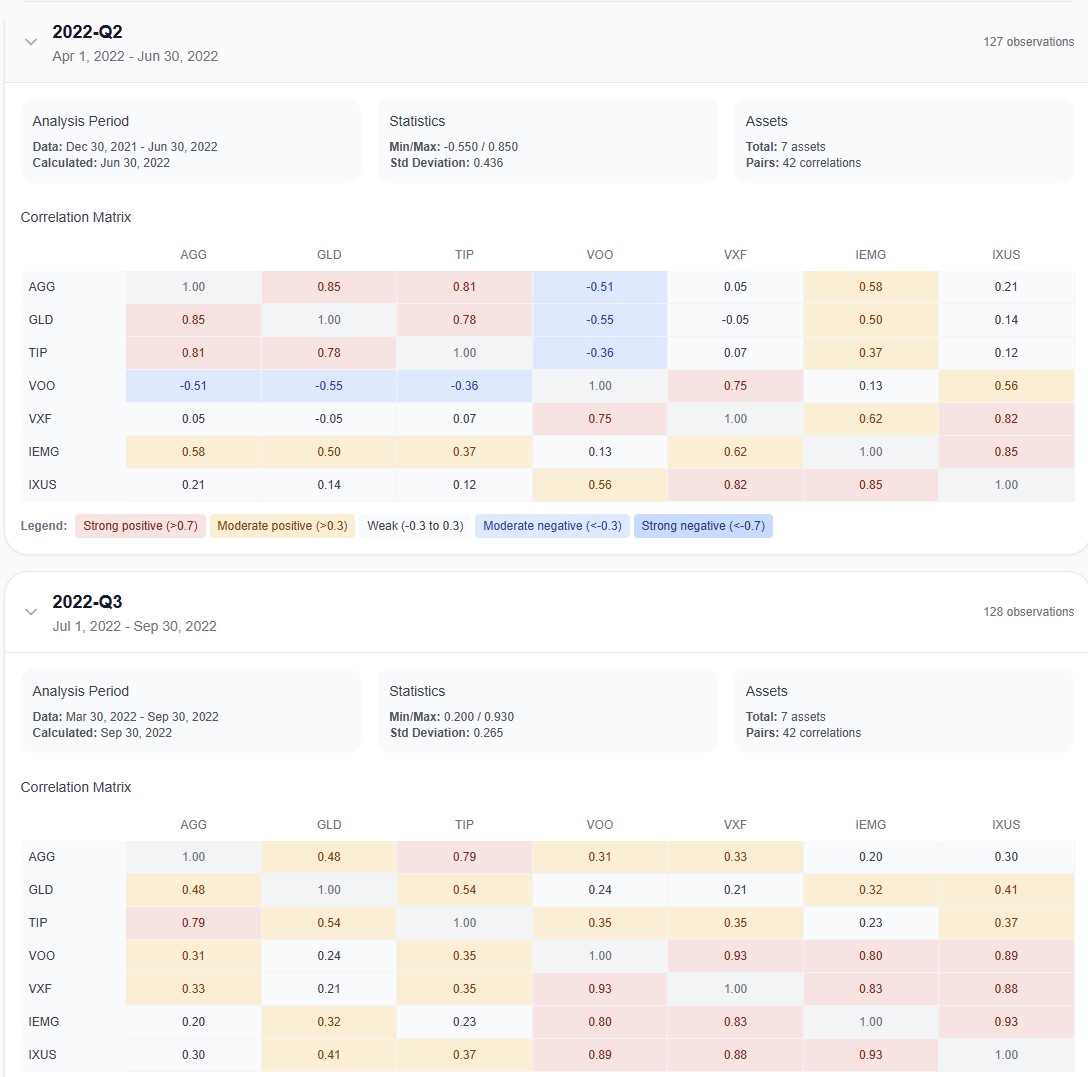
This is the danger of static models. In Q3 2022, rising interest rates hammered everything—stocks, bonds, and gold simultaneously. An AI text generator won't tell you that correlations are dynamic; only a backtest reveals that your safety net might vanish exactly when you need it.
Portfolio 1: No Place to Hide
Portfolio 1 relied on Total Bond Market (BND) and Real Estate (VNQ) for stability.
- Q2 2022: BND provided decent diversification (correlation of -0.32 with VTI).
- Q3 2022: The correlation flipped positive (+0.32).
- Real Estate (VNQ): Highly correlated with stocks in both quarters (>0.79), offering almost no diversification benefit despite being a different "asset class."
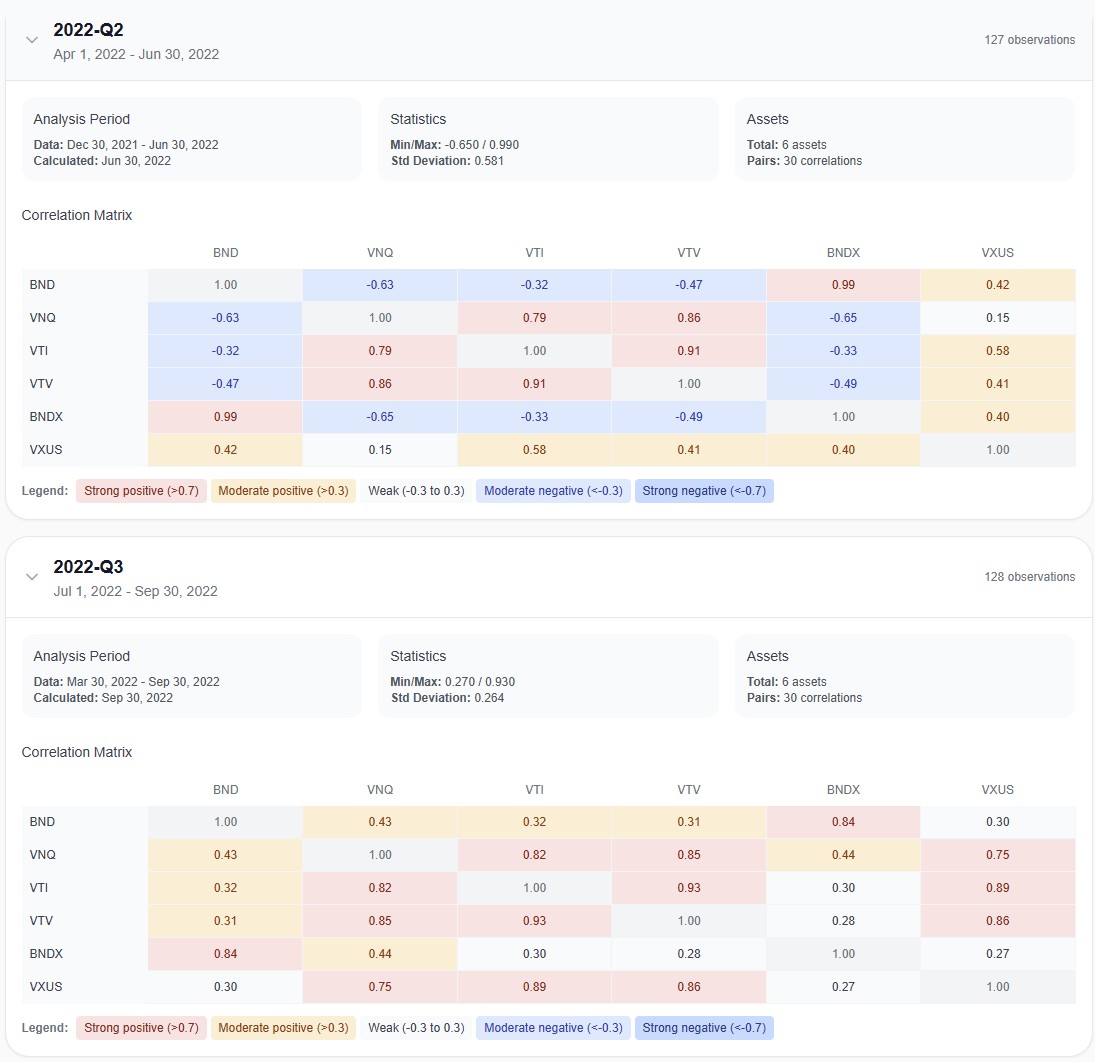
This reveals why the "Global Core" strategy struggled to gain momentum. Its diversifiers (Bonds and REITs) often moved in lockstep with equities during the worst drawdown periods, failing to provide the promised cushion.
Key Takeaways for DIY Investors
-
"Medium Risk" has a cost. ChatGPT successfully lowered risk (volatility was ~12-13% vs SPY's ~17%), but the cost was missing out on roughly half the gains of the S&P 500 over the last decade. You must decide if that trade-off is worth it for your goals.
-
Complexity is a bug, not a feature. Portfolio 3 was the "smartest" looking portfolio on paper, full of factor tilts and alternative assets. In reality, it was the worst performer. Simple exposure to broad growth (Portfolio 2) beat complex factor engineering.
-
Trust Data, Not Narratives. ChatGPT creates portfolios based on narratives ("Gold protects against inflation," "Bonds stabilize stocks"). Awalyt analyzes portfolios based on math. As we saw in 2022, the narrative often breaks down when market dynamics shift.
Final Verdict
The "Growth with Shock Absorbers" (Portfolio 2) is the only AI suggestion we would consider viable for a modern investor, provided you understand that gold and bonds are not perfect shields.
Before you commit your capital to a strategy generated by a chatbot, you need to verify it. Don't just read the theory—simulate the reality.
Want to test your own AI-generated strategy? Backtest any portfolio with daily-precision data on Awalyt.
Want to test these insights on your own portfolios?
Awalyt is a portfolio analysis platform: backtesting on daily data, fundamental analysis, asset analysis, and AI-powered insights.
Get Started Free