Research Any Stock. Understand It in 30 Seconds.
10 years of financial statements, rolling TTM trends, historical valuation, and an AI-powered assessment that tells you what the numbers actually mean.
Built for investors who want to understand companies, not just collect data.
Most Research Tools Give You Data. Not Answers.
Free tools show you a P/E ratio and nothing else. Data sites give you tables of numbers with no context. Professional terminals hand you 5,000 filters and assume you know what to do with them. But none of them answer the question you actually have: is this company fundamentally healthy, and is the stock reasonably priced?
You shouldn't need a finance degree to understand whether a stock is worth researching further.
AWALYT combines 10 years of financial data with AI that reads the numbers and explains what they mean — growth trajectory, margin quality, valuation context, and key risks. One page. One assessment. No guesswork.
What You See with AWALYT Fundamentals
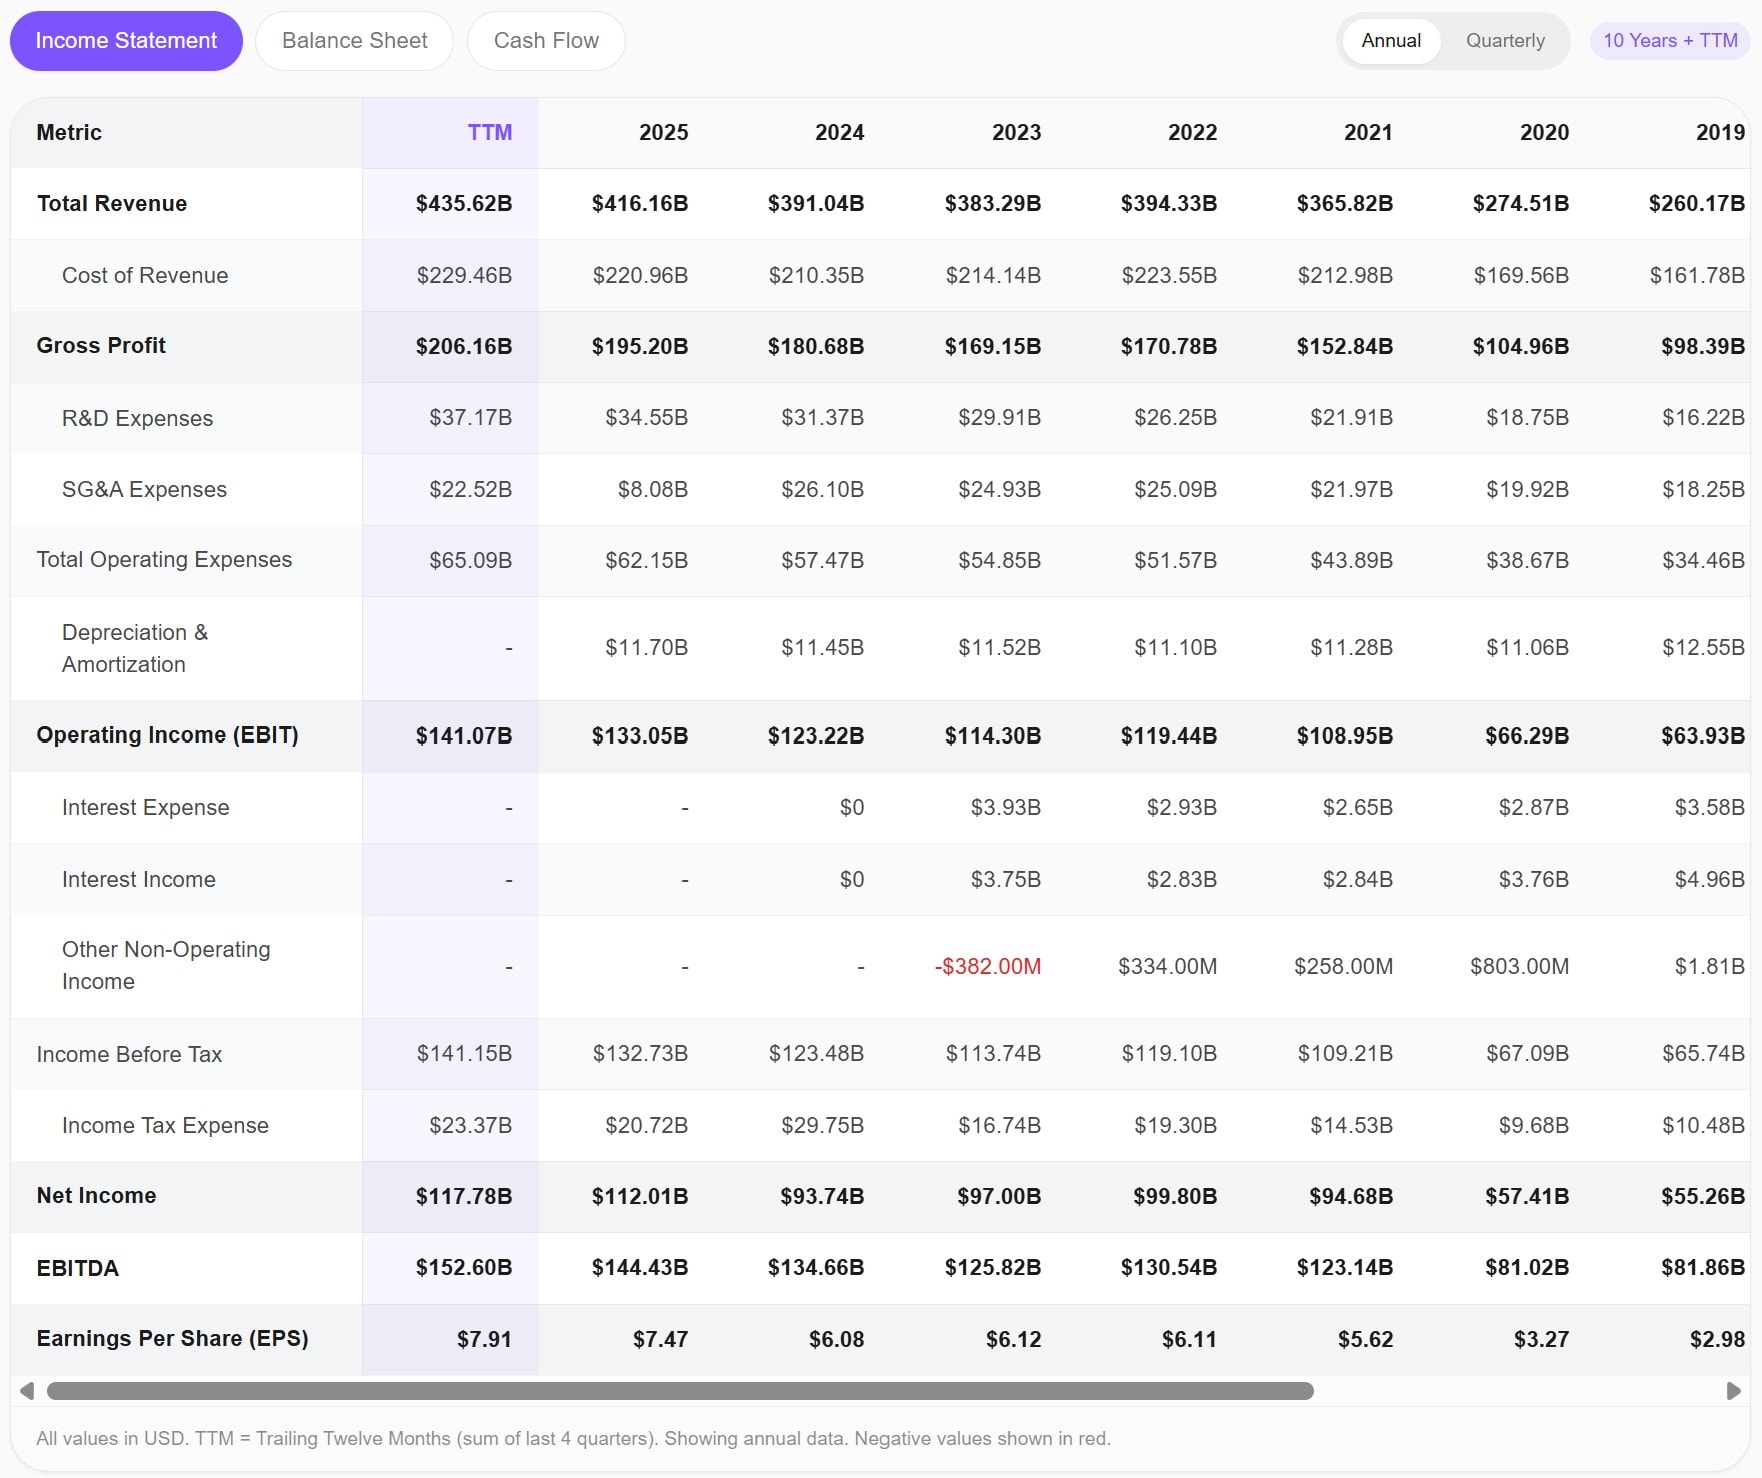
10 years of financial statements in one view
Income statement, balance sheet, and cash flow — annual, quarterly, or 10 years with TTM. Every line item from total revenue down to earnings per share, formatted clearly and ready to analyze. No paywall for historical depth.
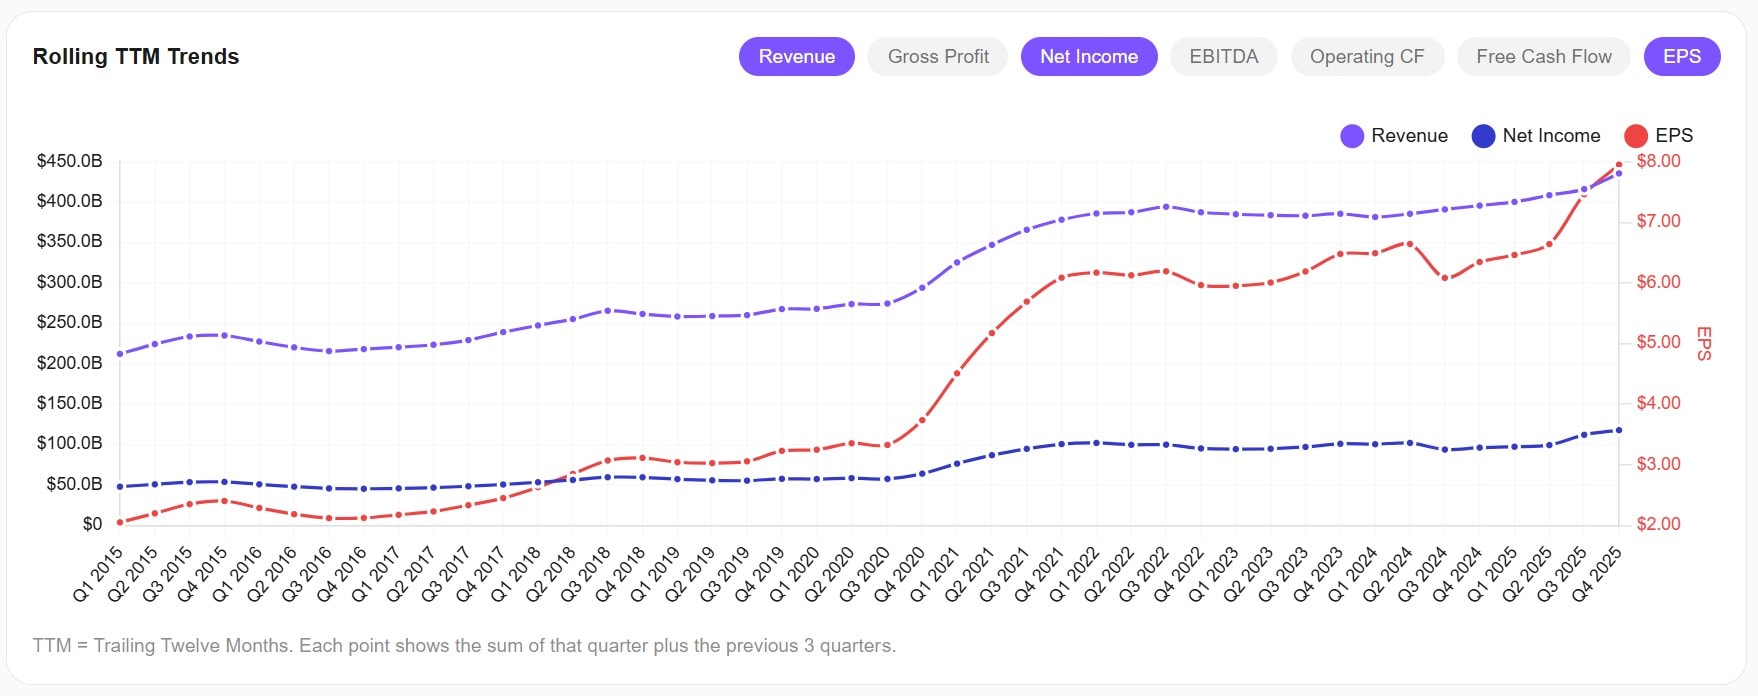
Rolling TTM trends reveal what annual data hides
Annual snapshots miss the story between the numbers. AWALYT's rolling TTM charts show revenue, earnings, and cash flow on a quarterly rolling basis over 5 years — so you can see exactly when growth accelerated, when margins compressed, and where the inflection points were.
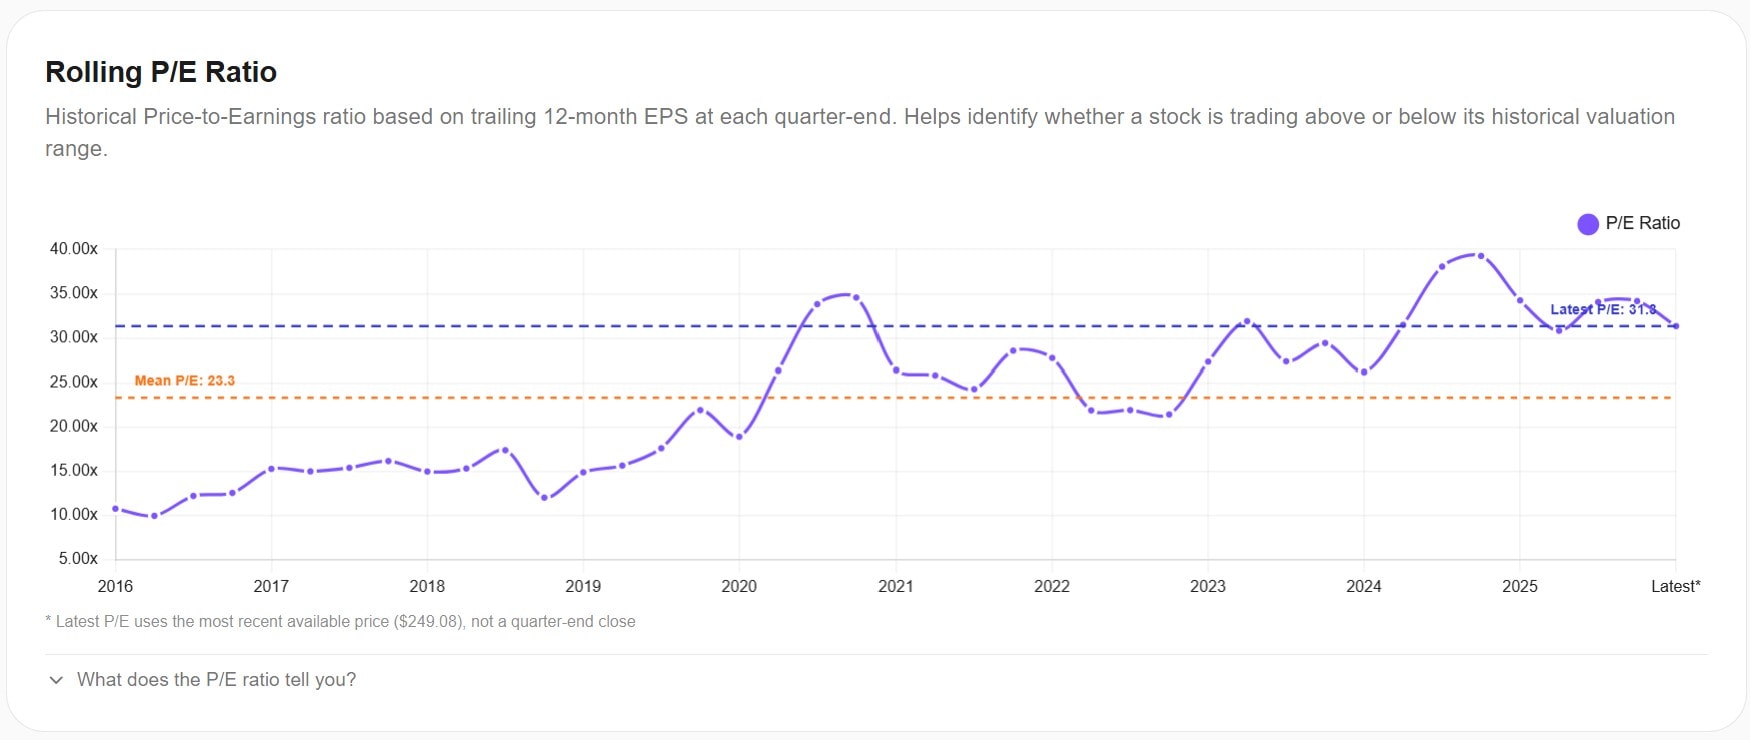
See if the stock is cheap or expensive — historically
A single P/E number is meaningless without context. AWALYT plots the trailing P/E at every quarter-end over the past 10 years, alongside the historical mean. You can instantly see whether today's valuation is elevated, compressed, or in line with what the market has historically paid for these earnings.
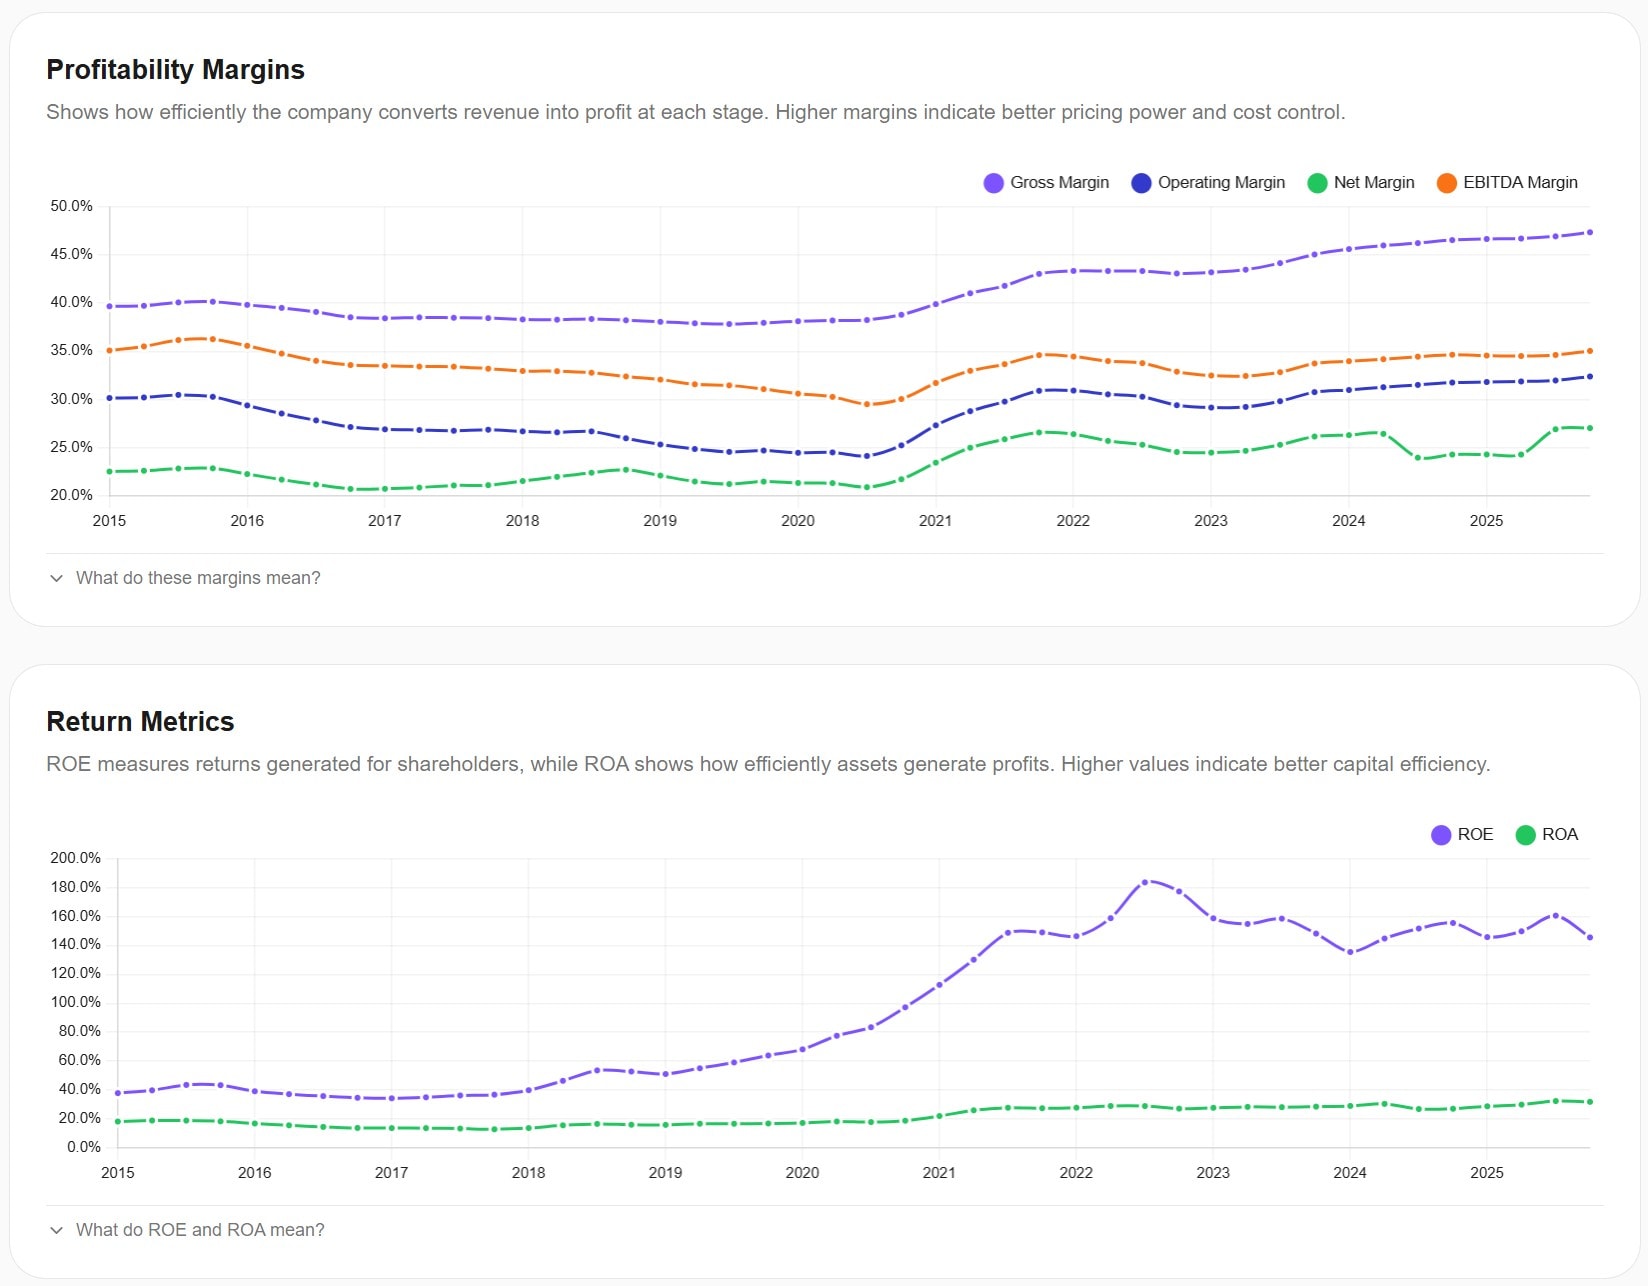
Track profitability and returns across a decade
Margins tell you how efficiently a company turns revenue into profit. AWALYT charts gross, operating, net, and EBITDA margins plus ROE and ROA over 10 years of quarterly data — so you can see whether the business is getting better, getting worse, or just cycling with the economy.
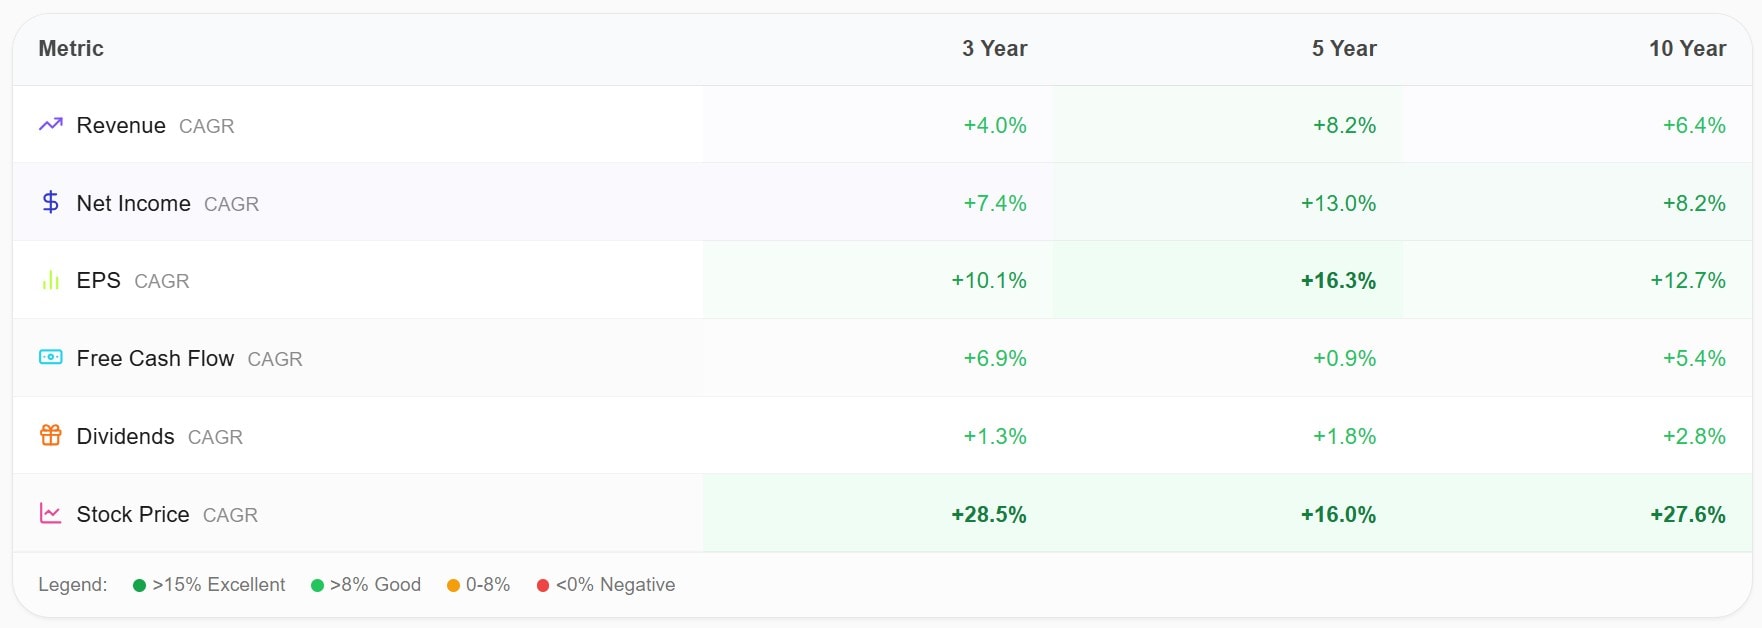
Growth at every time horizon, color-coded
Revenue grew 4% over 3 years but 8.2% over 5 years — is growth decelerating or was there a temporary dip? AWALYT's growth table shows CAGR at 3, 5, and 10-year horizons for six key metrics, color-coded from green (strong) to red (negative), so the trend jumps out immediately.
From Ticker to Insight in 3 Steps
Search Any Stock
Type a ticker or company name. AWALYT pulls the full financial profile — market cap, P/E, EPS, dividend yield, sector, and company description.
Explore the Data
Navigate through financial statements, rolling TTM trends, profitability ratios, historical valuation, growth rates, and insider activity — all in one place.
Read the AI Assessment
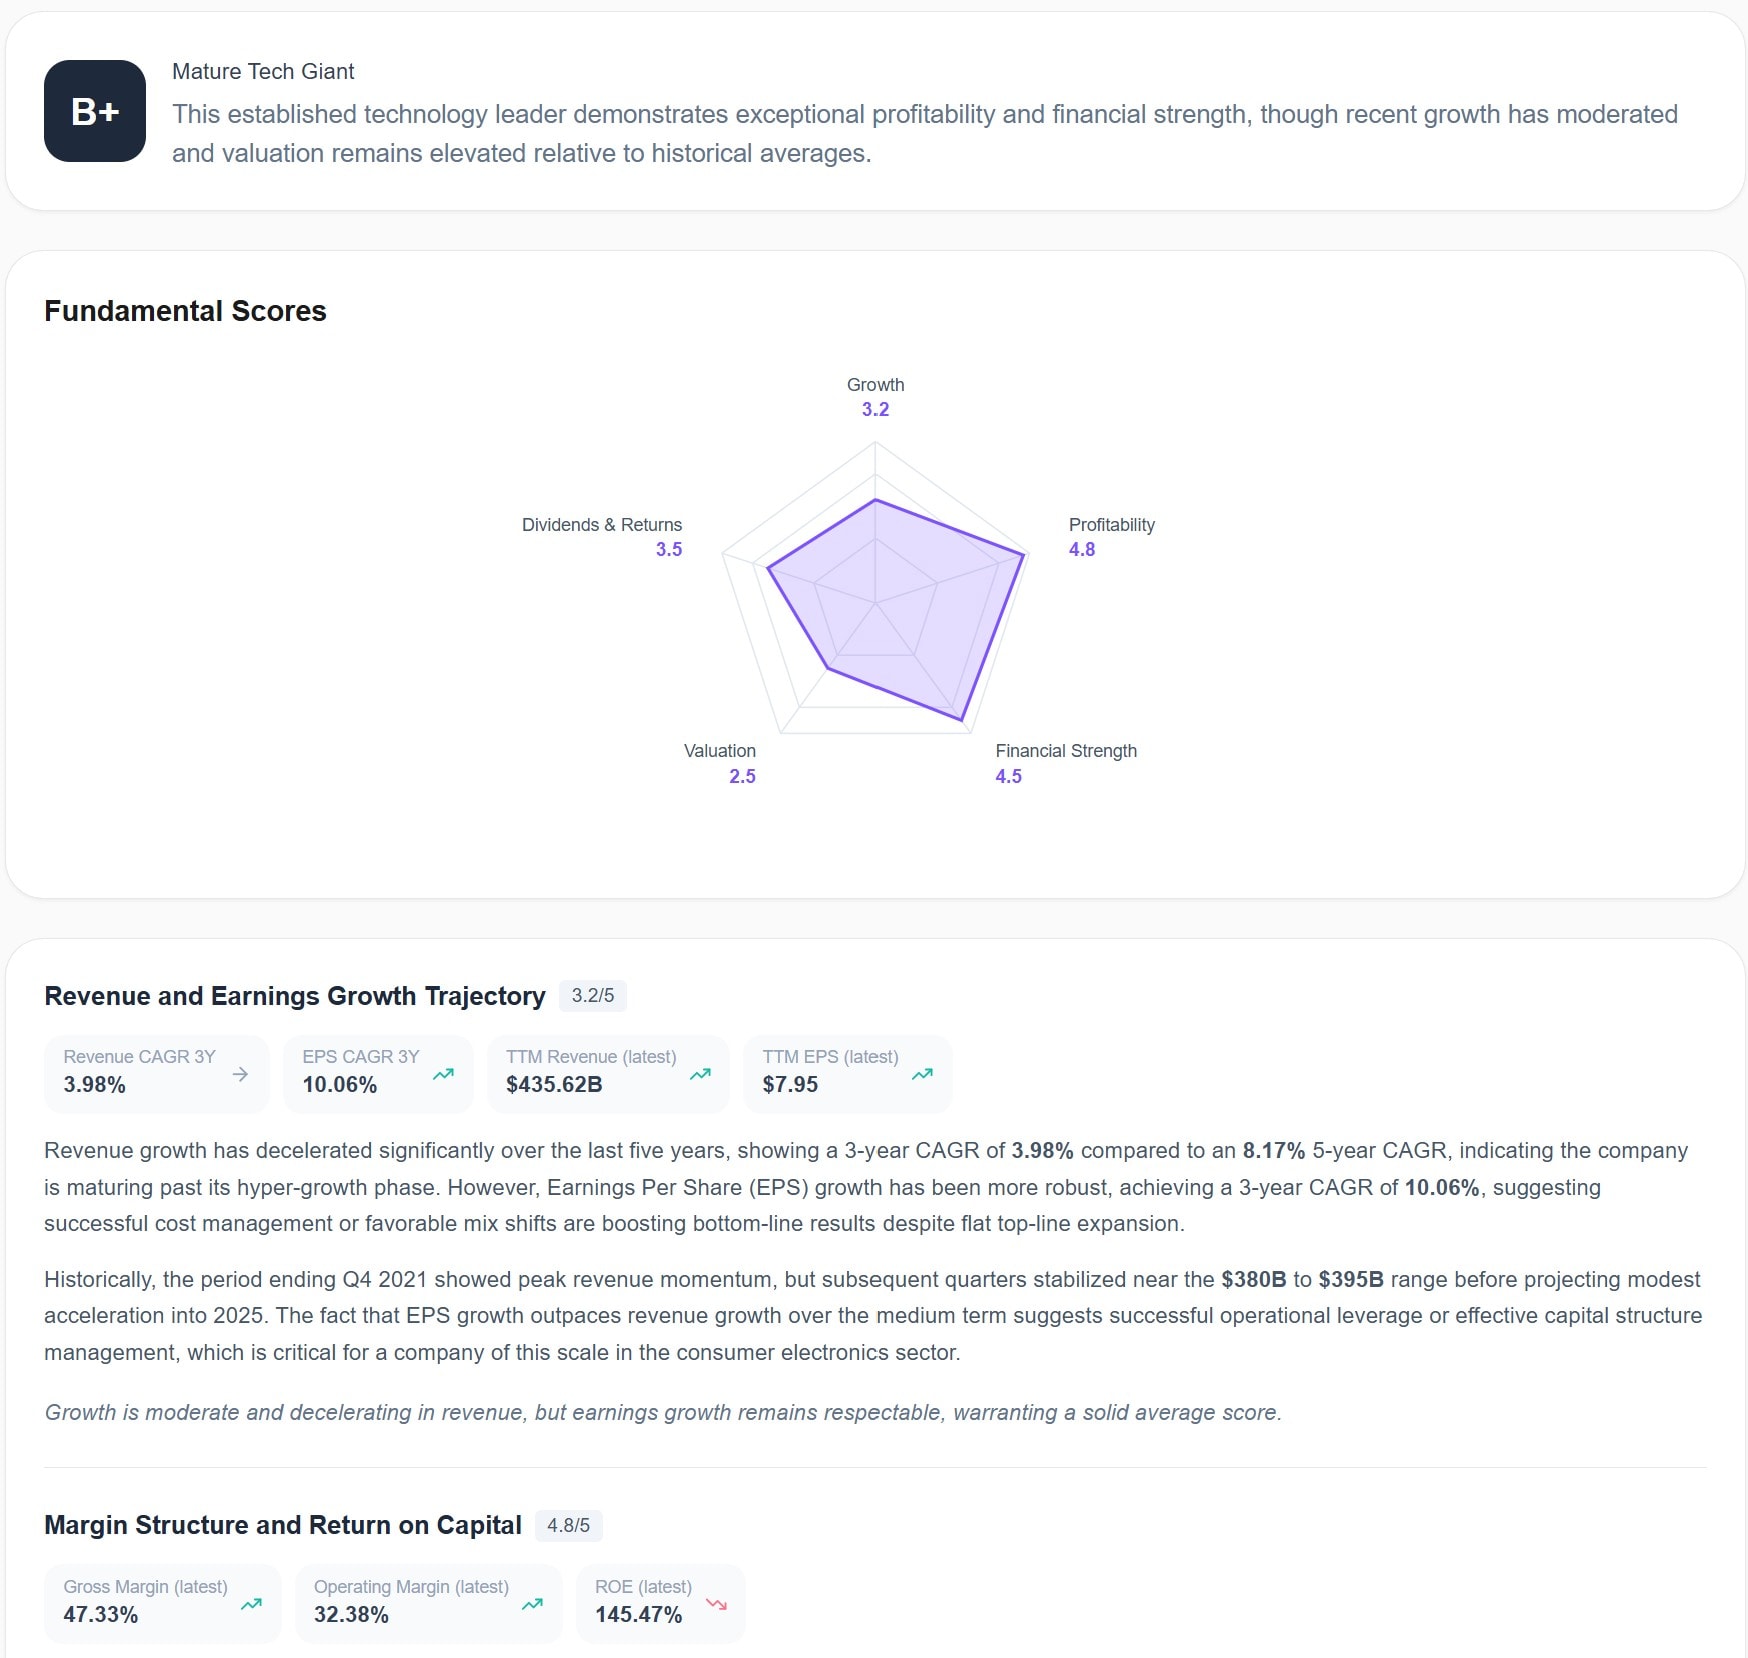
The AI analyzes the actual financial data and delivers a structured assessment: pentagon scores, overall grade, key metrics, strengths, risks, and a plain-language verdict.
Why Investors Choose AWALYT for Research
| What Matters | Other Tools | AWALYT |
|---|---|---|
| Financial statements | 5 years or paywalled | 10 years + TTM, no paywall |
| Rolling TTM trends | Not available | 5 years of quarterly-resolution data |
| Historical P/E | Current only or basic chart | 10-year rolling P/E with historical mean |
| AI analysis | None or generic chatbot | AI grounded in verified financial data |
| Growth summary | Single timeframe or manual calculation | 3Y, 5Y, 10Y CAGR for 6 metrics, color-coded |
| Beyond fundamentals | Separate tools for backtesting, portfolio tracking | Backtesting, ETF analysis, portfolio monitoring — all included |
| Price | $200–$500/year | Free, or $119/year all-in |
10 Years
Financial statement history
5 Dimensions
AI pentagon scoring
$0
Free to start
“All financial data comes from official SEC filings. The AI reads real numbers, not estimates or scraped data. Every metric, every ratio, every trend you see on AWALYT is grounded in verified source data.”
Frequently Asked Questions
Yes — Awalyt has a Free plan, free forever, no credit card. Premium is $119/year with everything included.
AWALYT sources financial data from official SEC filings via Alpha Vantage. All financial statements, ratios, and growth metrics are computed from reported quarterly and annual data — not estimated or scraped from third parties.
AWALYT's AI reads the actual financial data from the platform — real revenue, real margins, real P/E ratios computed from SEC filings. It cannot hallucinate because it works exclusively with verified numerical data. Generic AI tools have no access to current financials and frequently make up numbers.
Up to 10 years of annual financial statements plus Trailing Twelve Month (TTM) data. Rolling TTM trends show 5 years of quarterly-resolution data (20 data points), giving you a much more granular view than annual snapshots alone.
The pentagon scores rate a company across 5 dimensions — Growth, Profitability, Financial Strength, Valuation, and Dividends & Returns — each on a 0 to 5 scale. The AI computes these scores by analyzing the full 5-year rolling dataset. An overall letter grade (A+ to D) summarizes the fundamental picture.
Yes. AWALYT is an all-in-one investment analysis platform. In addition to fundamental analysis, it includes a portfolio backtesting tool with daily data precision, portfolio monitoring, and AI-powered analysis across all modules.
Stop guessing. Start researching.
Create a free account and analyze your first stock today.
Get Started Free