The Best Way to Analyze Portfolio Risk [2026]
Two investors put $10,000 into the same six funds and leave it for fourteen years. One barely thinks about it. The other watches every dip, second-guesses the plan through the rough patches, and eventually sells near a bottom. Same portfolio, same returns on paper, completely different outcomes — because one of them was carrying more risk than they could actually hold.
That gap is what risk analysis is supposed to close. Not the risk in a textbook, but the risk that decides whether you stay invested when it stops being fun. Ask most DIY investors how risky their portfolio is and you'll hear a number about past performance, which is roughly the one thing risk isn't.
So how do you measure it? Not with a single metric, but on three levels: how each asset behaves on its own, how those assets move together, and what the whole portfolio looks like once you account for both. To make it concrete, I backtested a six-ETF portfolio over 14.4 years against the S&P 500. It trailed the index on raw return, and that turns out to be exactly why it's a good teaching case.
The analysis below is for educational purposes only and is not investment advice. Past performance doesn't guarantee future results. The portfolio shown is an illustration, not a recommendation; your own risk depends on which assets you hold and how much you allocate to each.
The portfolio behind this guide
I'll use one portfolio throughout to show each level in action. Six funds, tilted toward US equities but with real ballast underneath: VOO 35%, QQQ 15%, VXUS 15%, BND 15%, SCHD 10%, GLD 10%. I ran it in Awalyt as a Constant Mix, rebalanced every six months, from January 2012 to June 2026: 14.4 years of daily data.
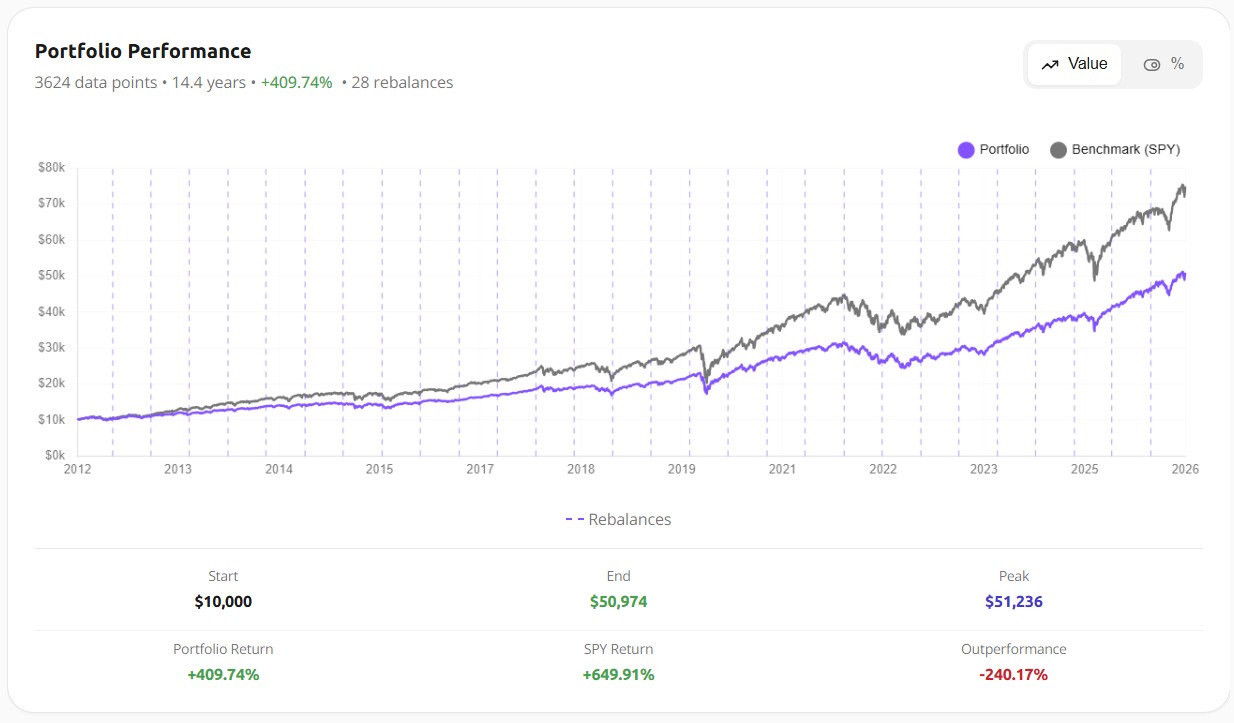
The honest headline: it trailed the S&P 500 by about 240 percentage points, but it did so with noticeably less volatility and a shallower drawdown. That trade, less return for a calmer ride, is the whole reason risk is worth analyzing properly. The full numbers come in Level three; first, the vocabulary you need to read them.
How to measure risk: four numbers that matter
Risk has a behavioral definition and a measurable one, and good analysis connects them. The behavioral version is simple: risk is the chance you abandon the plan at the worst possible time, or take a loss you can't recover from. The measurable version is a handful of metrics, each capturing a different slice of that.
Volatility is the spread of returns around the average: how much the value swings from one stretch to the next. It's the most quoted risk number and the most misunderstood, because it treats a sharp gain exactly like a sharp loss. A fund that doubles overnight is "volatile" by this measure, which isn't the kind of risk anyone loses sleep over.
Drawdown fixes that blind spot. It measures the fall from a previous peak to the following trough, and how long the recovery takes. This is the number that predicts behavior — nobody panic-sells over standard deviation, they panic-sell because the account is down 25% and has been for eight months.
Correlation is the portfolio-level lens, and the one most retail investors skip. It measures whether your holdings fall at the same time. Owning ten funds means nothing if all ten drop together in a crisis.
Risk-adjusted return ties it together. Sharpe, Sortino, and Calmar all ask one question in different ways: how much return did you earn per unit of risk taken? This is what stops "low volatility" from becoming a goal in itself — cash has almost no volatility and almost no return; that's not a good portfolio, it's a mattress.
Level one: each asset's risk on its own
Before you can judge a portfolio, you need to know how each piece behaves alone. Awalyt's Asset Analysis runs the same engine that powers backtests across individual instruments, so you can line them up on every metric at once.
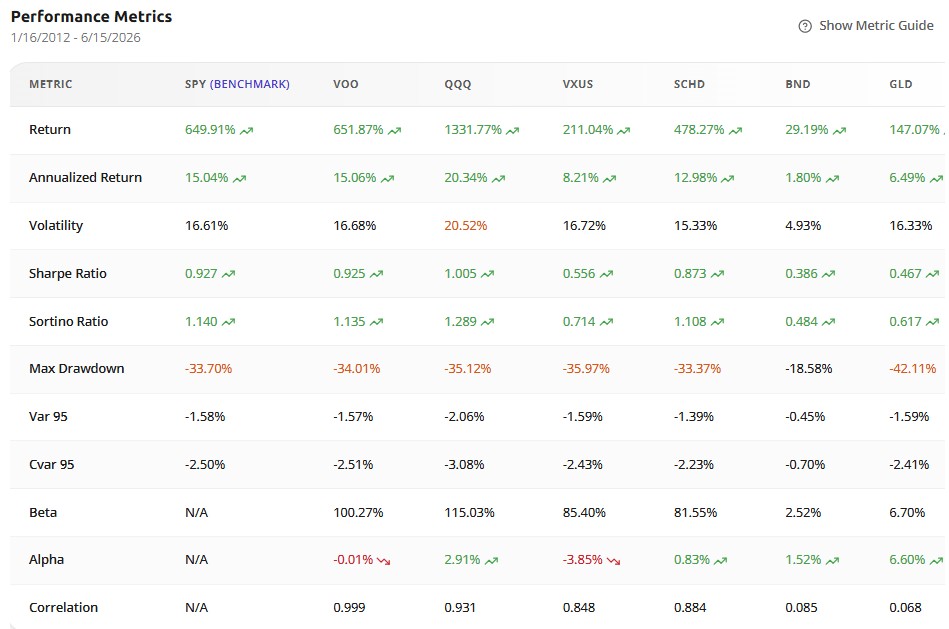
Most of this reads the way you'd expect. QQQ returned the most, +1,331%, and was the most volatile at 20.5%. BND barely moved in either direction: 4.9% volatility, a shallow -18.6% drawdown, the lowest returns. Standard stuff.
Then there's GLD, and it breaks the intuition most people carry about risk. Gold had the worst standalone drawdown in the entire group — -42%, deeper than the S&P 500's -34% — yet it's the single asset that most reduced the portfolio's overall risk. The reason is in the last column: GLD's correlation to the S&P is 0.07. It barely moves with the market, so when stocks fell, gold was usually off doing something else.
This is the single most useful thing I can show someone learning to read risk. An asset's danger in isolation tells you almost nothing about what it does inside a portfolio. A volatile, scary-looking holding with low correlation can lower your total risk; a tame one that moves in lockstep with everything else adds nothing. You can see the same effect in our gold diversification backtest, where a volatile metal earns its place precisely because it zigs when equities zag.
BND tells the quieter version of the same story: 0.09 correlation, low volatility, the ballast that holds the line when equities wobble.
Level two: how your assets move together
There's a trap the asset table can't show you. Of the six funds, four are equity: VOO, QQQ, VXUS, SCHD. On their own they look like four different bets. In practice they tend to fall together, which means the "six-ETF portfolio" is really closer to two positions: a big equity block, plus the bond-and-gold ballast.
Awalyt's backtesting engine builds a correlation matrix for every quarter of the test, so you can watch this directly instead of trusting one averaged number. Look at the third quarter of 2018, as markets started wobbling ahead of that December's selloff.
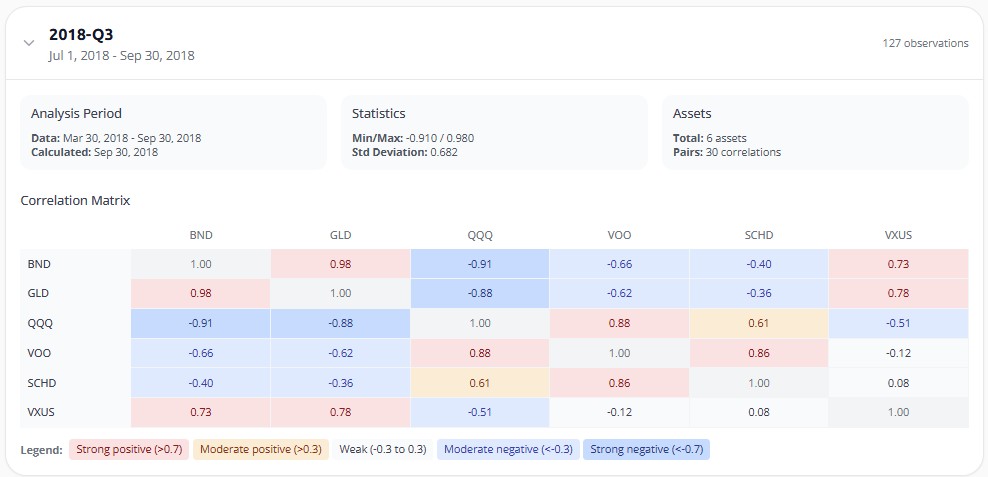
The US equities cluster high, as always. But notice BND and GLD: in that quarter their correlation with US stocks swung strongly negative, down to -0.9. The ballast that looks passive in a calm quarter became an active hedge the moment equities got nervous. One quarter earlier, in spring 2018, those same two funds sat near zero. The relationship wasn't fixed; it moved with the regime.
That's what a single correlation number hides. Average BND against the S&P across all fourteen years and you'd get a figure near zero, which tells you nothing useful. Watch it quarter by quarter and you'd see it run negative for most of the decade, then flip positive in 2022, the year bonds stopped hedging stocks and fell alongside them. If you assumed your bonds would protect you because they always had, 2022 was an expensive surprise. Daily data and a quarter-by-quarter view are how you catch that before it costs you, and it's a big reason we built the backtesting on daily data rather than the monthly series most free tools use.
Level three: whole-portfolio risk
Now combine everything. Once you know how each asset behaves and how the pieces interact, the portfolio's own risk profile falls out of the daily data. These are the numbers for the six-ETF mix, next to the S&P 500.
| Metric | Portfolio | SPY |
|---|---|---|
| Total return | +409.74% | +649.91% |
| CAGR | 11.96% | 15.04% |
| Volatility | 12.58% | 16.61% |
| Max drawdown | -25.09% | -33.70% |
| Sharpe | 0.97 | 0.93 |
The portfolio gave up about 3 points of annual return and got back roughly a quarter less volatility, a drawdown eight points shallower, and a marginally better Sharpe. That's the trade, in numbers.
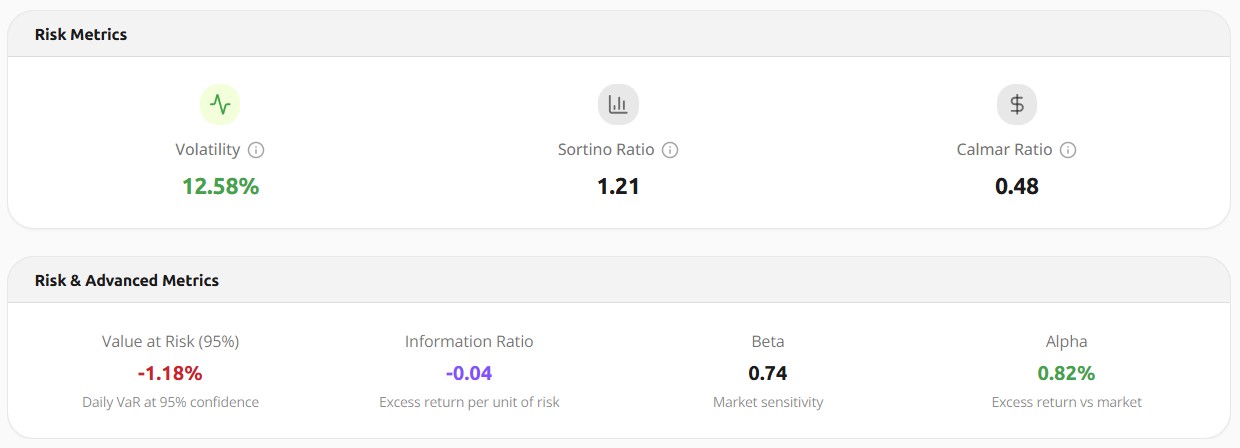
The deeper panel fills in the rest. A beta of 0.74 means the portfolio moved about three-quarters as hard as the market in either direction. The Sortino of 1.21, which only penalizes downside volatility, beat the S&P's 1.14, the cleaner way to say "more efficient on the risk that actually hurts." The Calmar of 0.48 sets annual return against the worst drawdown. No single one of these is the risk number; together they describe a portfolio built to move less violently, at a known cost to upside.
The AI layer: risk explained, not invented
The three levels are the method. The AI sits across all of them: not a fourth level, but a translator. Plenty of investors now paste their holdings into a chatbot and ask whether their portfolio is risky. The answer comes back fluent, confident, and often invented, because the model is guessing from training data instead of reading the actual numbers.
Awalyt's AI layer works the other way around: it doesn't generate figures, it reads the ones the engine already calculated and explains what they mean.
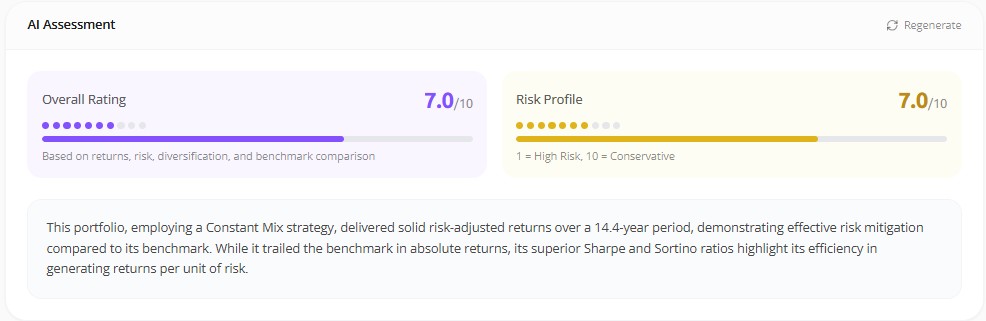
It scored the risk profile at 7 out of 10, toward the conservative end, and it didn't hide the weak spot: the portfolio trailed the benchmark on absolute returns but earned superior Sharpe and Sortino ratios for its efficiency per unit of risk. Same conclusion the metrics gave us, written in a sentence a client could read. The value isn't that the AI thinks for you. It's that it never points you at a number the engine didn't compute.
The bottom line
Analyzing portfolio risk well comes down to refusing to trust a single number. Look at each asset on its own and you'll learn that the scariest-looking holding can be the one quietly protecting you. Look at how they move together and you'll find out whether your diversification is real or just a longer list of tickers. Look at the whole portfolio and you'll see the trade you're making between return and a steadier ride.
This particular mix gave up a lot of upside to the S&P 500, and the data says so plainly. But for someone who knows they'd have bailed during a 34% drawdown and could sit through a 25% one, the calmer portfolio is the one they'll actually keep, and the one they keep is the only one that compounds.
If you want to run this on your own holdings, the three levels map to three starting points: Asset Analysis for the individual pieces, backtesting for the whole portfolio and its correlation matrix, and the AI to translate the output. The honest answer to "how risky is my portfolio" is usually more interesting than the number you came in expecting.
Want to test these insights on your own portfolios?
Awalyt is a portfolio analysis platform: backtesting on daily data, fundamental analysis, asset analysis, and AI-powered insights.
Get Started FreeRelated Insights
How 15% Gold Turned an Aggressive Tech Portfolio into a Market-Beating Strategy
11 min read
Is VOO + QQQ + SCHD + VWO + VXUS Diversified? [2026]
10 min read
What Is Portfolio Diversification? (And How to Measure If You Actually Have It) [2026]
13 min read