Does VTI Make SCHD Redundant? A Data-Driven Analysis [2026]
You already own VTI. Thousands of U.S. companies in one ticker, basically the entire market. So when someone suggests adding SCHD, the objection writes itself: SCHD holds dividend stocks, VTI already owns those same stocks, so you'd just be buying back a slice of what you have. Redundant. Skip it.
It's the most common argument against pairing the two, and it sounds airtight. But owning the same stocks and duplicating the same dollars are two different claims, and in this case the gap between them is enormous.
Nearly all of SCHD's stocks are already inside VTI. Yet hold both, and only 6.66% of your money actually overlaps.
How both can be true at once is the whole article. The short version: VTI owns those stocks at tiny weights while SCHD owns them big, so the same names barely overlap in dollars. I ran VTI and SCHD through Awalyt's ETF overlap analyzer and a 14-year daily backtest to see exactly where the redundancy idea holds up and where it falls apart.
Disclaimer: This article is for educational and informational purposes only. It does not constitute investment advice. Past performance does not guarantee future results. Always do your own research before making any investment decisions.
The Intuition Isn't Wrong, It's Incomplete
Start with the part the skeptics get right.
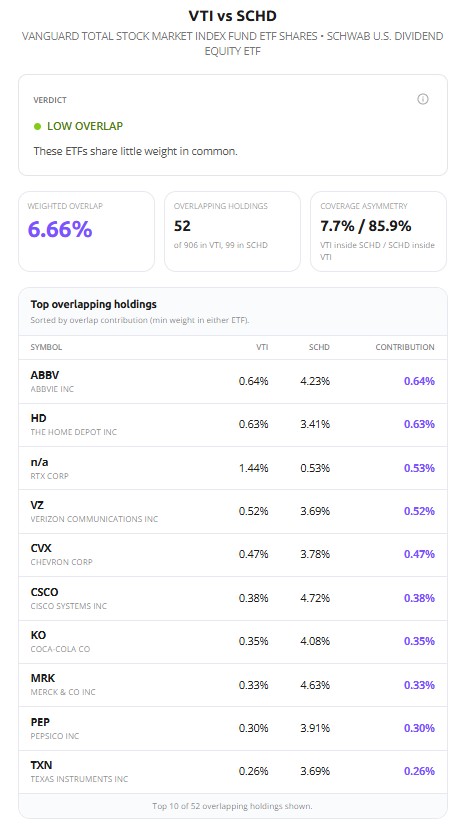
SCHD holds 99 stocks, and almost all of them are companies VTI also owns. The analyzer captures this as coverage: 85.9% of SCHD's weight sits in names that also appear in VTI. That's the coverage asymmetry on the right of the screenshot, and it's exactly what you'd expect. VTI owns nearly the entire U.S. market, so of course the large-cap dividend payers SCHD buys are in there somewhere. By that measure, SCHD really is "mostly inside VTI."
So the verdict should be high overlap. It isn't. The tool returns LOW OVERLAP, with a weighted overlap of just 6.66%. Those two figures, 85.9% and 6.66%, look like they contradict each other. They don't. The first counts whether VTI holds the same companies; the second counts how much of your money actually doubles up when you own both. Only the second one tells you whether you're being redundant.
One honest note on the holdings count. The engine matched 52 of SCHD's 99 positions against the slice of VTI's roughly 3,600-stock basket it tracks. In practice nearly every SCHD name lives somewhere inside the total market. It doesn't move the conclusion, because the weighted math is driven by the largest positions, which are fully captured.
The Number That Flips Everything: 6.66%
Holdings overlap and weighted overlap answer different questions. Holdings overlap asks whether two funds own the same companies. Weighted overlap asks how much of your actual dollars land on the same companies when you hold both. The analyzer measures the second one: for every shared stock, it takes the smaller of the two weights and adds those up. If a stock is 4% of SCHD but 0.5% of VTI, it contributes 0.5% to the overlap, because that's the most you're truly duplicating. (The overlap guide walks through the method in full.)
That method is what produces 6.66%, and the top shared holdings show why.
| Stock | Weight in VTI | Weight in SCHD |
|---|---|---|
| AbbVie (ABBV) | 0.64% | 4.23% |
| Cisco (CSCO) | 0.38% | 4.72% |
| Merck (MRK) | 0.33% | 4.63% |
| Coca-Cola (KO) | 0.35% | 4.08% |
| Home Depot (HD) | 0.63% | 3.41% |
| Chevron (CVX) | 0.47% | 3.78% |
Look at the spread. Cisco is 0.38% of VTI and 4.72% of SCHD, more than twelve times the weight. AbbVie, Merck, Coca-Cola, all the same story. SCHD isn't holding different companies than VTI. It's holding the same companies at radically different sizes. Because the overlap takes the smaller side, each of these contributes only its tiny VTI weight, and the total stays under 7%. Even the occasional name VTI holds more heavily than SCHD (RTX, for one) contributes little, because the overlap always counts the smaller of the two weights.
There's a second tell in that list. None of the top overlaps are the names you'd expect. No Nvidia, no Apple, no Microsoft. The shared weight sits in old-economy payers: pharma, energy, staples, telecom. SCHD's dividend-and-quality screen pushes out exactly the mega-cap growth that dominates VTI, and loads up on what VTI keeps thin.
Why the Weights Diverge This Hard
The stock-level pattern is really a sector story.
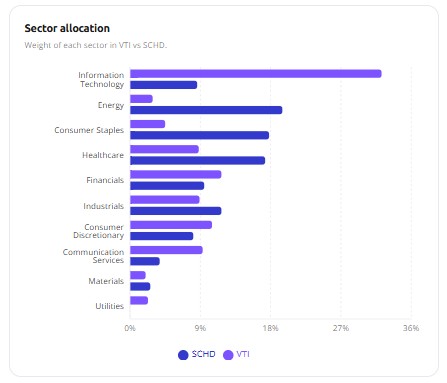
VTI is about 33% information technology. SCHD is closer to 9%. Where VTI runs thin, SCHD runs heavy: energy near 18%, consumer staples around 16%, healthcare around 16%. On the sectors that have driven market returns for the past decade, the two funds are close to mirror images. That's the structural reason the same companies carry such different weights, and the reason the weighted overlap stays low even when the holdings list overlaps.
It's also why "total market" is misleading shorthand. VTI is the total market by count, but by weight it's a large-cap, tech-tilted fund, because market-cap weighting hands the biggest slices to the biggest companies. SCHD weights by dividend yield and quality instead, which lands it in a different part of the market entirely.
14 Years, Side by Side
Composition explains what you own. A backtest shows what it did. I ran both funds from January 2012 through June 2026 on daily-precision data, with SPY as the benchmark: 14.4 years and more than 3,600 data points.
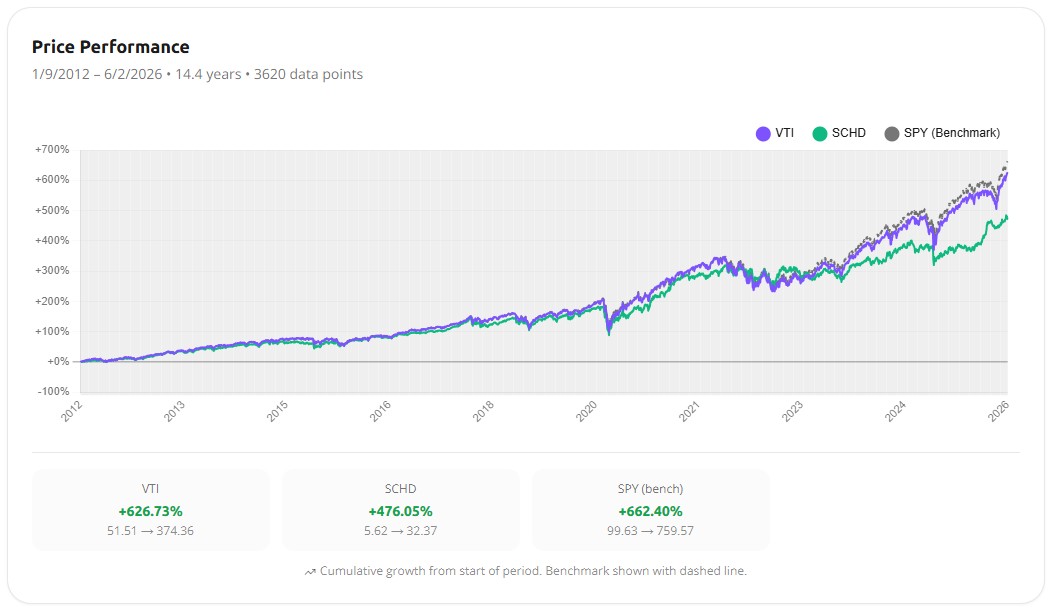
VTI returned +626.73%. SCHD returned +476.05%. SPY, for reference, +662.40%. I'll be blunt about that gap, since dividend-fund advocates tend to skip past it: over a stretch dominated by one of the strongest large-cap tech bull markets in history, tilting away from that tech cost SCHD roughly 150 points of total return. That's not a flaw in SCHD. It's the price of being underweight the thing that went up the most.
The full metrics complicate the simple "VTI won" read, though.
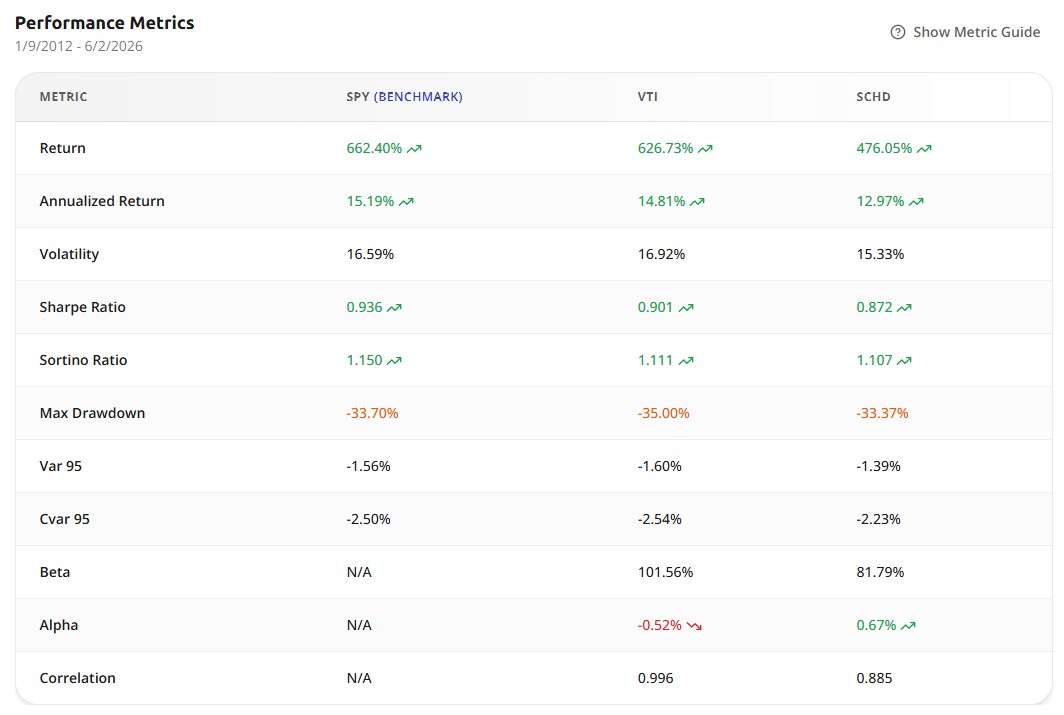
| Metric | SPY | VTI | SCHD |
|---|---|---|---|
| Total return | +662.40% | +626.73% | +476.05% |
| Annualized | 15.19% | 14.81% | 12.97% |
| Volatility | 16.59% | 16.92% | 15.33% |
| Max drawdown | −33.70% | −35.00% | −33.37% |
| Sharpe ratio | 0.936 | 0.901 | 0.872 |
| Beta vs SPY | — | 1.02 | 0.82 |
| Alpha | — | −0.52% | +0.67% |
| Correlation w/ SPY | — | 0.996 | 0.885 |
SCHD was the least volatile of the three and took the shallowest max drawdown. Its beta to the market was 0.82 against VTI's 1.02, and it posted positive alpha (+0.67%) where VTI's was slightly negative. Its correlation with SPY, 0.885, was the loosest in the group.
Here's the honest catch, because it matters: SCHD did not win on risk-adjusted return. Its Sharpe ratio of 0.872 came in just under VTI's 0.901. So the case for SCHD isn't "same returns, less risk." It made less, full stop, and slightly less per unit of risk too. What it offers is something Sharpe doesn't capture: a return stream that doesn't move in lockstep with the market. And that's where the redundancy question finally settles.
They Used to Move Together. Lately They Don't.
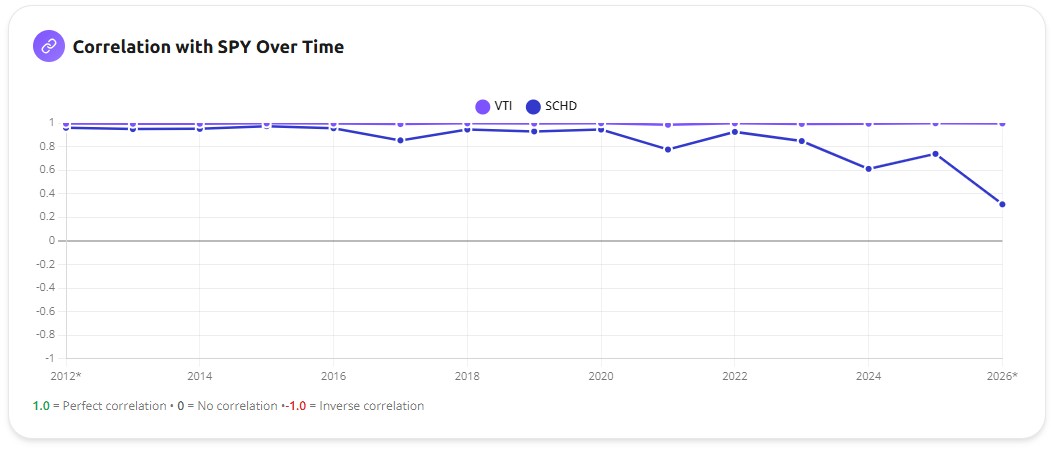
VTI's correlation with SPY is a flat line near the top of the chart, hovering around 1.0 the whole way. No surprise: VTI essentially is the market. SCHD's line is the interesting one. It opened in the mid-0.90s in the early 2010s, when SCHD moved almost exactly like the broad market, and it has drifted down since, falling to roughly 0.31 by early 2026 (the final point is a partial year, so read it as direction more than precision). A fund that once tracked the market closely now barely moves with it.
This isn't a quirk of one dataset. Independent measures of the VTI and SCHD relationship show the same loosening: their direct correlation has fallen from a long-run average near 0.8 to roughly 0.4 over the past year. The two funds have genuinely come apart.
The annual returns show where it happened.
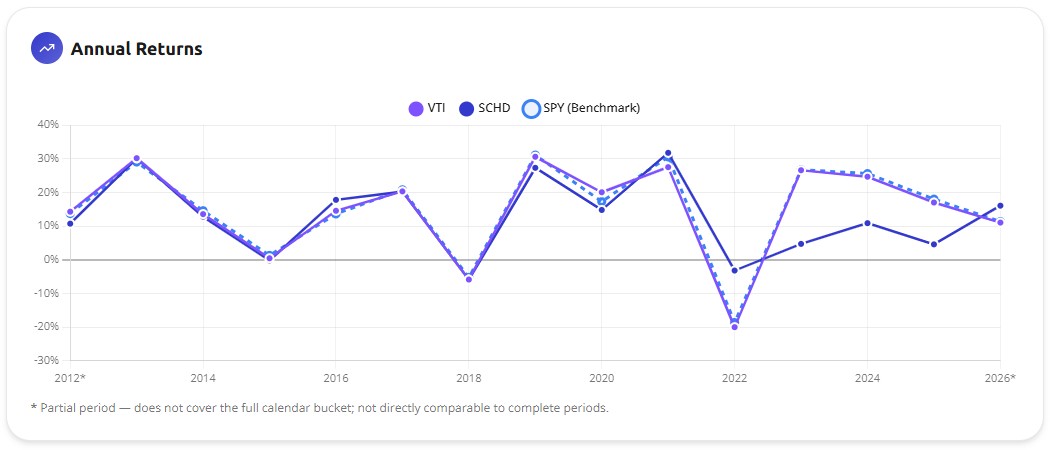
Through 2020, SCHD and VTI rose and fell together, year after year. Then they split:
- 2022: the market dropped hard. VTI fell about 20%, and SCHD lost only about 3%. While total-market investors watched a fifth of their portfolio evaporate, SCHD barely moved.
- 2023 to 2025: the reverse. The AI-led mega-cap rally pulled VTI up north of 20% in years SCHD managed single digits. The same tech tilt that protected SCHD in 2022 carried VTI here.
- 2026 so far: SCHD back in front, as energy and dividend names led and the mega-cap trade cooled.
That 2022 figure is the cleanest evidence in the whole analysis. A truly redundant holding cannot be down 3% while the thing it supposedly duplicates is down 20%. SCHD held up because it owns a different slice of the market, one that's weighted differently and behaves differently when conditions change.
So, Is SCHD Redundant?
A rough way to read weighted overlap: under about 40%, two funds mostly complement each other; between 40% and 70%, you're partly buying the same thing twice; above 70%, they're close to interchangeable. At 6.66%, VTI and SCHD sit near the floor of that scale. They are about as far from redundant as two U.S. equity funds get.
For contrast, run the pair people assume is different. VOO and QQQ overlap at roughly 53% by weight, despite tracking "different" indexes. VTI and SCHD, the pair people assume is redundant, overlap at under 7%. The common intuition about both is backwards.
Who Actually Wants Both
Low overlap is the reason redundancy isn't the problem. It isn't, by itself, a reason to buy. Whether the pair fits depends on what you're holding VTI for in the first place.
Are you in VTI for growth, comfortable holding roughly a third of your money in tech, happy to ride whatever the largest companies do next? Then SCHD mostly adds drag in years like 2023, watering down the part of your portfolio that's been doing the work. The low overlap is real, but you'd be diluting on purpose.
Or are you the investor who looked at 2022 and didn't enjoy being down 20%, who'd like income that arrives as actual cash, who's a little uneasy that a handful of tech names decide most of your year? SCHD does something VTI structurally can't: it leans into the sectors VTI barely holds, pays you roughly 3.8% while you wait, and tends to hold up when the mega-cap trade breaks. For that investor it's a genuine second exposure, not a duplicate.
The 2022 column sorts these two people better than any risk questionnaire. If you remember how that year felt in your account, you already know which one you are.
Bottom Line
VTI doesn't make SCHD redundant. The data points the other way: under 7% weighted overlap, near-opposite sector tilts, and a correlation that's been falling for years instead of climbing. SCHD is about the least redundant thing you can bolt onto a total-market core.
What it isn't is free. You trade away return in growth-led markets to get lower correlation, real income, and a calmer ride when tech rolls over. That's a deliberate tradeoff, not a duplicate position, and the right call depends entirely on which of those you care about more.
If you're weighing SCHD against other income funds rather than against the whole market, SCHD vs VYM vs VIG runs that fight over 14 years. And if you hold more than these two and you're not sure what overlaps with what, that's the more valuable question, the one the overlap analyzer answers in about thirty seconds.
Want to test these insights on your own portfolios?
Awalyt is a portfolio analysis platform: backtesting on daily data, fundamental analysis, asset analysis, and AI-powered insights.
Get Started FreeRelated Insights
VT vs VTI: Is a World ETF Actually More Diversified? [2026]
11 min read
How to Check ETF Overlap for Free — And Why You Should Before Buying Two ETFs [2026]
9 min read
VOO vs VTI: What's the Actual Difference? [2026 Comparison]
10 min read