Does Adding AVUV to VOO Improve Your Portfolio? [2026]
If you spend any time in investing forums, you've seen the suggestion: own VOO for the core, then bolt on a slice of AVUV to capture the small-cap value premium. It shows up in nearly every "rate my portfolio" thread. The pitch is appealing on paper, since small-cap value is one of the most documented return factors in academic finance. But does the tilt actually do anything for a real portfolio, or is it a premium that lives in long-run studies and not in your account?
I ran a plain VOO portfolio against an 80% VOO / 20% AVUV version over the full life of AVUV, rebalanced quarterly. The window is short, and I'll keep coming back to why that matters, because it shapes how much weight any of these numbers deserve.
This article is for educational purposes only and is not investment advice. Past performance does not guarantee future results. All figures come from historical backtests over a specific period that may not repeat.
What the small-cap value tilt is supposed to do
The thesis goes back to the Fama-French research on equity factors. Smaller companies have historically out-returned larger ones, and cheaper "value" companies have out-returned expensive "growth" ones. Small-cap value sits at the intersection of both, and over multi-decade samples it has been one of the strongest sources of excess return in US equities.
AVUV is Avantis' take on that idea. It doesn't just buy cheap small companies; it screens for low valuations and then layers on a profitability filter to skip the lowest-quality names that have historically dragged on naive small-cap value indexes. The fund holds more than 500 positions, none above roughly 1%, across industrials, regional financials, energy, and retail. That construction is the whole reason people pair it with an S&P 500 fund: it reaches into a part of the market VOO almost entirely ignores.
The catch is timing. AVUV launched in late 2019, so the only track record we have runs straight through one of the most growth-dominated stretches in market history. That's the backdrop for everything below.
On the numbers, almost nothing changed
Here's the blended portfolio against VOO alone.
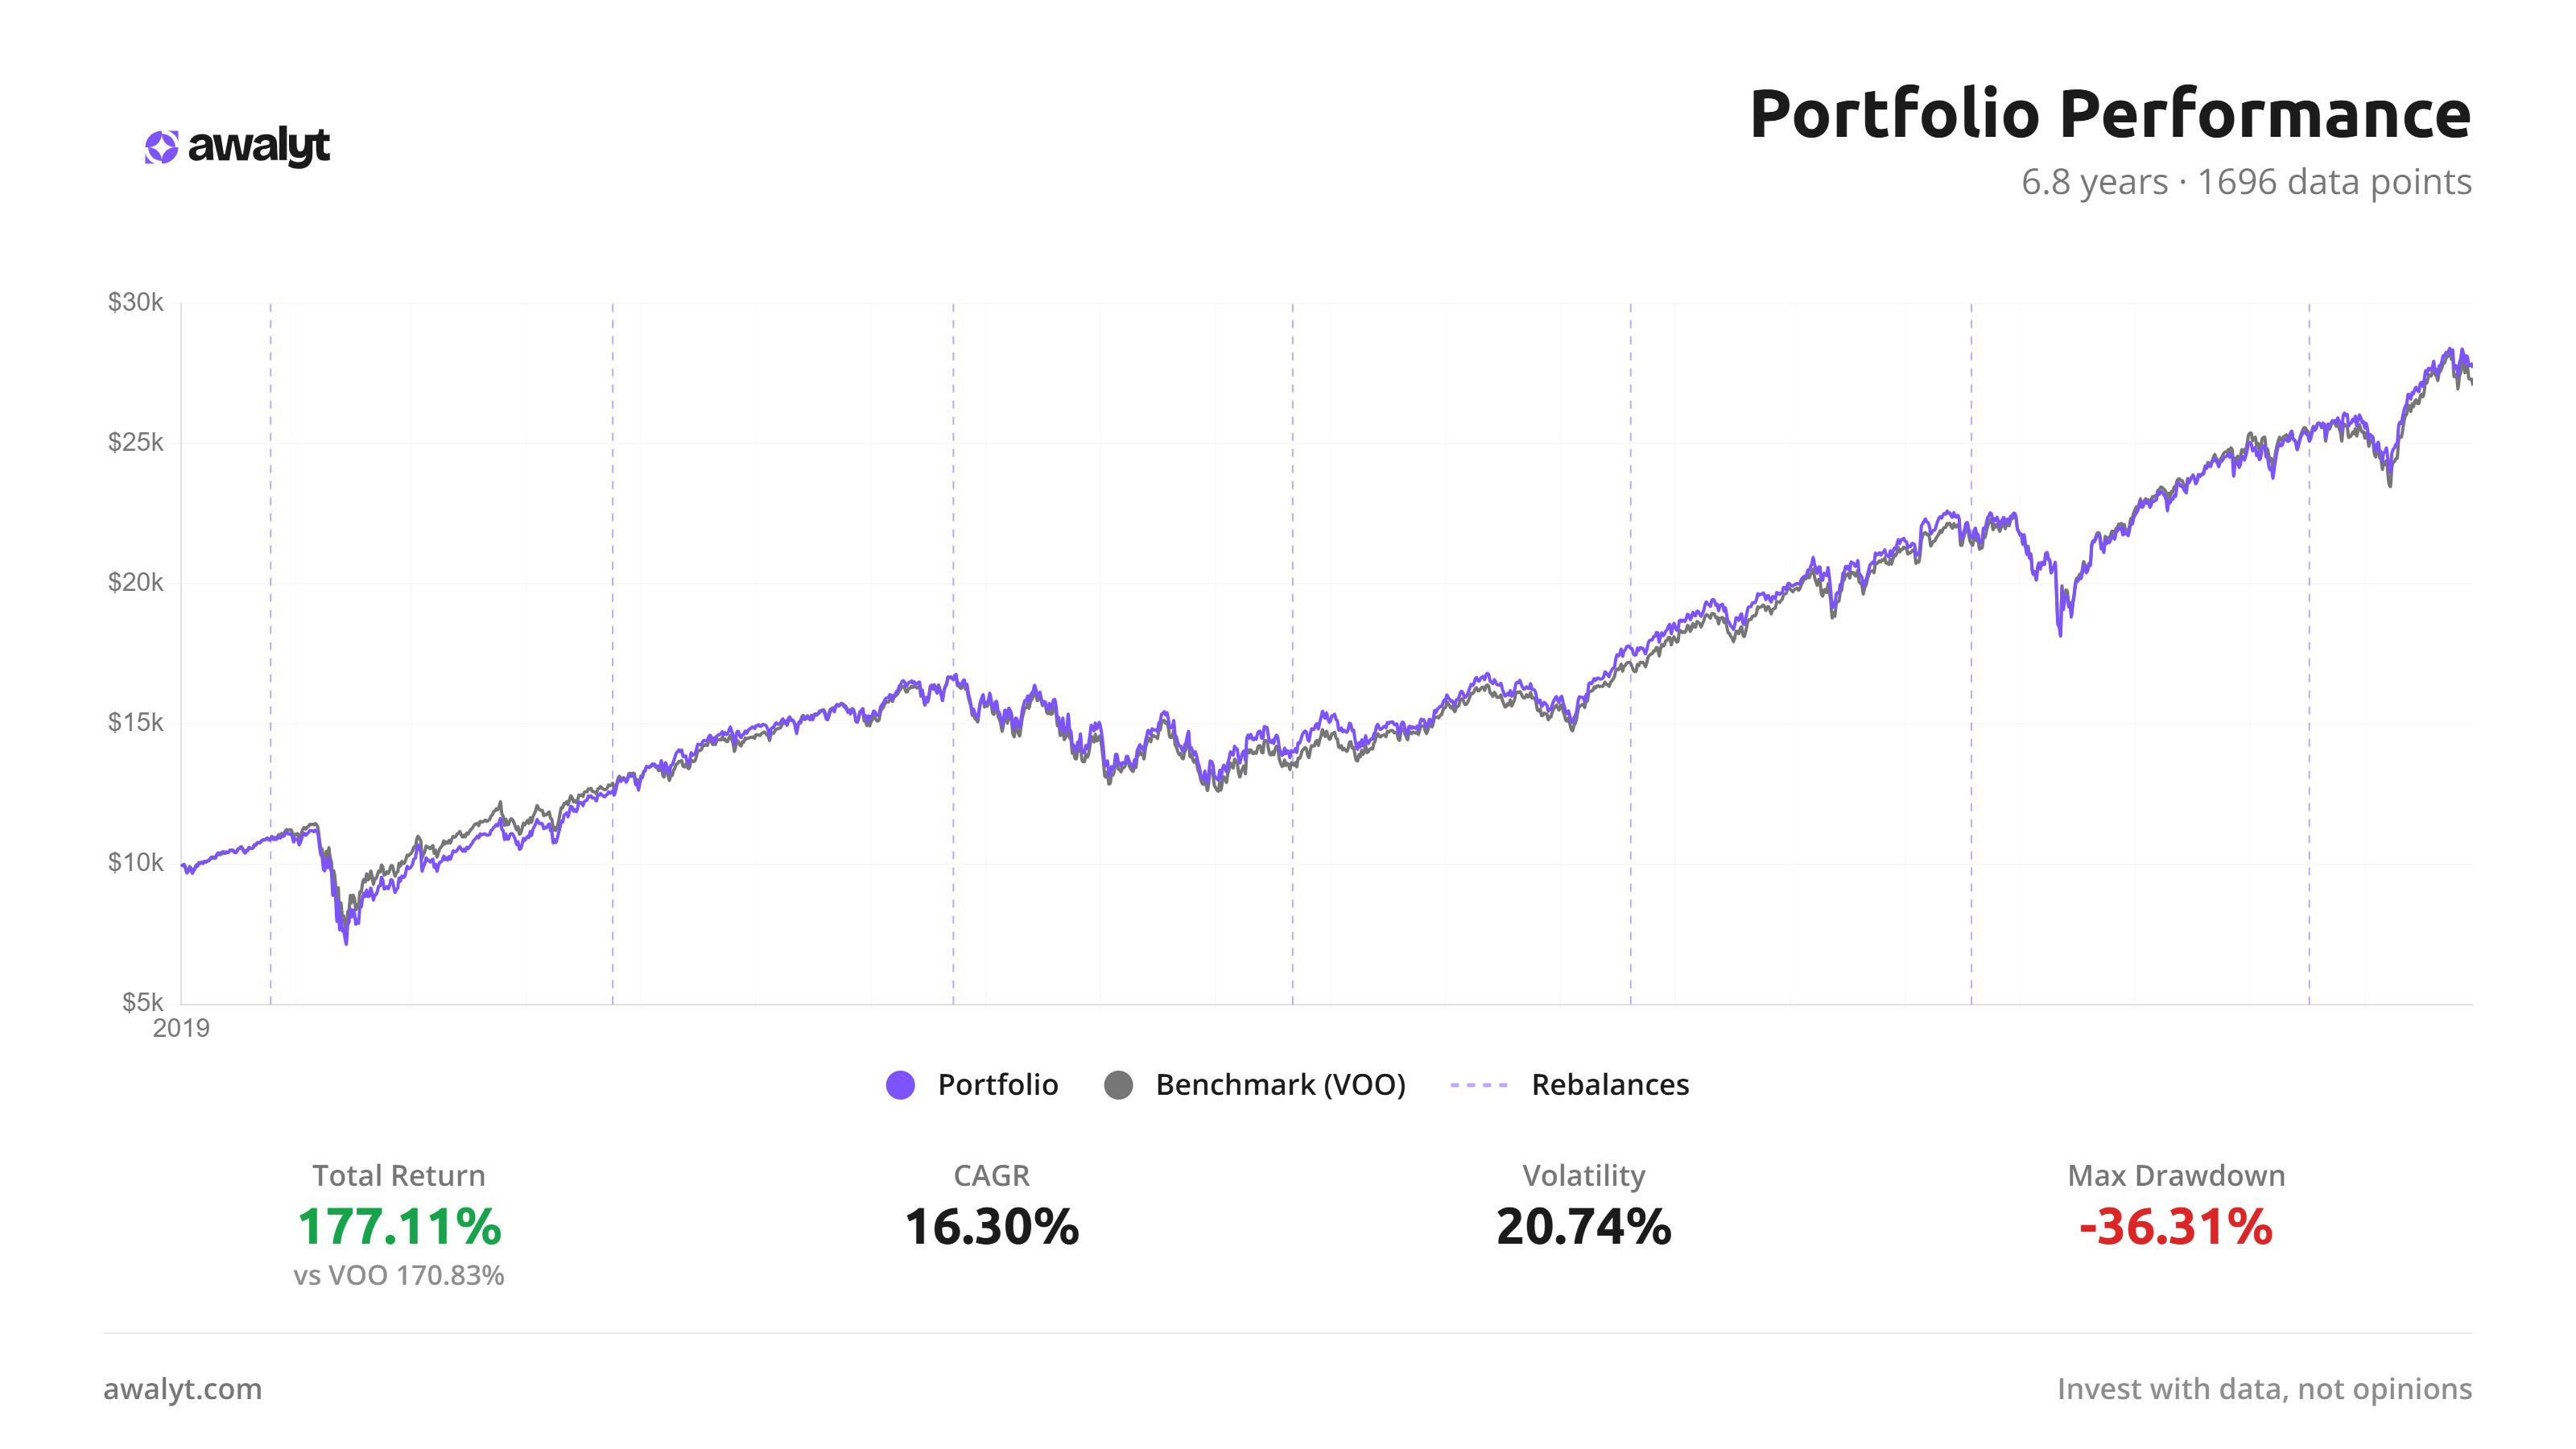
Over 6.8 years, the 80/20 portfolio returned 177.11% against VOO's 170.83%. That's an edge of roughly six percentage points spread across nearly seven years, a CAGR gap of about a tenth of a percent. The two lines sit on top of each other for almost the entire chart.
The risk side barely moved either. The tilted portfolio ran at 20.74% volatility against VOO's 20.12%, and its worst drawdown came in near -36% versus VOO's -34%. Half a point of volatility, two points of drawdown, over almost seven years. If you're scanning for a performance verdict here, there isn't one. Adding a fifth of your portfolio in small-cap value left the headline numbers essentially where they started.
That's worth sitting with, because it cuts against both pitches. The tilt didn't deliver the premium its advocates promise, and it didn't blow up the portfolio the way skeptics warn. At 20%, a volatile sleeve gets diluted into near-irrelevance on the metrics that show up in a backtest summary. Which means the real question isn't whether the numbers improved. It's what you structurally changed underneath them.
What you actually changed: the structure, not the return
A 20% position can be loud or quiet depending on what it overlaps with. This one is loud, even if the performance line is quiet.
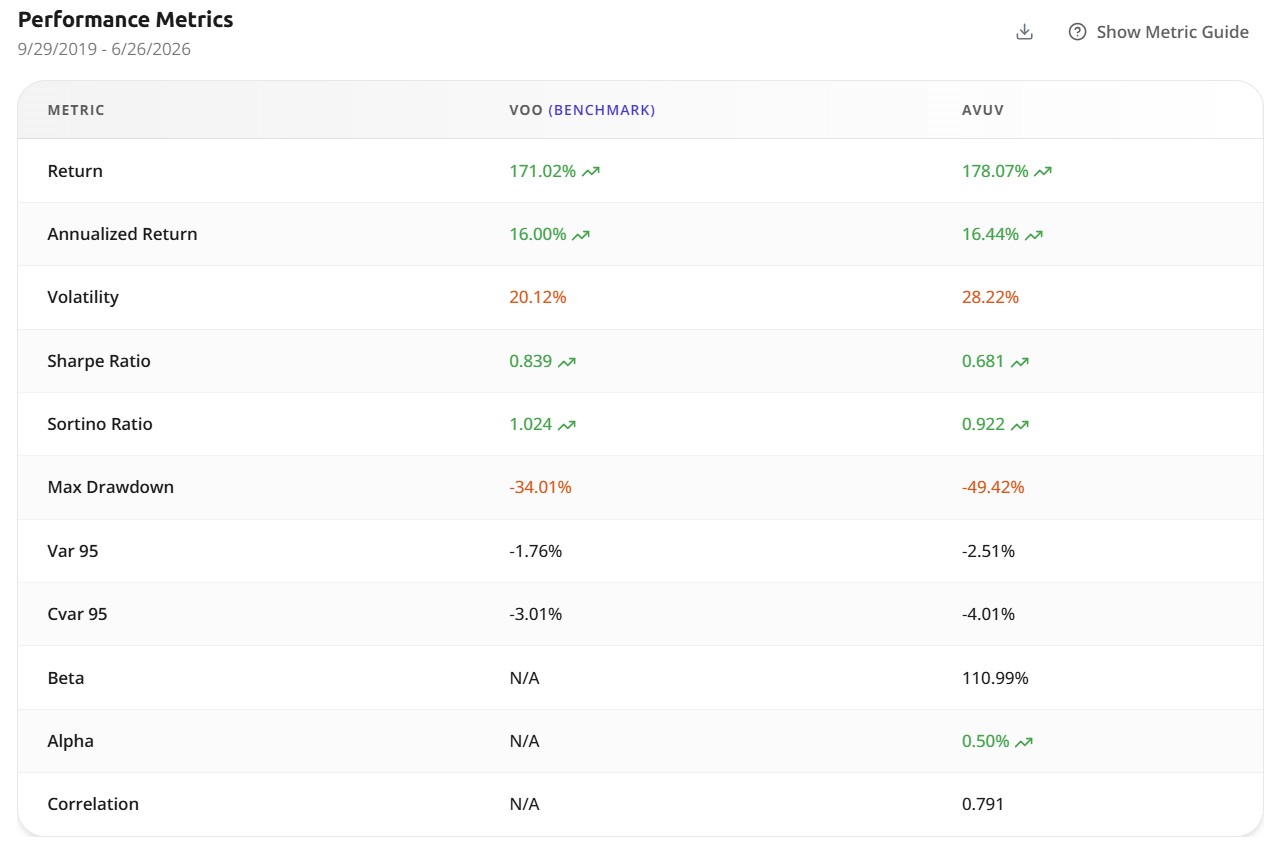
On its own, AVUV is a genuinely different animal from VOO: 28.22% volatility against 20.12%, a max drawdown of -49.42% against -34.01%, and a beta above 1.1. It delivered roughly the same total return as the S&P 500 over this window, but the path there was far rougher. None of that violence reached the blended portfolio's summary stats, because 80% VOO absorbs it. What the 20% sleeve did do was redirect a chunk of your money into a part of the market the index doesn't touch at all.
The exposure VOO doesn't give you
This is the substance of the tilt, and it has nothing to do with the Sharpe ratio.
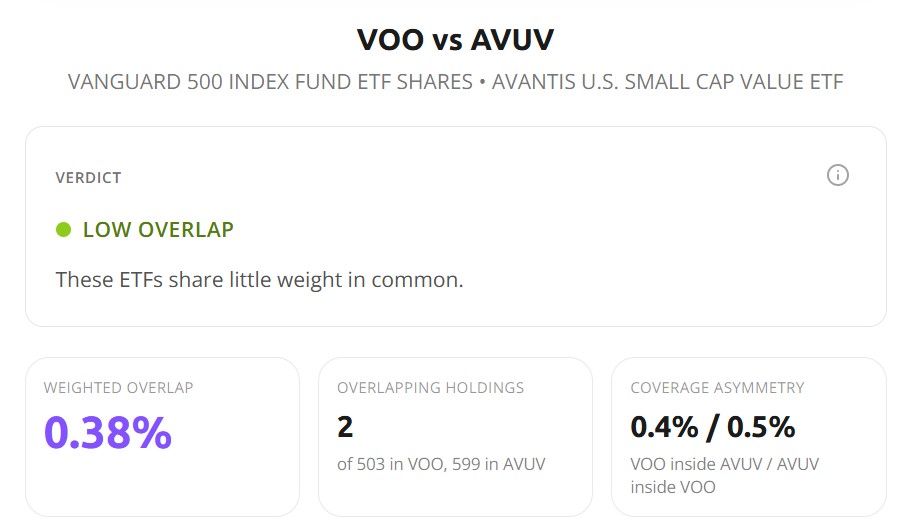
Weighted overlap is 0.38%. Out of 503 holdings in VOO and 599 in AVUV, exactly two names appear in both. This is about as close to non-overlapping as two US equity funds get. VOO is NVIDIA, Apple, and Microsoft at the top, concentrated in mega-cap tech. AVUV is small companies in industrials, regional banks, energy, and retail, none of them above 1% of the fund. Adding it doesn't fine-tune your existing exposure. It bolts on a whole asset class your S&P 500 core structurally excludes.
That's the actual decision in front of you, and it's a structural one, not a performance one. Do you want a slice of your equity allocation pointed at the size and value factors, accepting that those factors can underperform for a decade at a time? Over the window we just looked at, they roughly matched the index. The diversification was real in the sense that mattered to construction, even though it didn't change where you ended up.
When a tilt like this is supposed to pay off, and when it can't
Low overlap is not the same as low correlation, and the distinction is the whole ballgame for whether this tilt does anything for you.
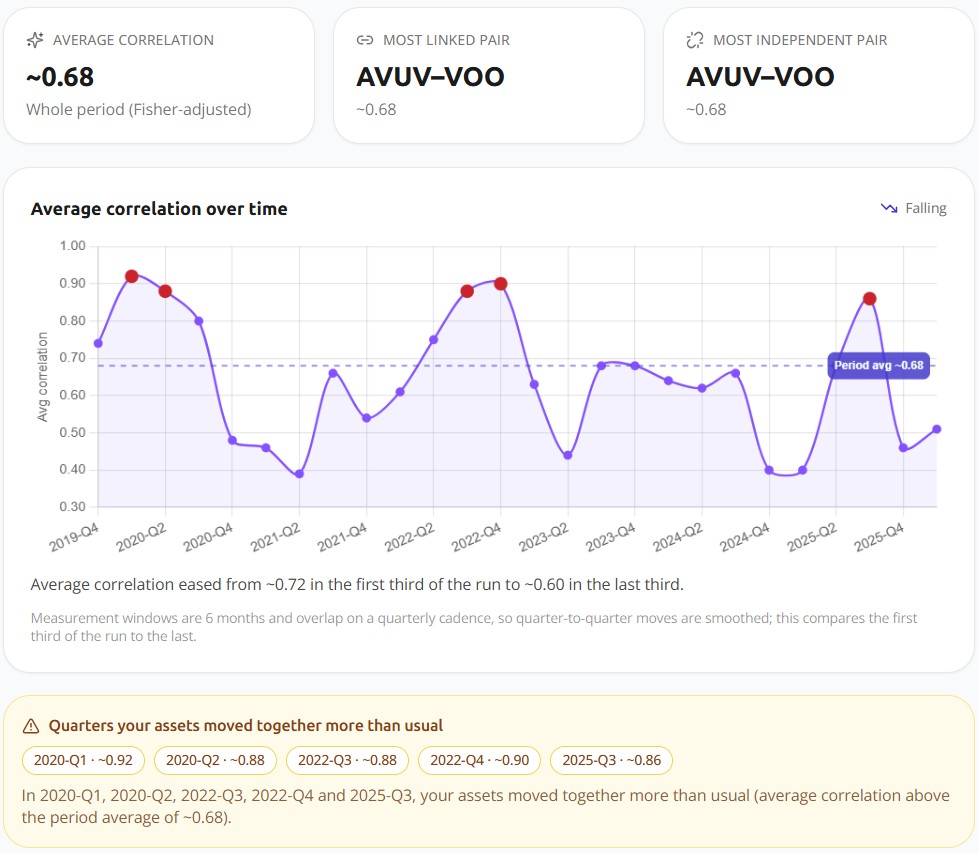
Across the period the two correlated around 0.68, loose enough to move differently in ordinary markets. That's where the tilt earns its keep: when small-cap value and large-cap growth diverge, your two sleeves pull in different directions and the portfolio behaves less like a pure S&P 500 bet. The conditions that drive that divergence tend to show up together, with higher rates, a steeper curve, and compressed multiples favoring shorter-duration, cheaper earnings over long-duration growth stories. The early-2025 rotation is a live example, and it's roughly when the correlation in the chart drifts to its lows.
Now look at the spikes. In the 2020 crash, correlation jumped to about 0.92. In the 2022 selloff it climbed back near 0.90. The quarters where the two funds moved most tightly together were the worst quarters, the exact moments you'd want them to diverge. This is the limit worth internalizing: a tilt by size and style diversifies your factor exposure, not your exposure to a systemic shock. When the whole market reprices on fear, everything sells together, and a second equity fund won't soften the blow. If you want something that holds up in a crash, that job belongs to a different asset class entirely, not to another flavor of US stocks.
Who the tilt actually suits
So should you add AVUV to a VOO core? Frame it as a structural choice and the answer gets clearer, because the backtest already told you the performance impact rounds to nothing.
You're deciding whether you want a standing bet on the size and value factors inside your equity allocation. If you hold the academic view that those factors are durable and mean-reverting, a small-cap value sleeve is how you express it, and you accept that it can lag the index for years while you wait for a regime that rewards it. The tracking error is the cost of admission, not a malfunction. If instead you don't have conviction in the premium, there's little reason to carry a sleeve that adds complexity and a quality you can't see in calm markets, on the promise of a payoff that may sit a full cycle away.
What this backtest can't do is make that call for you. The small-cap value premium plays out over decades, and 6.8 years that happened to land in a growth bull market can neither confirm it nor bury it. Reading "the tilt doesn't work" into this window would be the same start-date mistake I flag constantly in backtests, just pointed at the pessimistic conclusion.
The bottom line
Over the only stretch we can test, adding 20% AVUV to VOO changed the headline numbers by almost nothing: a tenth of a percent on CAGR, half a point on volatility, two points on the worst drawdown. The performance debate is a non-event at this weight. What the tilt actually does is redirect a fifth of your equity into a part of the market the index ignores entirely, a structural change that pays off only when value and small caps are in favor, and that offers no shelter when a panic drags everything down together.
That makes this a portfolio-construction decision, not a returns decision. If you want to see how sensitive even these small differences are to the start and end dates, that's worth running yourself with daily-resolution data. And if you're weighing other satellite sleeves to bolt onto a core, the same structural lens applies to the momentum and growth tilts people reach for next, which I pulled apart in the SPMO vs VUG comparison.
Want to test these insights on your own portfolios?
Awalyt is a portfolio analysis platform: backtesting on daily data, fundamental analysis, asset analysis, and AI-powered insights.
Get Started Free