TQQQ vs QQQ: The Real Cost of 3x Leverage [2026]
From February 2011 to today, TQQQ turned a hypothetical $10,000 into more than $2 million. Over the same stretch, plain QQQ — same index, no leverage — turned it into about $150,000. That gap is why TQQQ has one of the most devoted retail followings of any ETF on the market.
Now look at a different stretch. From February 2021 to mid-2023, QQQ rose 7.8%. TQQQ, the 3x version of the exact same index, lost 30.6%. The index went up. The leveraged fund went down.
Both of those things are true, and the second one is the part most TQQQ content skips. So let's go through what 3x leverage actually does, using daily data across three very different periods. For a leveraged fund the cumulative number tells you almost nothing. The path is the whole story.
Educational content, not investment advice. This article presents historical data from Awalyt's tools. Nothing here is a recommendation to buy or sell TQQQ, QQQ, or any security. Leveraged ETFs carry risks that most long-term investors underestimate, and past performance does not predict future results.
What TQQQ Actually Is
TQQQ is ProShares UltraPro QQQ. It's engineered to deliver three times the daily return of the Nasdaq-100, the same index QQQ tracks. If the Nasdaq-100 rises 1% today, TQQQ targets +3% today. If it falls 1%, TQQQ targets −3%.
The word doing all the work in that sentence is daily. TQQQ resets its leverage every single day. It does not promise 3x your return over a month, a year, or a decade. It promises 3x today, then starts over tomorrow from a new base. Over any holding period longer than one day, your return can be very different from 3x the index, and usually is.
It also costs more. TQQQ's net expense ratio is 0.82% (0.97% gross), versus 0.18% for QQQ. That's roughly four and a half times the fee, which is normal for leveraged products: the daily rebalancing of swaps and futures that maintains the leverage isn't free.
TQQQ vs QQQ: The Differences That Matter
Same index, two very different instruments. Here's the side-by-side.
| QQQ | TQQQ | |
|---|---|---|
| Issuer | Invesco | ProShares |
| Index | Nasdaq-100 | Nasdaq-100 (3x daily) |
| Leverage | None | 3x, reset daily |
| Net expense ratio | 0.18% | 0.82% |
| Inception | 1999 | 2010 |
| Stated objective | Track the index | Match 3x the index for one day |
| Beta to the market (15y) | ~1.13 | ~3.34 |
The last row is worth pausing on. Over fifteen years of daily data, TQQQ's beta has run around 3.34, almost exactly the leverage on the label. QQQ's sits near 1.13. That's the promise working as designed on a daily basis: TQQQ moves about three times as hard as the market, every day, in both directions.
ProShares is unusually direct about the holding period. The fund is built for a one-day objective, and the prospectus says plainly that for any period other than a day your return may be higher or lower than three times the index. People hold it for years anyway. What follows is what that decision has actually produced.
Why 3x Daily Isn't 3x Over Time
Here's the mechanism behind everything else in this article, and it's just arithmetic.
Imagine the Nasdaq-100 rises 10% one day, then falls 10% the next. After two days the index is at 1.10 × 0.90 = 0.99, a loss of 1%. Annoying, but small.
Now run TQQQ through the same two days. Day one it gains 30%, taking it to 1.30. Day two it loses 30%, taking it to 1.30 × 0.70 = 0.91. That's a 9% loss. The index lost 1%, but the 3x fund lost 9%, not 3%. The extra erosion is volatility decay, and over many choppy days it compounds against you.
The counterintuitive part is that decay doesn't always work against you. In a smooth, sustained uptrend, daily compounding works in your favor, and you can end up with far more than 3x. The 15-year data shows exactly that. QQQ returned about 1,390% over the period. Three times that, naively, would be roughly 4,170%. TQQQ delivered 20,766%, close to fifteen times QQQ's return, not three. Fifteen years of a mostly rising market let positive compounding run.
So the multiplier is not fixed. In calm uptrends it's a tailwind. In volatile or sideways markets it's a wrecking ball. Which one you get depends entirely on the path, and this is why I keep saying the cumulative number is the least useful number for a leveraged fund.
Three Periods, Three Completely Different Funds
I pulled three windows from Awalyt, all on daily-precision data, all with QQQ and SPY alongside for context. Same fund in all three. Look at how little they have in common.
Period 1: The 15-Year Headline (Feb 2011 to Today)
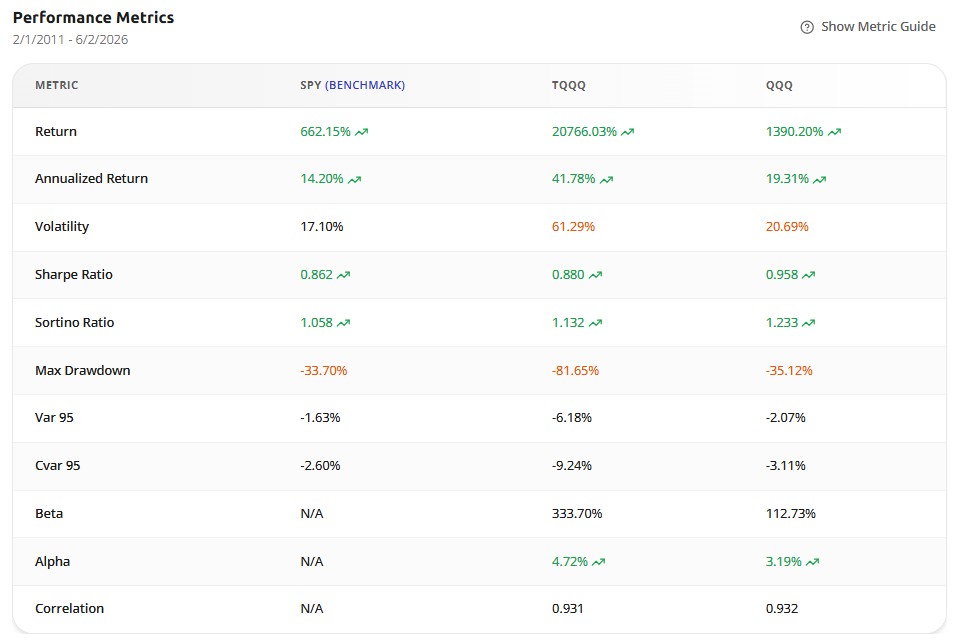
This is the chart that recruits TQQQ holders. +20,766% versus QQQ's +1,390% and SPY's +662%. An annualized 41.78%, more than double QQQ's 19.31%. On paper, a money machine.
Then look down the column. Max drawdown of −81.65%, versus −35.12% for QQQ. And the number almost nobody quotes: TQQQ's Sharpe ratio over these fifteen years was 0.880, below QQQ's 0.958. Across the single greatest run for tech stocks in modern market history, the leveraged fund delivered a worse risk-adjusted return than the unleveraged one. The reward was real. It just wasn't efficient, and it came attached to an 81% drawdown you had to survive to collect it.
Period 2: When the Index Won and TQQQ Still Lost (Feb 2021 to Jun 2023)
This is the window to study.
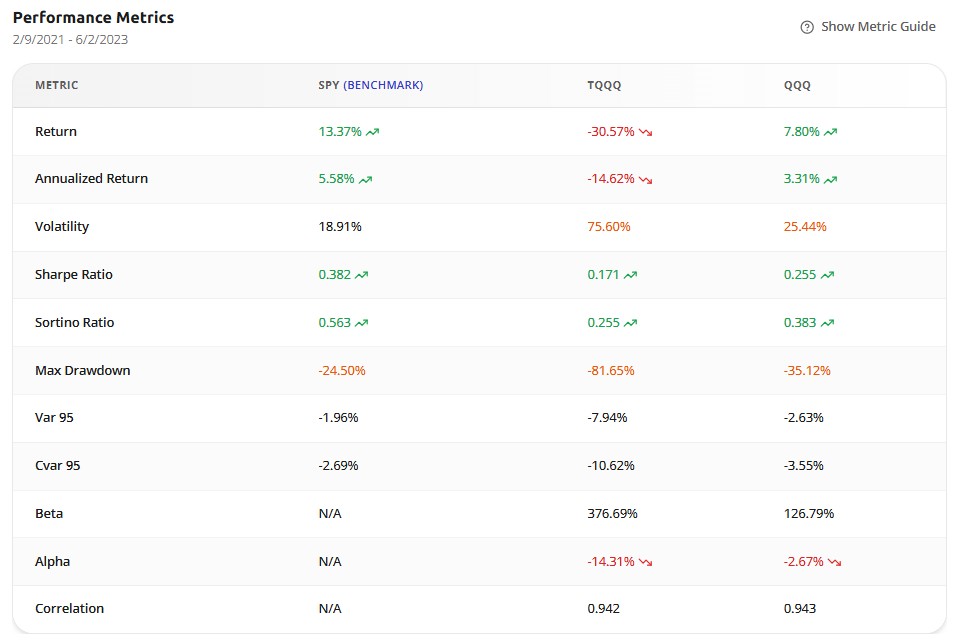
QQQ ended the period up 7.8%. TQQQ ended it down 30.6%. The unleveraged index made money. The 3x fund lost nearly a third. The price chart shows why.
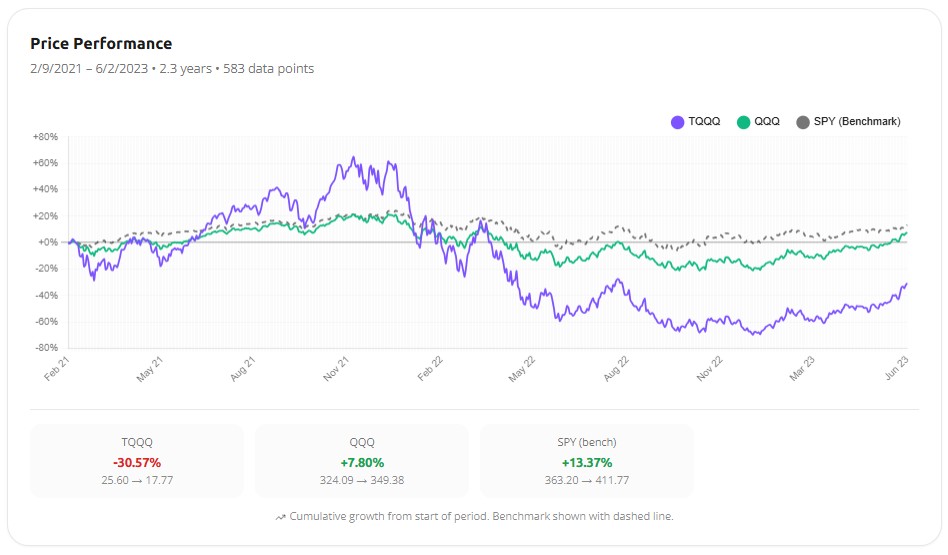
Trace the path. TQQQ ran to roughly +65% by late 2021 as the post-COVID rally peaked. Then the 2022 rate-hike selloff hit, and 3x leverage on the way down is merciless. TQQQ bottomed near −80%. QQQ fell too, but only to about −30%. Then both recovered. QQQ climbed back above where it started. TQQQ recovered a fraction of the lost ground and finished deep in the red.
This is the heart of volatility decay. The index recovered. The leveraged fund didn't. The reason is the brutal asymmetry of percentages: after an 80% loss you need a 400% gain just to break even. The Nasdaq-100 came nowhere near that. It simply clawed back to roughly flat-and-a-bit, which left TQQQ stranded. That −81.65% max drawdown is also the worst in TQQQ's entire history. The single worst moment in fifteen years happened right here, in a window where the index itself ended positive.
Period 3: A Winning Year That Still Underdelivered (Feb 2025 to Today)
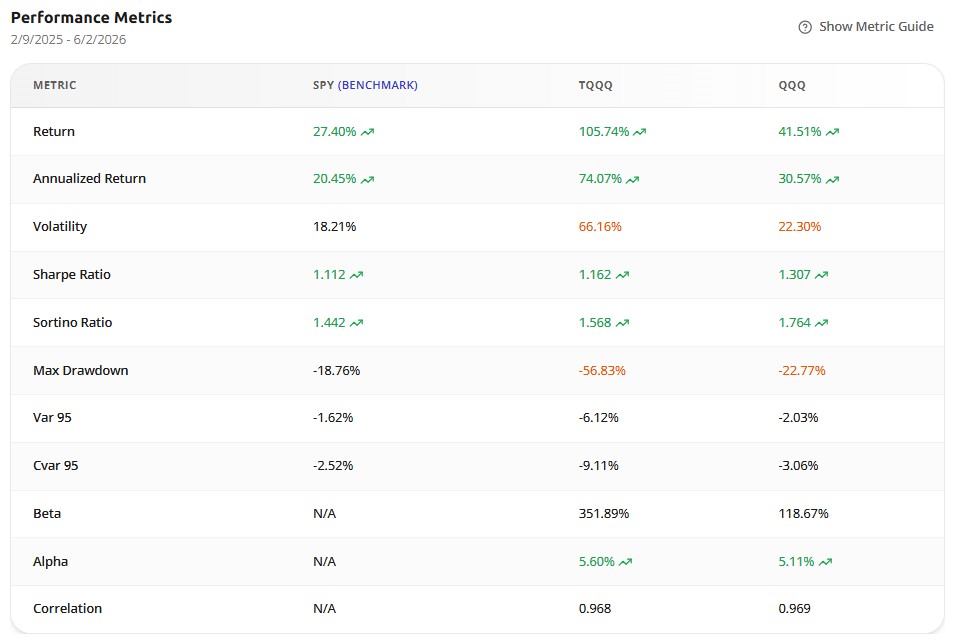
Now the optimistic case. Over the most recent stretch TQQQ returned +105.74%, against QQQ's +41.51% and SPY's +27.40%. In absolute terms, leverage won, and won big.
Two things sit underneath that number.
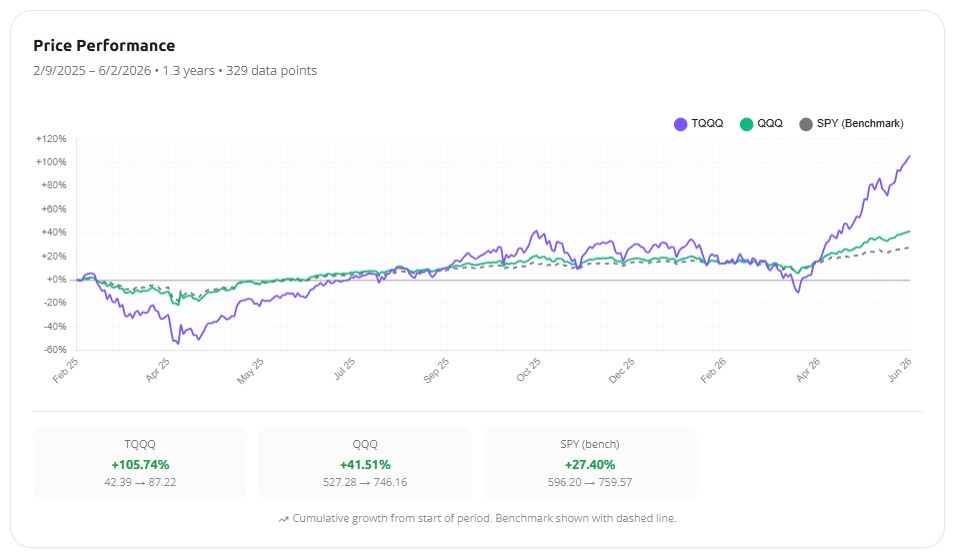
First, look at the spring of 2025 in that chart. TQQQ plunged to about −55% before the recovery. That's the drawdown you had to hold through to collect the +106%, with no way of knowing at the bottom that the recovery was coming. Most people don't hold through that.
Second, the math still leaked. Three times QQQ's +41.5% would be roughly +125%. TQQQ delivered +106%, less than 3x even in a strongly positive year, because that one sharp drawdown reset the compounding base lower. And the risk-adjusted picture repeats itself: TQQQ's Sharpe here was 1.162 versus QQQ's 1.307. Even in its best recent run, the leveraged fund was the less efficient way to own the Nasdaq.
Volatility Is the Thing You Actually Live With
Returns are what you see in hindsight. Volatility is what you feel in real time, and it's the part that decides whether you stay in the seat.
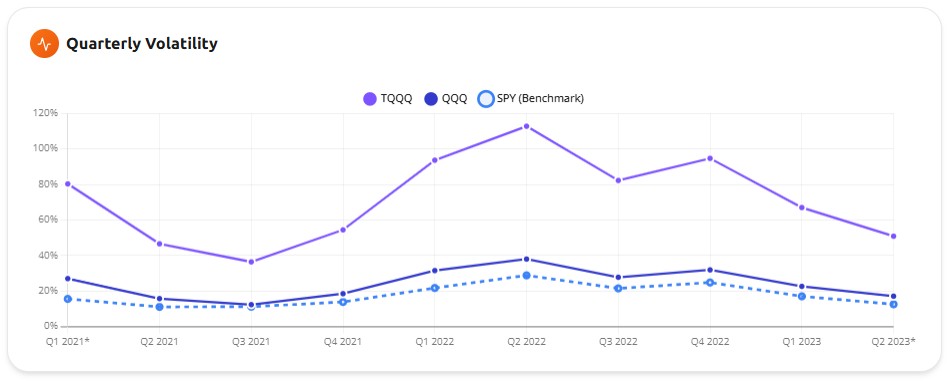
In Q2 2022, TQQQ's annualized volatility crossed 110% while QQQ sat near 38% and SPY stayed under 30%. Annualized volatility above 100% is a strange thing to read: it means the fund's typical yearly swing is larger than its entire value. In lived experience it meant double-digit daily moves, in both directions, for months on end.
The 15-year figures say the same thing more calmly: 61.29% volatility for TQQQ against 20.69% for QQQ. Roughly three times the index means roughly three times the shaking, every day, for as long as you hold it. This is precisely the kind of intra-period detail that monthly-data backtests smooth away, which is exactly why it matters here.
So How Do People Actually Hold This Thing?
Not as a core holding. That's the first thing the data rules out. A 100% TQQQ position that drops 80% isn't something you rebalance. It's something you abandon, usually near the bottom, right before the recovery you were waiting for.
The investors who hold leveraged funds for years without blowing up tend to do a few specific things. They size it small, treating it as a satellite position of maybe 5 to 15% sitting next to a stable core of broad index funds. They decide the rules before they're scared rather than during the drop: how much they'll hold, when they'll trim back to target after a run, what they do if it falls in half. And they watch it far more closely than a buy-and-hold investor watches a total-market fund, because a leveraged position drifts fast. A 15% allocation can quietly become 30% after one good quarter, doubling your real risk without you ever deciding to take it.
That last point is where a tool earns its keep. I built Awalyt's backtesting engine on daily data partly because monthly data hides the exact drawdowns and volatility spikes that decide whether a leveraged position is survivable. If you want to test a small TQQQ sleeve inside a real portfolio, with real rebalancing rules, you want to see the −80% on the actual worst day, not a monthly average that quietly reports it as −55%. The core-satellite framework is the usual home for a position like this, if it has a home at all.
Who It's For, and Who It Isn't
The honest version of this question is mostly about temperament, not age or net worth. It isn't whether you can afford to lose the money. It's whether you'll actually behave when the position is down 60% and every headline says it's heading to zero.
Think back to how you acted in 2022, or in the spring 2025 selloff. If you added to risk assets when they were down, or at least sat still and did nothing, a small leveraged sleeve might be something you can handle. If you sold, and most people sold, then TQQQ will find that out about you again, with more leverage and a worse entry.
It's a tactical instrument, not a retirement vehicle. ProShares built it for a one-day objective and says so directly. People hold it far longer, and in a long bull market that has worked out spectacularly. But "worked out in the best market environment in living memory" is not the same as "safe to hold through whatever comes next."
The Bottom Line
Three periods, one fund, three different outcomes, and the leverage was identical the entire time. That's the whole lesson. TQQQ doesn't give you 3x QQQ. It gives you 3x QQQ's day, compounded along whatever path the market happens to take, and the path is the one thing nobody can promise you in advance.
The 15-year chart will keep pulling people in, and to be fair, anyone who held through every minute of it did extraordinarily well. But the same dataset shows a Sharpe ratio below plain QQQ, an 81% drawdown, and a two-year window where the index made money and the fund lost a third of its value. If you've read all of this and you're still interested, that's not a red flag. It might mean you're exactly the kind of investor who can use it. The next step isn't to buy it. It's to test it, on daily data, inside the portfolio you'd actually have to hold.
Want to test these insights on your own portfolios?
Awalyt is a portfolio analysis platform: backtesting on daily data, fundamental analysis, asset analysis, and AI-powered insights.
Get Started FreeRelated Insights
QQQ vs QQQM: Same Index, Which One Should You Buy? [2026]
8 min read
If You Invested $10,000 in QQQ 10 Years Ago, Here's What You'd Have Today [2026]
10 min read
VOO vs QQQ: Which Should You Buy? [2026 Data + Overlap Analysis]
11 min read