QQQ vs QQQM: Same Index, Which One Should You Buy? [2026]
Two tickers, one letter apart, and a surprising amount of confusion about what separates them. Some people assume QQQM is a momentum fund because of the "M." Others think it's a watered-down version of QQQ, or a newer index, or somehow riskier. None of that is true.
QQQ and QQQM hold the same stocks, in the same weights, tracking the same index. The real question isn't which one performs better — they can't meaningfully diverge. It's which one fits how you actually invest, and whether anyone holding QQQ today should bother switching.
We pulled the live profiles for both funds and ran a 5-year daily backtest to see exactly how close they are, and where the one real difference shows up.
Disclaimer: This article is for educational and informational purposes only. It does not constitute investment advice. Past performance does not guarantee future results. Always do your own research before making any investment decisions.
What QQQM Actually Is
QQQM is the Invesco NASDAQ 100 ETF. It tracks the Nasdaq-100 Index — the 100 largest non-financial companies listed on the Nasdaq — which is the exact same index QQQ has tracked since 1999. Same Apple, Microsoft, Nvidia, Amazon, and the same long tail behind them, at the same weights.
The "M" doesn't stand for momentum. Informally it stands for "Mini," a nod to its lower share price. Invesco launched it in October 2020 for one reason: to give long-term, buy-and-hold investors a cheaper version of QQQ without disrupting QQQ itself.
That last part needs explaining, because it's the whole reason both funds exist. QQQ launched in 1999 as a unit investment trust, an older structure that, unlike a standard open-end ETF, couldn't lend out its holdings to generate revenue that offsets fees. By 2020, QQQ had become one of the most heavily traded securities on the planet, and Invesco didn't want to touch a fund with that much institutional and options activity built around it. So instead of cutting QQQ's fee, they spun up QQQM as a modern open-end ETF aimed at the retail buy-and-hold crowd. Two funds, same index, different jobs.
The Differences That Actually Exist
Since the holdings are identical, everything that separates these two is structural. Here's the current picture.
| Metric | QQQ | QQQM |
|---|---|---|
| Full name | Invesco QQQ Trust | Invesco NASDAQ 100 ETF |
| Index tracked | Nasdaq-100 | Nasdaq-100 |
| Inception | March 1999 | October 2020 |
| Expense ratio | 0.18% | 0.15% |
| Approx. share price | ~$730 | ~$300 |
| AUM | ~$440B | ~$82B |
| Dividend yield | ~0.41% | ~0.44% |
| Options market | Deep, highly liquid | Thin |
A few things worth flagging.
The fee gap is smaller than most articles claim. For years the standard line was "QQQ costs 0.20%, QQQM costs 0.15% — save five basis points." But in December 2025, Invesco lowered QQQ's expense ratio to 0.18% as part of converting it to an open-end structure with an independent board. The real gap today is three basis points, not five. On a $100,000 position that's $30 a year. Not nothing over decades of compounding, but not the chasm some content makes it out to be.
The share price difference is real and practical. QQQM trades at roughly 40% of QQQ's price. If you're investing smaller amounts, or your broker doesn't support fractional shares, a $300 share is easier to size into a portfolio than a $730 one. This is a bigger deal for new or smaller accounts than the fee difference is.
The options market is where QQQ stays untouchable. QQQ has one of the most liquid options chains in existence. If you sell covered calls, buy protective puts, or trade around your position, QQQ is built for that and QQQM isn't. For a pure buy-and-hold investor, this is irrelevant. For an active one, it's the deciding factor.
Five Years, Side by Side
Here's where the "same index" claim either holds up or falls apart. I backtested QQQ and QQQM against each other from January 2021 to May 2026, using daily-precision data with SPY as the benchmark.
One note on the window. The backtest starts in 2021, not 2010, because QQQM didn't exist before October 2020 — its first full year of data is 2021. That's a real limitation worth being honest about: QQQM has a short track record. But since it tracks the same index as QQQ, the pre-2020 behavior of QQQM would have mirrored QQQ almost exactly, minus the fee.
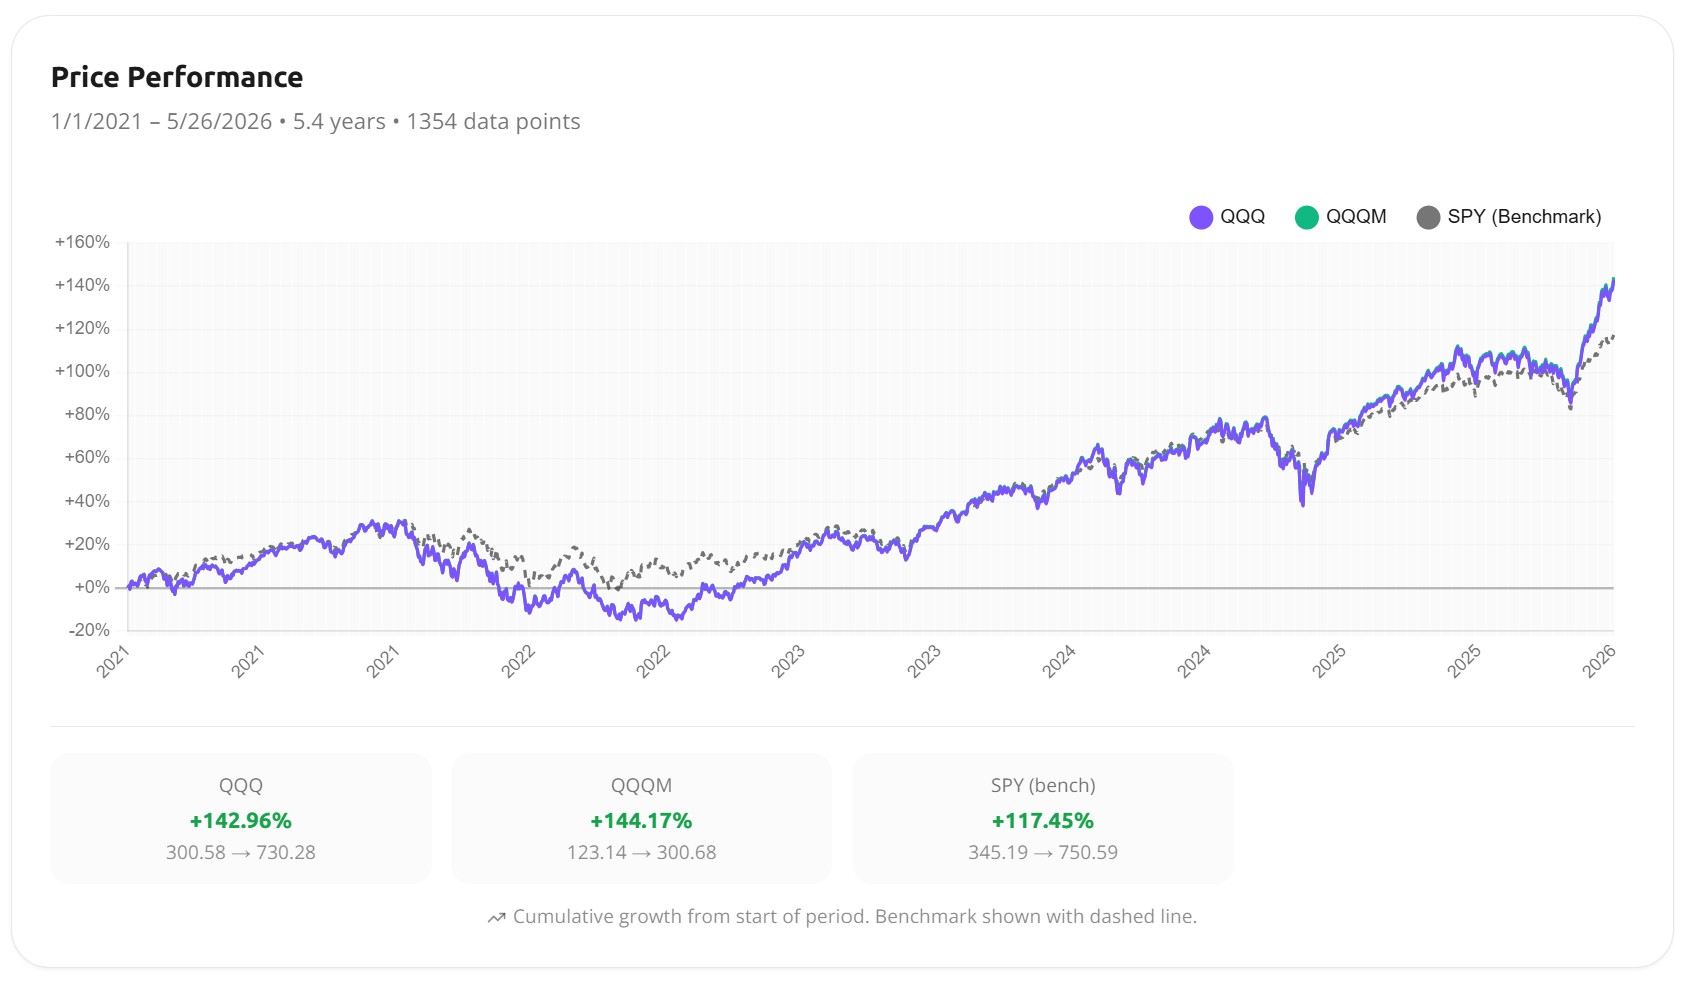
Over 5.4 years and 1,354 daily data points, QQQ returned +142.96% and QQQM returned +144.17%. SPY, for context, returned +117.45%. The two Nasdaq-100 funds are so close their lines overlap on the chart. QQQM nudged ahead by 1.2 percentage points across the entire period — about as small a gap as you'll see between two distinct tickers.
The full metrics table makes the point even harder to miss.
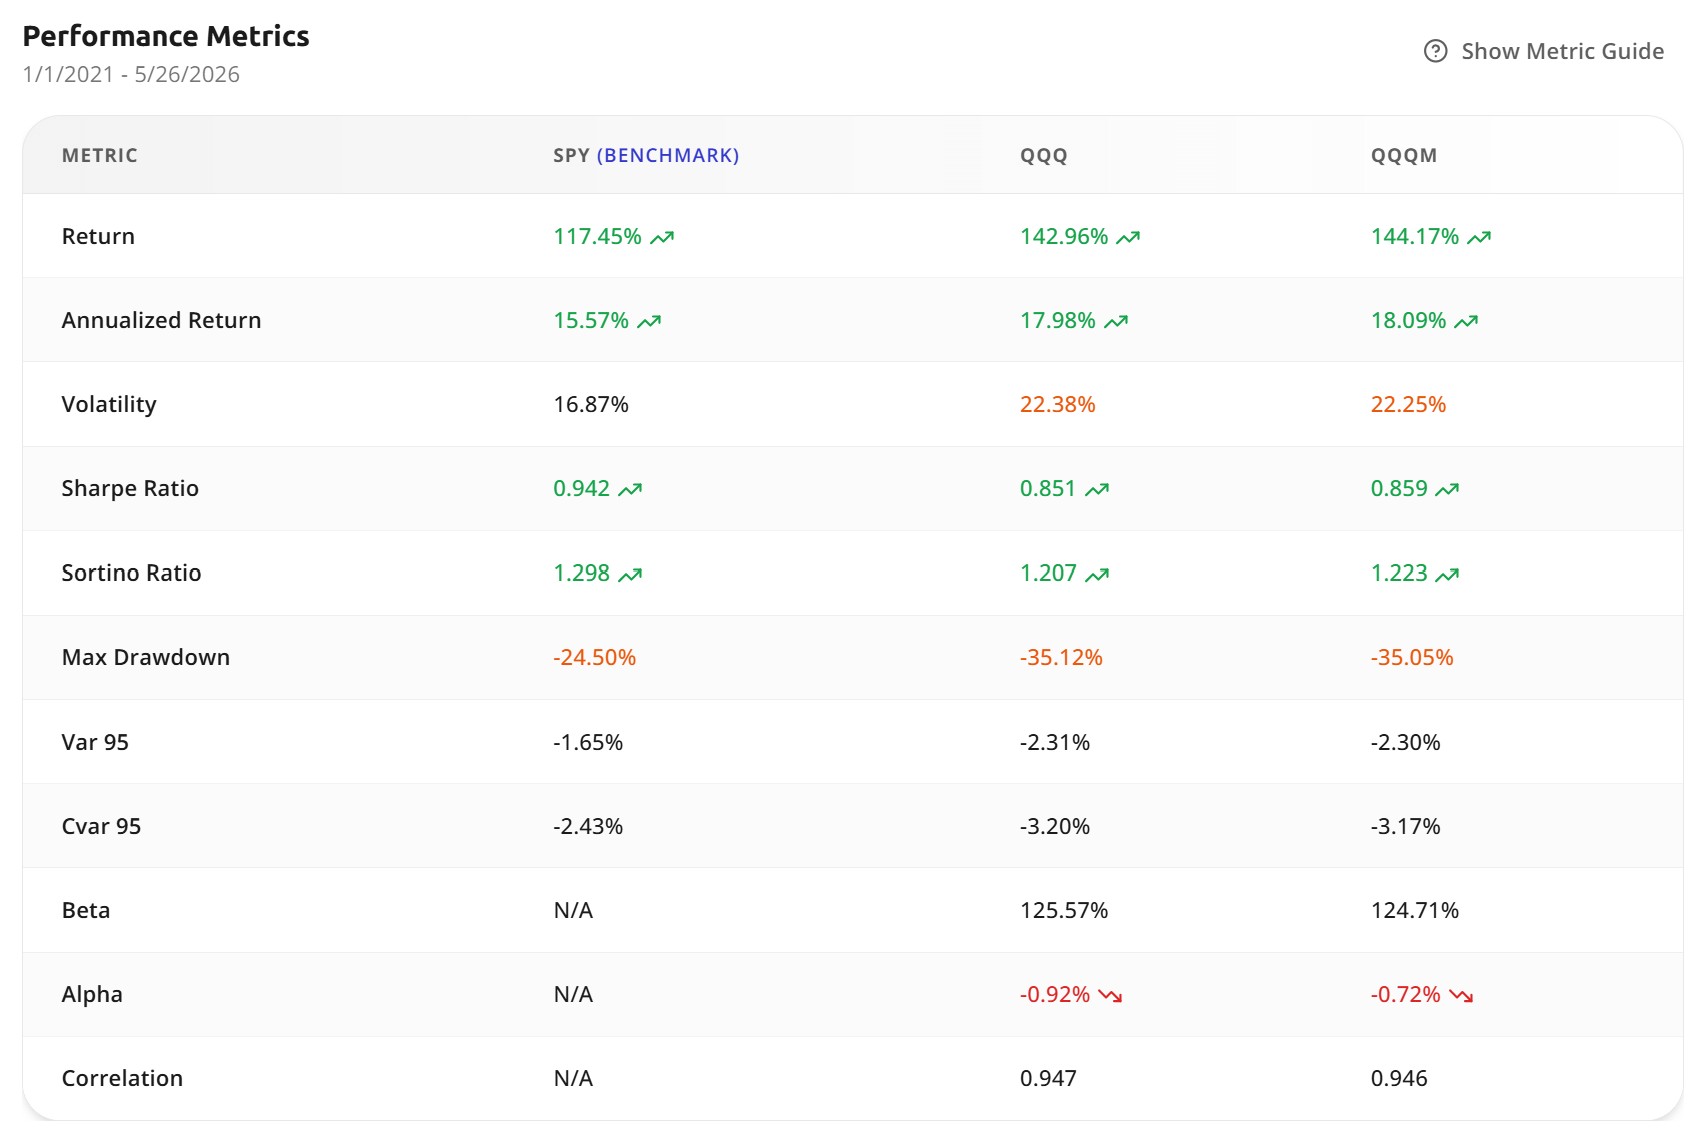
| Metric | SPY | QQQ | QQQM |
|---|---|---|---|
| Total return | +117.45% | +142.96% | +144.17% |
| Annualized return | 15.57% | 17.98% | 18.09% |
| Volatility | 16.87% | 22.38% | 22.25% |
| Sharpe ratio | 0.942 | 0.851 | 0.859 |
| Sortino ratio | 1.298 | 1.207 | 1.223 |
| Max drawdown | −24.50% | −35.12% | −35.05% |
| Correlation w/ SPY | — | 0.947 | 0.946 |
Read across the QQQ and QQQM columns and the numbers are functionally interchangeable. Annualized return: 17.98% vs 18.09%. Max drawdown: −35.12% vs −35.05%. Volatility: 22.38% vs 22.25%. These aren't "similar." They're the same fund, with rounding differences and a sliver of fee drag separating them.
What the table does show clearly is the gap between the Nasdaq-100 funds and the S&P 500. Both QQQ and QQQM took a roughly 35% peak-to-trough drawdown — almost all of it in 2022, when QQQ lost about a third of its value as rates rose and growth multiples compressed. SPY's worst was −24.5%. That's the trade you're making with either Invesco fund: higher returns over this window, but a meaningfully rougher ride. The choice between QQQ and QQQM has nothing to do with that. The choice between the Nasdaq-100 and the S&P 500 has everything to do with it.
Why QQQM Edged Ahead
If the holdings are identical, why did QQQM win at all, even by a hair?
Cost. For most of the backtest window, QQQM charged 0.15% while QQQ charged 0.20% (QQQ only dropped to 0.18% in late 2025). That ~5 basis point annual advantage, reinvested and compounded across five-plus years, is essentially the entire 1.2-point performance gap. There's no stock-picking edge, no structural magic. Lower fees mechanically leave more of the index's return in the fund.
It's a clean illustration of something worth internalizing: when two funds track the same index, the cheaper one wins by definition over a long enough horizon. The only question is by how much, and the answer is "a little."
The Overlap Question
People sometimes ask whether holding both QQQ and QQQM adds diversification. It doesn't, and it's worth understanding why with precision.
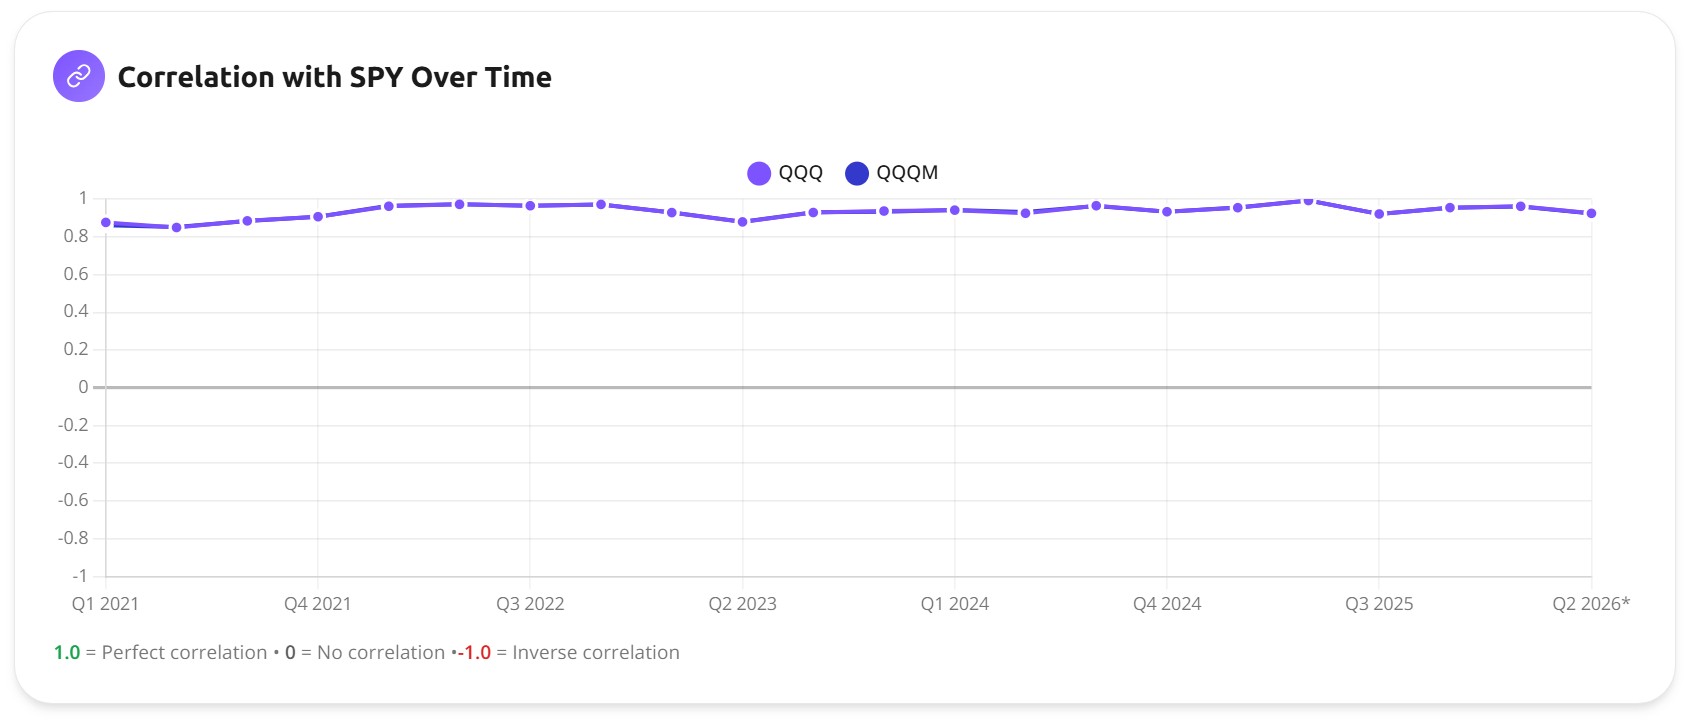
Look closely at the correlation chart above. You see one line, not two. QQQM's correlation curve sits exactly on top of QQQ's, because they hold the same securities and move in lockstep. Their overlap isn't "high" — it's 100%. Owning both is like keeping the same $20 bill in two different pockets and calling it $40.
This is a useful contrast to genuinely overlapping-but-not-identical pairs. VOO and QQQ, for example, share most of QQQ's holdings by weight but produce very different sector exposure, so the overlap question there actually matters. With QQQ and QQQM it's settled before you start. If you want to check the real overlap for ETF combinations where it isn't obvious, you can run any two funds through the overlap analyzer and see the shared weight directly.
Should You Switch from QQQ to QQQM?
This is the question that trips people up, and it's the one most comparison articles skip. The instinct is simple: QQQM is cheaper, so sell QQQ and buy QQQM. For a lot of investors, that instinct is wrong.
If you hold QQQ in a taxable brokerage account and you're sitting on gains — which, after a +142% run, most long-term holders are — selling to switch triggers capital gains tax. You'd realize that gain, hand a chunk to the IRS, and reinvest a smaller amount, all to save three basis points a year. The tax bill can dwarf decades of fee savings. In a taxable account with embedded gains, switching usually makes no sense.
The math flips in two situations. In a tax-advantaged account (Roth IRA, traditional IRA, 401k), there's no taxable event, so switching to the cheaper fund is close to free and reasonable. And if you're starting fresh with new money, there's no reason to buy QQQ over QQQM unless you specifically need the options market or QQQ's liquidity for trading.
So the honest answer depends on which account you're in and whether you're already holding gains. New money in a retirement account? QQQM. Existing QQQ with big gains in a taxable account? Probably leave it alone.
Bottom Line
QQQ and QQQM are the same bet on the same 100 companies. The data doesn't show a winner because there isn't one to find — five years of daily returns put them within a rounding error of each other, and the tiny edge QQQM has is just its lower fee doing its quiet, mechanical work.
So pick based on how you invest, not on which one "performs better." Buy-and-hold in a retirement account, smaller contributions, no interest in options? QQQM is the cleaner choice. Trading around your position, selling calls, moving size? QQQ earns its keep. And if you're already holding one with gains in a taxable account, the smartest move is often to do nothing at all.
If you came here trying to decide between the Nasdaq-100 and something genuinely different, that's a separate and more interesting conversation — and it usually starts with VOO vs QQQ, or with what $10,000 in QQQ over a full decade actually looked like, drawdowns and all.
Want to test these insights on your own portfolios?
Awalyt is a portfolio analysis platform: backtesting on daily data, fundamental analysis, asset analysis, and AI-powered insights.
Get Started FreeRelated Insights
VOO vs QQQ: Which Should You Buy? [2026 Data + Overlap Analysis]
11 min read
TQQQ vs QQQ: The Real Cost of 3x Leverage [2026]
11 min read
If You Invested $10,000 in QQQ 10 Years Ago, Here's What You'd Have Today [2026]
10 min read