Momentum vs Growth ETFs: SPMO vs VUG Backtest [2026]
Two ETFs, the same handful of names at the top, two very different labels. SPMO is a momentum fund. VUG is a growth fund. Open them up and you'll find NVIDIA, Broadcom, and Alphabet sitting near the top of both. So a fair question is whether the difference between them is real or mostly marketing. And if it's real, which one actually rewarded you for holding it?
I backtested both against SPY over the last decade, 2,634 daily data points from January 2016 to June 2026. The answer came out cleaner than I expected, and it runs against the usual assumption that momentum is the riskier bet.
This article is for educational purposes only and is not investment advice. Past performance does not guarantee future results. All figures come from historical backtests and reflect specific time periods that may not repeat.
What momentum and growth actually buy
Growth and momentum sound like cousins, and at the index level they often hold the same megacaps. But they pick those names for different reasons, and that difference shows up when the market turns.
A growth fund like VUG buys companies expected to grow earnings and revenue faster than the market. Once a company qualifies, it tends to stay in until its fundamentals cool off. Turnover is low. You're betting the growth premium holds up.
Momentum works differently. SPMO buys whatever has been going up, based on strong recent price performance, and rotates out when the trend fades. It reconstitutes regularly, so its holdings shift with the market's leadership. In one period the tilt might lean energy; in another, semiconductors. That rotation is the whole point, and it's one of the classic investment factors that researchers have studied for decades.
The results
Over the full period, SPMO returned 602.84%. VUG returned 419.58%. SPY, the benchmark, did 332.49%. In annualized terms that's 20.52% for SPMO, 17.08% for VUG, and 15.04% for the S&P 500.
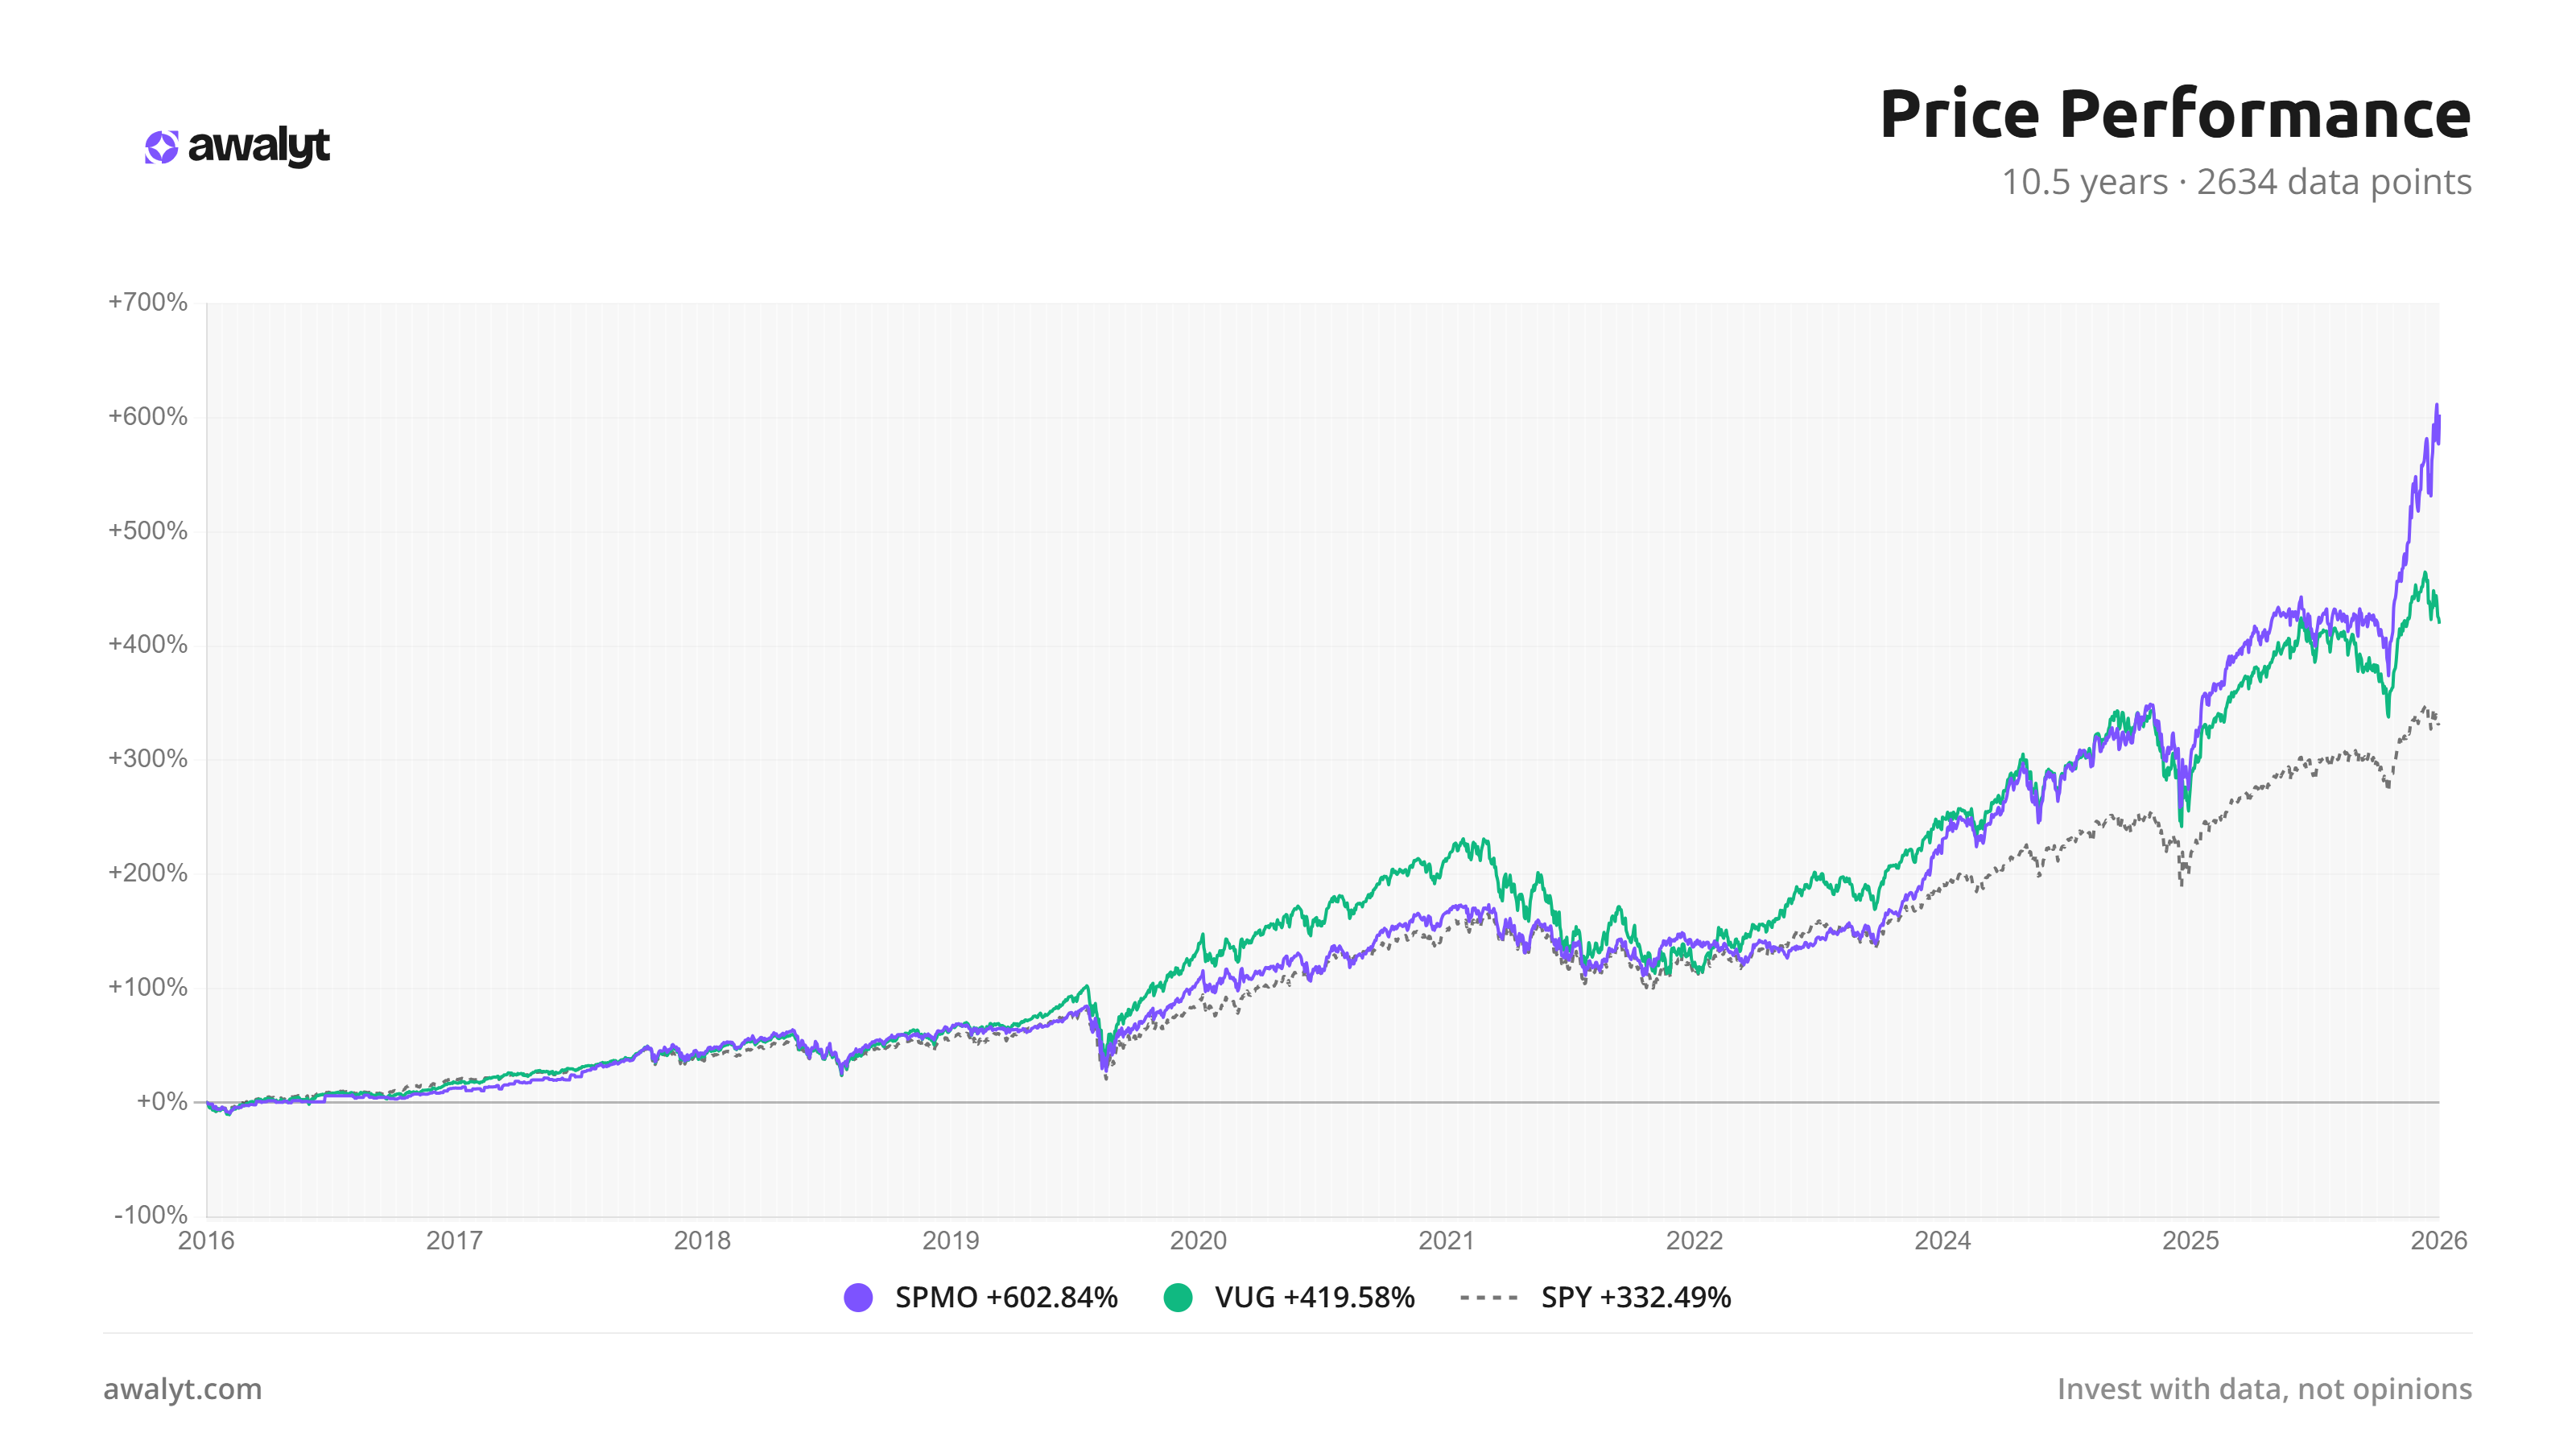
The gap didn't open evenly. For most of the first half of the decade the two tracked each other closely, with VUG often ahead. SPMO pulled away later, and a big part of that separation traces back to a single year. We'll get to it.
The risk-adjusted picture, and the surprise in it
The assumption breaks here. Momentum is usually framed as the higher-octane, higher-risk option. For this pair, the data says the opposite.
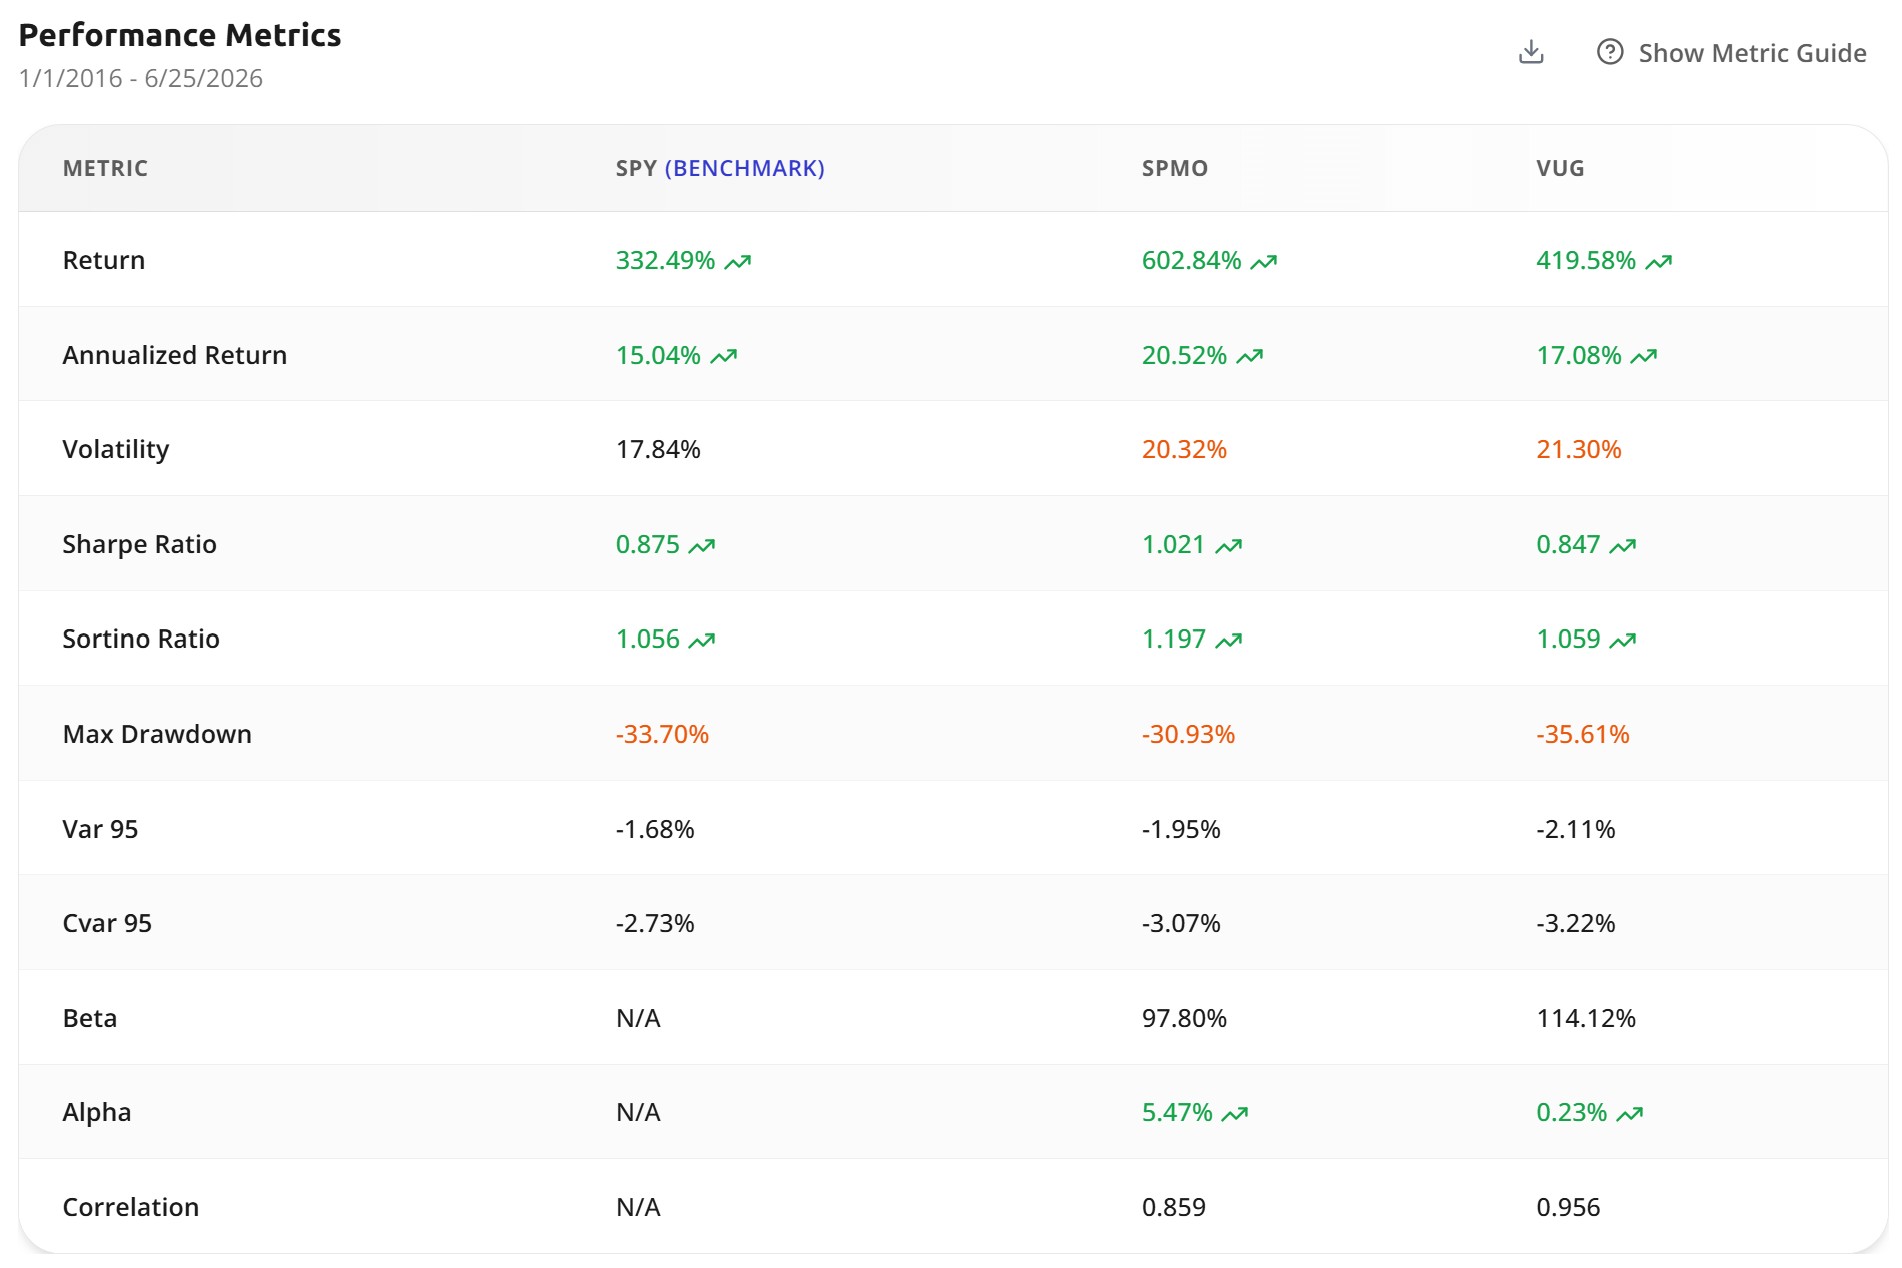
SPMO posted a higher Sharpe ratio (1.021 vs 0.847) and a higher Sortino (1.197 vs 1.059). Its max drawdown was -30.93%, shallower than VUG's -35.61%, and shallower even than SPY's -33.70%. Volatility came in slightly lower too, 20.32% against 21.30%.
The number I'd point to first is alpha. SPMO generated 5.47% of annual alpha over SPY. VUG generated 0.23%, which is effectively none. With a beta of 114%, VUG mostly handed you amplified market exposure: more risk, and the return that comes with carrying more risk, but little the index didn't already give you. SPMO's beta sat just below the market at 98%, and it still beat everything. Market-level risk paired with above-market return is what alpha is supposed to look like.
Year by year: how a long lead got erased
The annual breakdown explains how the fund that led for years ended up behind.
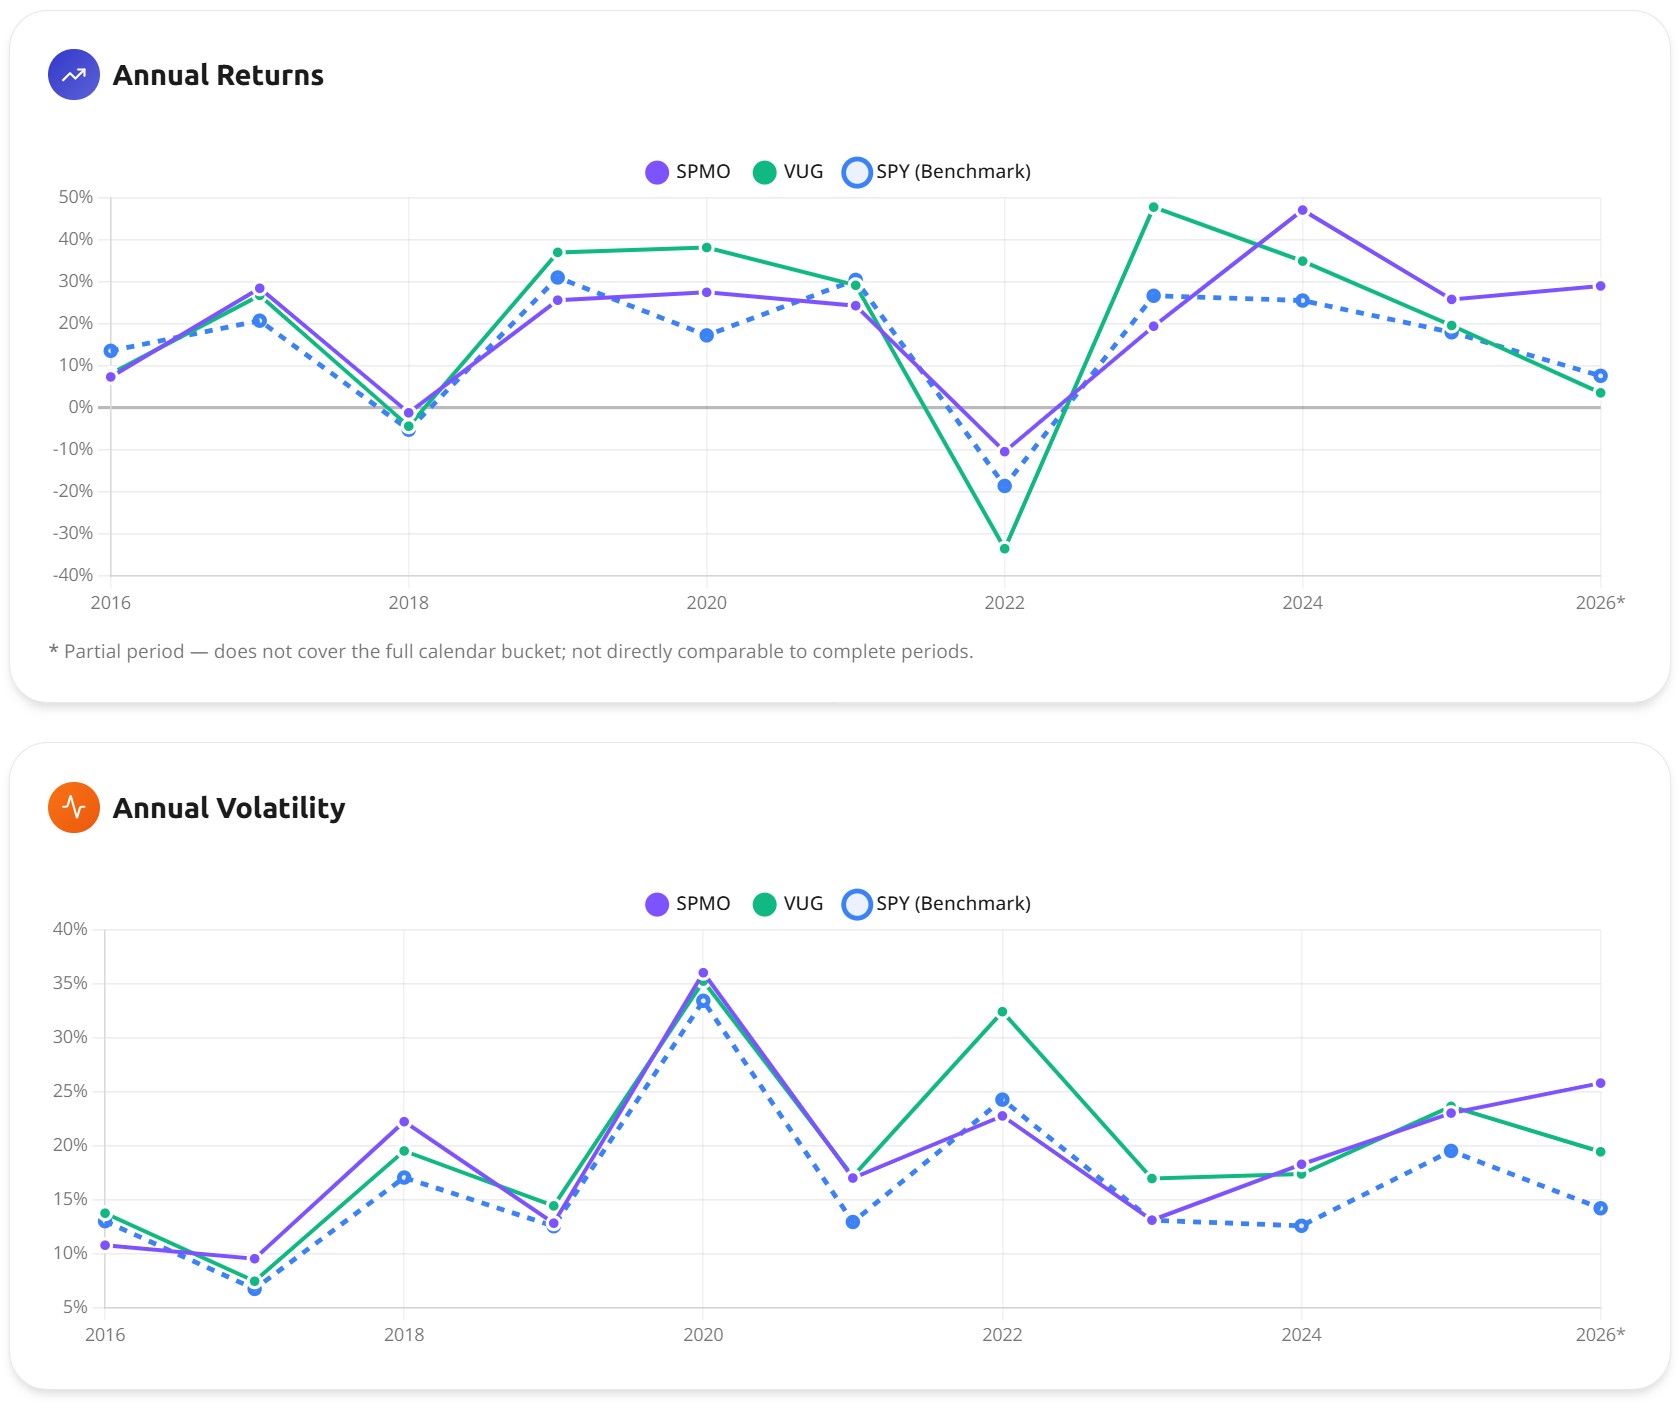
VUG was the stronger performer through the growth-led years. It beat SPMO in 2019, 2020, and 2023, sometimes by a lot, with 2023 a blowout for growth. If you'd checked the scoreboard at the end of 2023, you'd have called growth the better bet.
Then look at 2022. VUG fell roughly a third. SPMO lost about 10%. That single year of capital preservation is most of the story: momentum had already rotated out of the names that cracked, while growth held them all the way down. The volatility chart shows it from another angle, with VUG spiking above 32% in 2022 while SPMO stayed near 23%. SPMO then put up a +47% 2024. Losing less, then compounding from a higher base, is how it overtook a fund that had been ahead for most of the decade.
The overlap nobody checks
It's tempting to look at the shared top holdings and assume these two are near-identical. They're not, and the overlap analysis quantifies why.
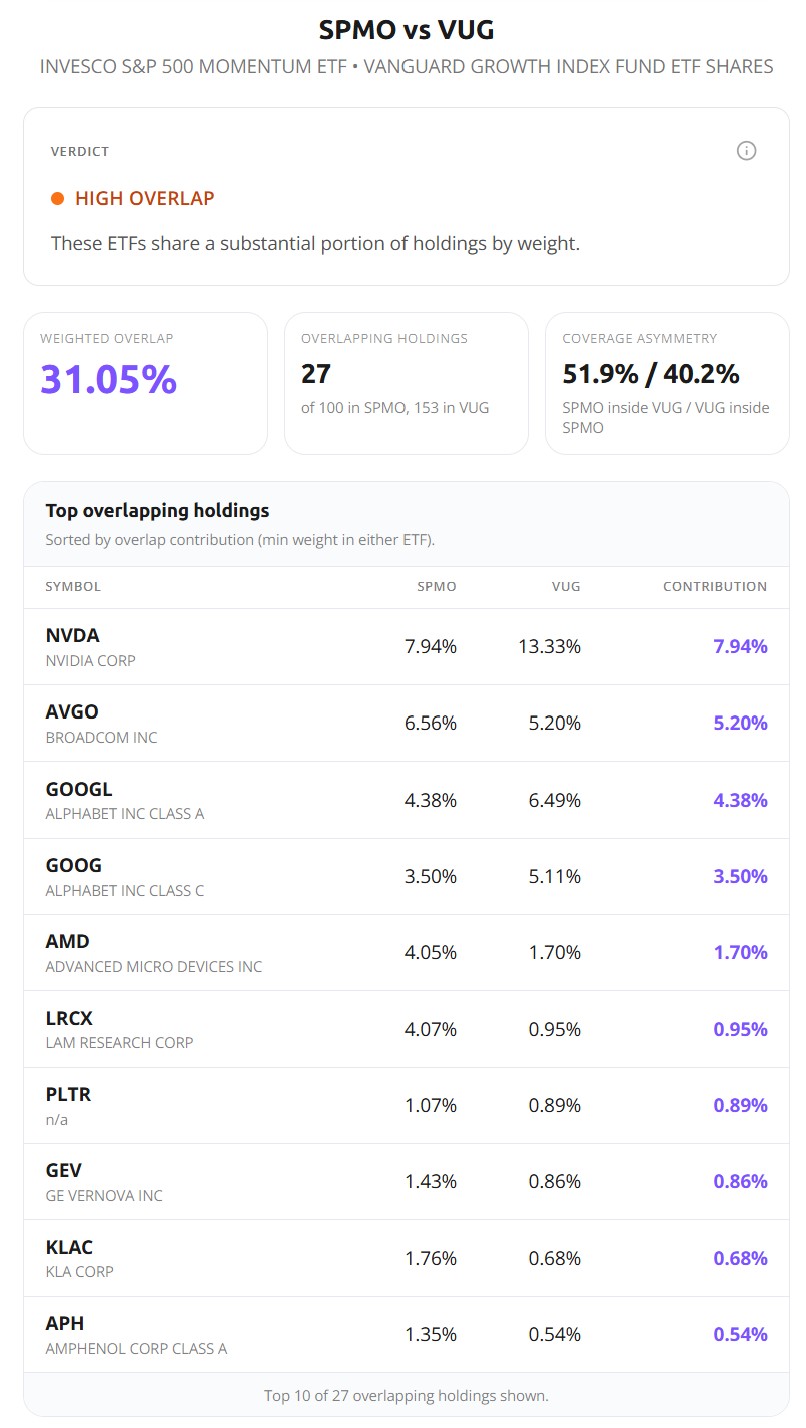
The weighted overlap is 31.05%. They share 27 holdings, but they weight them very differently, and that weighting is what drives the divergence. NVIDIA is 13.33% of VUG and only 7.94% of SPMO. Broadcom is heavier in SPMO. SPMO carries AMD and Lam Research at real weights where VUG barely touches them. Same names near the top, different bets underneath.
The correlations confirm it. VUG correlates 0.956 with SPY, almost moving in lockstep with the index. SPMO correlates 0.859, still high, but loose enough to behave differently when it counts. Hold both and you'd own less diversification than the labels suggest, but more than a glance at the shared megacaps would imply. If you're stacking funds that look different on the cover, it's worth checking the real overlap first.
Which one fits you
So which belongs in your portfolio? The honest answer depends on what you're signing up for.
Momentum's edge here came from discipline you don't control and don't see day to day: the fund's rules forced it out of the losers in 2022. But momentum has its own failure mode. There are stretches where it whipsaws, buying near tops and selling near bottoms, and it can lag for years when leadership churns without a clear trend. The 2016 to 2019 run, when VUG stayed ahead, is a preview of how that feels.
Growth is the simpler story. You're betting that large, fast-growing US companies keep growing. When they do, you win cleanly. When they get repriced, the way they did in 2022, you take the full hit, because the fund holds through it.
Maybe you want the rotation and you're fine that it sometimes rotates wrong. Or you'd rather own a stable basket of growth names and treat the drawdowns as the cost of admission. Neither is a mistake. What this decade shows is narrower than that: on this stretch, momentum's risk control did more for total return than growth's extra beta did.
The bottom line
Ten and a half years of daily data give momentum the win on nearly every axis that matters here: more total return, better risk-adjusted return, a shallower worst case, and real alpha instead of borrowed beta. That's a strong result, and it earns a caveat in the same breath. One decade is one regime. Momentum's longer history is a cycle of long leads and sharp reversals, and the next ten years won't simply replay the last ten. You can test how sensitive that conclusion is to the start and end dates yourself with a daily-data backtest.
If you're weighing SPMO against the plain S&P 500 rather than against growth, that's a different question with a different answer, and it's its own comparison. And if reading this made you want to know how much your own holdings actually overlap before you stack two funds that look different on the label, good. That's usually where real portfolio construction starts.
Want to test these insights on your own portfolios?
Awalyt is a portfolio analysis platform: backtesting on daily data, fundamental analysis, asset analysis, and AI-powered insights.
Get Started Free