What Is Factor Investing? A Practical Guide with 12 Years of Real Data [2026]
This article is for educational purposes and is not financial advice. Past performance does not guarantee future results.
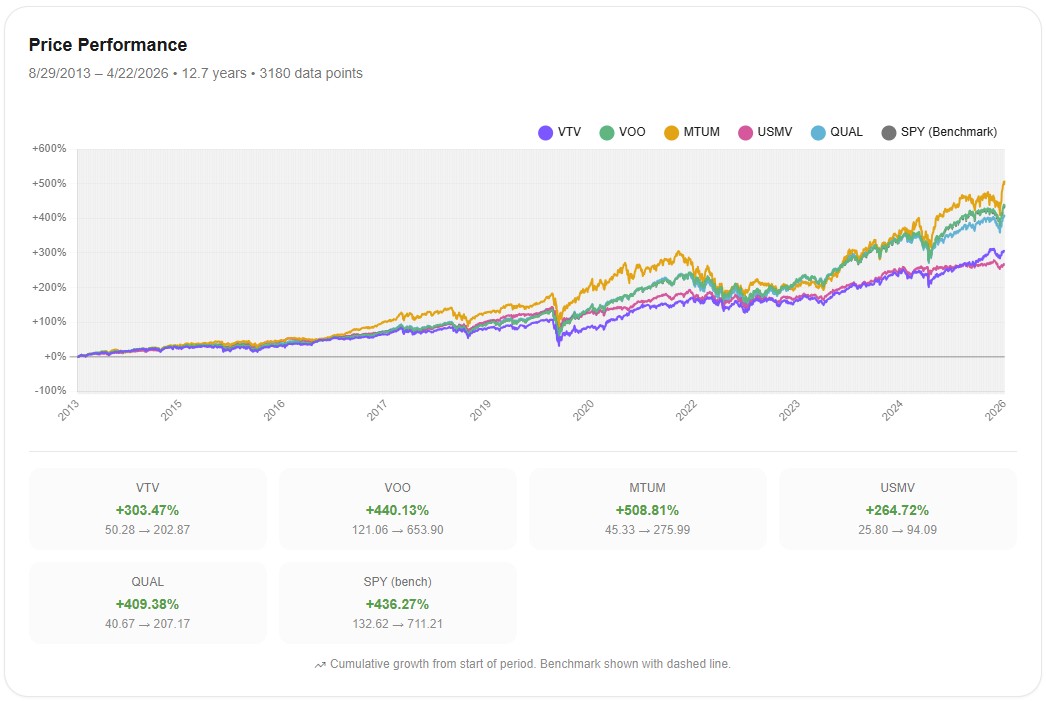
From August 2013 to April 2026, MTUM (the iShares momentum ETF) returned 508.81%. VOO returned 440.13%. That's 68 percentage points of extra return over 12.7 years.
Looking at one number, momentum investing seems like a no-brainer. But over the same period, USMV (low volatility) returned just 264.72%, less than half of MTUM. VTV (value) underperformed VOO by 137 percentage points. QUAL (quality) returned almost the same as VOO but cost more in fees.
Four ETFs, four very different outcomes. The reason isn't random. Each factor has periods when it works and periods when it doesn't, and those periods tend to align with specific macroeconomic regimes — the level of interest rates, the direction of inflation, the strength of trends in the market. Without understanding that connection, comparing factor returns is like comparing umbrella sales without knowing if it rained.
This article walks through what factor investing actually is, what happened to the four largest factor ETFs over the last 12.7 years, and the macro context that explains why some worked and others didn't.
What Is Factor Investing?
Factor investing is a systematic approach to portfolio construction that targets specific characteristics of stocks — characteristics that academic research has shown to drive different returns than the market average over long periods.
The word that matters is "characteristic." A factor isn't a stock or an ETF. It's a measurable property like "low price relative to earnings" (value) or "strong recent price trend" (momentum). A factor ETF is just a fund that mechanically buys stocks scoring high on that characteristic and rebalances on a defined schedule. It's a passive product applying an active rule.
The five most studied factors come down to specific stock characteristics. Value targets stocks priced cheaply relative to fundamentals like earnings or book value, on the idea that statistically cheap stocks tend to outperform expensive ones over time. Momentum does the opposite, buying stocks that have outperformed the market over the past 6 to 12 months and selling those that haven't. Quality filters for companies with high return on equity, stable earnings, and low debt, on the assumption that financially sound businesses deliver more reliable returns. Size captures the small-cap premium — small companies have historically outperformed large ones on a long enough timeline, though with much higher volatility. Low Volatility is the most counterintuitive of the five: stocks with lower historical price variance have, paradoxically, delivered better risk-adjusted returns than theory predicts.
These aren't hunches. They come from decades of academic literature, including the Fama-French three-factor model (1993), Carhart's extension adding momentum (1997), and Fama-French's five-factor model (2015) layering in profitability and investment factors. Eugene Fama himself was awarded the Nobel Prize in Economic Sciences in 2013, in part for the empirical analysis of asset prices that underpins this work. The research is well cited and replicated.
But academic evidence is built on returns before costs and before retail implementation. What survives expense ratios, turnover, tracking error, and behavioral mistakes is a separate question, and that's where this article picks up.
The Most Common Factor ETFs
If you wanted to express each factor with a single low-cost ETF, here's the rough US-market shortlist most retail investors would consider.
For value, VTV (Vanguard Value ETF) at around 0.04% expense ratio is the standard, with IUSV and VOOV as close alternatives. For momentum, MTUM (iShares MSCI USA Momentum) at around 0.15% is the default, with PDP as a less-followed alternative. For quality, QUAL (iShares MSCI USA Quality) at around 0.15% is the most-held, with SPHQ as competition. For low volatility, USMV (iShares MSCI USA Min Vol Factor) at around 0.15% leads the segment, with SPLV (S&P 500 Low Volatility) as the runner-up. Size is usually expressed through small-cap value funds like VBR, since pure small-cap exposure is harder to isolate cleanly.
The expense ratio jump from VOO's 0.03% to factor ETFs at 0.15% is small in absolute terms but meaningful relative to the alpha you're trying to capture. If a factor delivers 1% of alpha per year, paying 0.12% extra gives back 12% of the gain to fees before any tracking error.
What Happened in 12.7 Years
The four ETFs I tested are the most-held factor ETFs in the US retail market: VTV (value), MTUM (momentum), USMV (low volatility), and QUAL (quality). All four were benchmarked against VOO and SPY over the same period: August 29, 2013 to April 22, 2026 — 12.7 years, 3,180 daily data points.
Here's the cumulative performance:
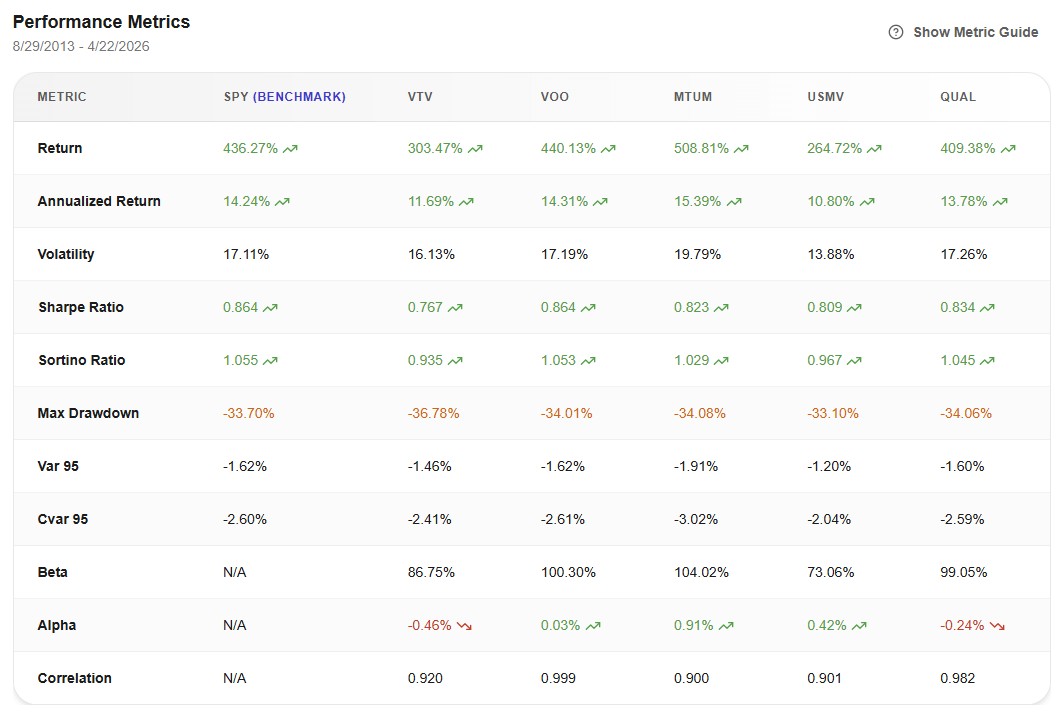
And the headline metrics:
The four factors split into four very different stories. Worth taking each one separately.
Momentum (MTUM)
MTUM is the standout. Annualized return of 15.39% vs VOO's 14.31% — about 1.08% of annualized excess return over 12.7 years, with positive alpha of 0.91%. On a starting investment of $10,000, MTUM ended at about $61,000, while VOO ended at about $54,000. Real outperformance, not noise.
The trade-offs were equally real. MTUM's volatility ran at 19.79% versus VOO's 17.19% — meaningfully higher. Its Sharpe ratio came in at 0.823 versus VOO's 0.864, so on a risk-adjusted basis it scored slightly worse despite the higher absolute return.
The annual returns chart shows where the outperformance came from:
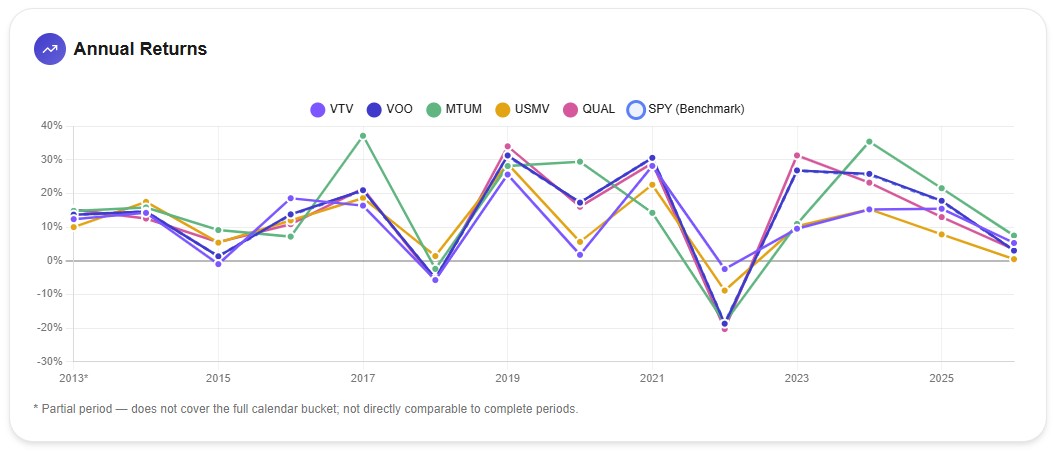
In 2017, MTUM gained around 37% while VOO gained roughly 20%. That single year accounts for a large slice of MTUM's 12-year outperformance. Now look at 2018: MTUM dropped harder than VOO. And 2022: MTUM lost about -21% while VOO lost -18% — the classic momentum crash, when sharp regime reversals turn the strategy upside down.
Momentum tends to work when market trends are persistent. It tends to break when trends reverse sharply. The 2020 and 2022 reversals were exactly the kind of environment where momentum has historically struggled.
Low Volatility (USMV)
USMV delivered exactly what it advertised in one dimension. Volatility came in at 13.88%, materially lower than VOO's 17.19% — about a 19% reduction. That part of the marketing is accurate.
The cost was meaningful. Annualized return of 10.80% versus VOO's 14.31% — a 3.5 percentage point gap per year, compounded over 12.7 years. On the same $10,000 starting investment, USMV ended near $36,000 while VOO ended near $54,000. The Sharpe ratio also came in lower at 0.809 vs VOO's 0.864, meaning the volatility reduction didn't fully offset the return drag.
The part that surprises most investors is the drawdown comparison. USMV's max drawdown over this period was -33.10%. VOO's was -34.01%. Essentially identical. And in 2022, the year low-volatility ETFs were supposed to shine, USMV finished only marginally better than VOO — both losing in the high teens.
This points to a distinction worth making: "low volatility" in the ETF name refers to typical daily and monthly price moves, not to crash protection. When the entire market repriced lower in 2022, USMV repriced with it. The fund doesn't hedge; it oscillates a bit less in normal conditions.
Value (VTV)
VTV's numbers describe a long, consistent underperformance. Annualized return of 11.69% versus VOO's 14.31% — a -2.62% per year gap over 12.7 years. Alpha of -0.46%. On a $10,000 investment, VTV ended near $40,000 while VOO ended near $54,000.
Volatility was slightly lower at 16.13% vs VOO's 17.19%, but not enough to compensate. Sharpe ratio at 0.767 vs VOO's 0.864 — meaningfully worse on a risk-adjusted basis. Max drawdown of -36.78%, the deepest of any ETF in this comparison.
The value factor has decades of academic support. The fact that it underperformed for 12+ years doesn't mean the factor is broken — there's an active academic debate on whether traditional value metrics (price-to-book) still capture the same thing they did in earlier eras, given how much of corporate value now sits in intangibles like patents and software that book value doesn't measure. Researchers like Cliff Asness (AQR) and Robert Arnott (Research Affiliates) have argued that the value premium itself is intact, but the metrics need updating. Others remain skeptical.
What's not debatable is the experience of holding VTV from 2013 to today: 12 years of underperformance, including a -55% drawdown of value vs growth that ended around 2020 — the largest such drawdown since 1963.
Quality (QUAL)
QUAL is the most uncomfortable case to discuss. The factor sounds compelling — own only high-ROE, low-debt, stable-earnings companies. The marketing writes itself.
The data: annualized return of 13.78% vs VOO's 14.31%, a -0.53% per year underperformance. Alpha of -0.24%. Volatility essentially identical at 17.26% vs 17.19%. Correlation with VOO at 0.982 — they move together more than 98% of the time.
In concrete terms: paying 0.15% in expense ratio for a position that's almost the same as VOO at 0.03%. The "quality factor" in this implementation isn't adding meaningful exposure differentiation versus the broad market. It's slightly under-performing it while charging more.
This isn't a critique of the academic quality factor. It's a critique of how this specific ETF expresses it. QUAL holds many of the same mega-cap names that dominate VOO — Apple, Microsoft, Nvidia all score high on quality metrics. The factor screen ends up reproducing much of the index it's supposed to differentiate from.
Why Macro Context Matters
The four stories above look random until you connect them to the macro environment they unfolded in.
The 2013-2021 period was characterized by ultra-low interest rates, low inflation, central bank stimulus, and a powerful, persistent rally led by mega-cap technology stocks. In that environment, momentum kept catching the same winners (Apple, Microsoft, Nvidia kept rising). Low volatility was a drag because steady stocks couldn't keep up with explosive growth names. Value suffered because expensive growth stocks kept getting more expensive. Quality blended in with the index because the largest tech names happened to be high-quality.
Then 2022 changed the regime. Inflation surged. Central banks raised rates rapidly. Long-duration growth stocks repriced sharply lower. In that environment, value rebounded (cheaper, less rate-sensitive stocks held up better), momentum crashed (the leadership changed too fast), and low volatility didn't actually protect capital because nearly everything fell at once.
The pattern, simplified:
Value tends to work better when interest rates are rising and growth premiums compress. It tends to suffer in long periods of cheap money and concentrated growth leadership. Momentum tends to work in clear trending markets and break in sharp reversals. Low volatility tends to add value in choppy, sideways markets and crashes that develop slowly, but offers little protection in fast, broad-based selloffs. Quality tends to behave most like the broad market when mega-cap quality names dominate the index, and differentiates more when small and mid-caps drive returns.
None of this means you can perfectly time which factor to own. Predicting macro regimes is hard, and even professional managers struggle with it. The point is that the factor performance you see in any backtest period reflects the macro environment of that period. A different decade with different rates, different inflation, and different market leadership would produce a different ranking.
This has a practical implication: choosing a factor without any view on the macro environment you're entering is a different kind of decision than choosing it with that view. Both can be reasonable, but they have different risk profiles. One is positioning. The other is closer to a passive bet that the factor will pay off over a long enough horizon to absorb the bad regimes.
Who Is Factor Investing Actually For?
After all this, the more useful question isn't "which factor should I buy?" It's whether factor investing fits the way you actually invest.
Factor investing works best for investors with three things. First, a long horizon — at least 15 to 20 years. The 12.7 years in this article cover most retail investing decisions, and three out of four factor ETFs underperformed VOO. Without a long enough runway, you're more likely to capture the bad regimes than the good ones.
Second, the patience to hold through extended underperformance. VTV underperformed VOO almost continuously from 2014 to 2021. Most investors who bought VTV in those early years didn't make it to the rebound. Factor success is mostly about staying in.
Third, some interest in following macro context. You don't need to be a professional, but if you have no view on whether you're in a rising-rate or falling-rate environment, an inflationary or deflationary regime, a trending or mean-reverting market, you're choosing a factor without knowing whether the wind is at its back. That doesn't mean you'll fail — but it makes the outcome more dependent on luck.
If those three things describe how you invest, factor ETFs can be a reasonable tilt over a broad-market core. A common framework is 70-80% in core funds (VOO/VTI plus VXUS) and 20-30% in factor exposure, chosen based on what you're trying to achieve and your view of the next decade. Replacing the entire equity sleeve with factor ETFs is a much bigger bet than the academic literature actually supports.
If those three things don't describe you — short horizon, low patience for years of lagging the market, no interest in macro — there's nothing wrong with sticking to broad-market funds. VOO/VTI + VXUS + bonds is not a "boring" choice. It's the choice most likely to produce a good outcome for an investor who isn't going to micro-manage their exposure across regimes.
A Practical Framework
For investors who do want factor exposure, the simplest framework I've seen work goes like this.
Keep most of your equity allocation in broad-market core. Add factor tilts as a satellite, not a substitute. Pick factors based on a thesis you understand — whether that's "I expect rates to stay higher for longer, so value should benefit" or "I want lower drawdowns and accept lower expected returns for it, so I'll hold some USMV." Avoid rotating between factors based on what just performed best; that's the path most likely to capture every regime change at exactly the wrong time.
Then backtest the full portfolio, not just the individual ETFs. The interaction between core and factor tilts matters more than the standalone factor return. A 75% VOO + 25% MTUM portfolio behaves quite differently from either component alone, and that's the only relevant question for your actual outcome. Awalyt's daily-precision backtesting can show you the realistic blended behavior across regimes — the 2018 momentum break, the 2020 crash, the 2022 dual decline.
Bottom Line
Factor investing is real. It's grounded in decades of academic research, and at least one of the factor ETFs in this analysis (MTUM) generated genuine alpha over 12.7 years. But the data also shows that two of four factors underperformed VOO meaningfully, one barely differed from it, and the one that worked came with higher volatility and worse drawdowns.
The pattern that emerges across the four cases isn't random. Each factor has macro environments it tends to thrive in and others it tends to suffer in. Investors who take the time to understand those connections — and who can hold through years of underperformance when the regime turns against them — can use factor ETFs as a thoughtful tilt over a broad-market core. Investors without that interest or that patience are usually better served by simple broad-market funds.
There's no wrong answer between the two paths. They just require different things, and being honest about which one fits how you actually invest is more important than picking the "best" factor.
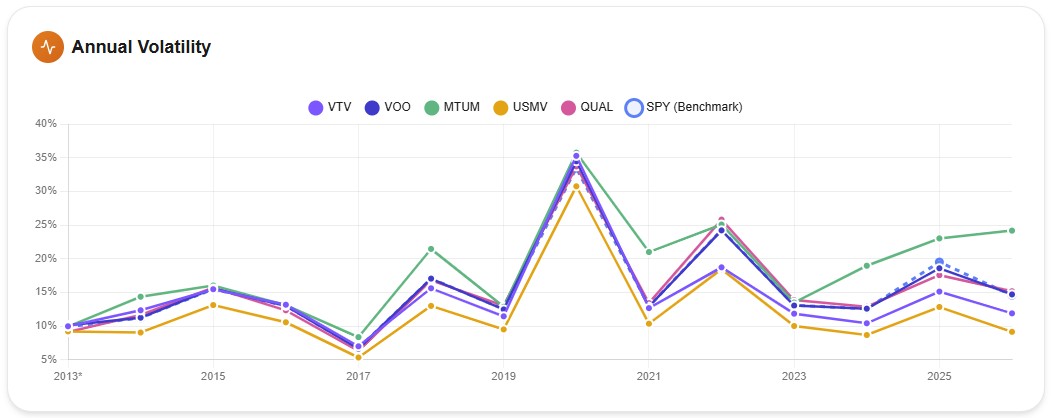
The annual volatility chart below captures something the return numbers don't quite show: the actual experience of holding each ETF year by year. The factor that "won" had years of being the most volatile. The factor with the lowest volatility had years of being the worst performer. That gap between expectation and experience is where most factor strategies fall apart — not in the math, but in the holder.
Key Takeaways
- Factor investing targets specific stock characteristics — value, momentum, quality, size, low volatility — that academic research has linked to different returns than the broad market over long periods.
- In the 12.7 years studied, MTUM (momentum) generated meaningful alpha vs VOO, but with higher volatility and worse drawdowns. USMV (low volatility) reduced volatility but reduced returns more, and didn't offer crash protection in 2022. VTV (value) underperformed VOO by -2.6% per year. QUAL (quality) behaved almost identically to VOO with higher fees.
- Each factor's performance is connected to the macro environment it operates in. The 2013-2021 era of low rates and tech leadership favored momentum and quality, suffered value, and made low volatility a drag.
- Factor investing fits investors with long horizons, patience for extended underperformance, and some interest in macro context. It's a less natural fit for investors who want simple, hands-off exposure.
- Whether to use factor ETFs is less about picking the "best" one and more about whether the strategy aligns with how you actually invest. A broad-market core (VOO/VTI + VXUS) is a perfectly reasonable choice when it does not.
Want to test these insights on your own portfolios?
Awalyt is a portfolio analysis platform: backtesting on daily data, fundamental analysis, asset analysis, and AI-powered insights.
Get Started FreeRelated Insights
How to Check ETF Overlap for Free (VOO vs QQQ) [2026]
9 min read
How to Run a Free DCA Backtest (VOO Example) [2026]
8 min read
10 Years of $300/Month DCA: What Happened on VOO, QQQ, AAPL, and 7 Other Popular Assets [2026]
11 min read