Best Lazy Portfolio? An 18-Year Backtest of 3 Strategies
Three famous lazy portfolios, three names people defend like sports teams, and a forum argument that never really ends about which one is best. The Bogleheads 3-Fund. Ray Dalio's All Weather. Harry Browne's Permanent Portfolio. Each has its loyalists, and each is "the simple, proven answer" depending on who you ask.
The problem is that almost nobody compares them properly. The backtests floating around use different time periods, different ETFs, and different rebalancing rules, so you can never tell whether one portfolio actually won or just got tested over a kinder decade. So we ran all three through the same engine, over the same 18 years, with the same rules — and benchmarked them against the one thing they're all implicitly competing with: just buying the S&P 500.
The window matters here. January 2008 to May 2026 includes the global financial crisis, the COVID crash, and the 2022 bond-and-stock selloff. If you want to know how a "safe" portfolio behaves when things break, this is the period that tells you.
Disclaimer: This article is for educational and informational purposes only. It does not constitute investment advice. Past performance does not guarantee future results. Always do your own research before making any investment decisions.
The Three Portfolios
All three are "lazy" in the same sense: a fixed set of index funds, rebalanced on a schedule, no active decisions. What separates them is how much risk each one is willing to take.
Bogleheads 3-Fund — the equity-heavy one. US stocks, international stocks, bonds. We tested it at 50% VTI, 30% VEU, 20% BND, which is a slightly more international, less bond-heavy version than some Bogleheads run. That detail turns out to matter later.
Ray Dalio All Weather — the balanced one, built around the idea that you can't predict the economy so you hold assets that win in different regimes. Heavy on long-term Treasuries, with stocks, intermediate bonds, gold, and commodities filling out the rest.
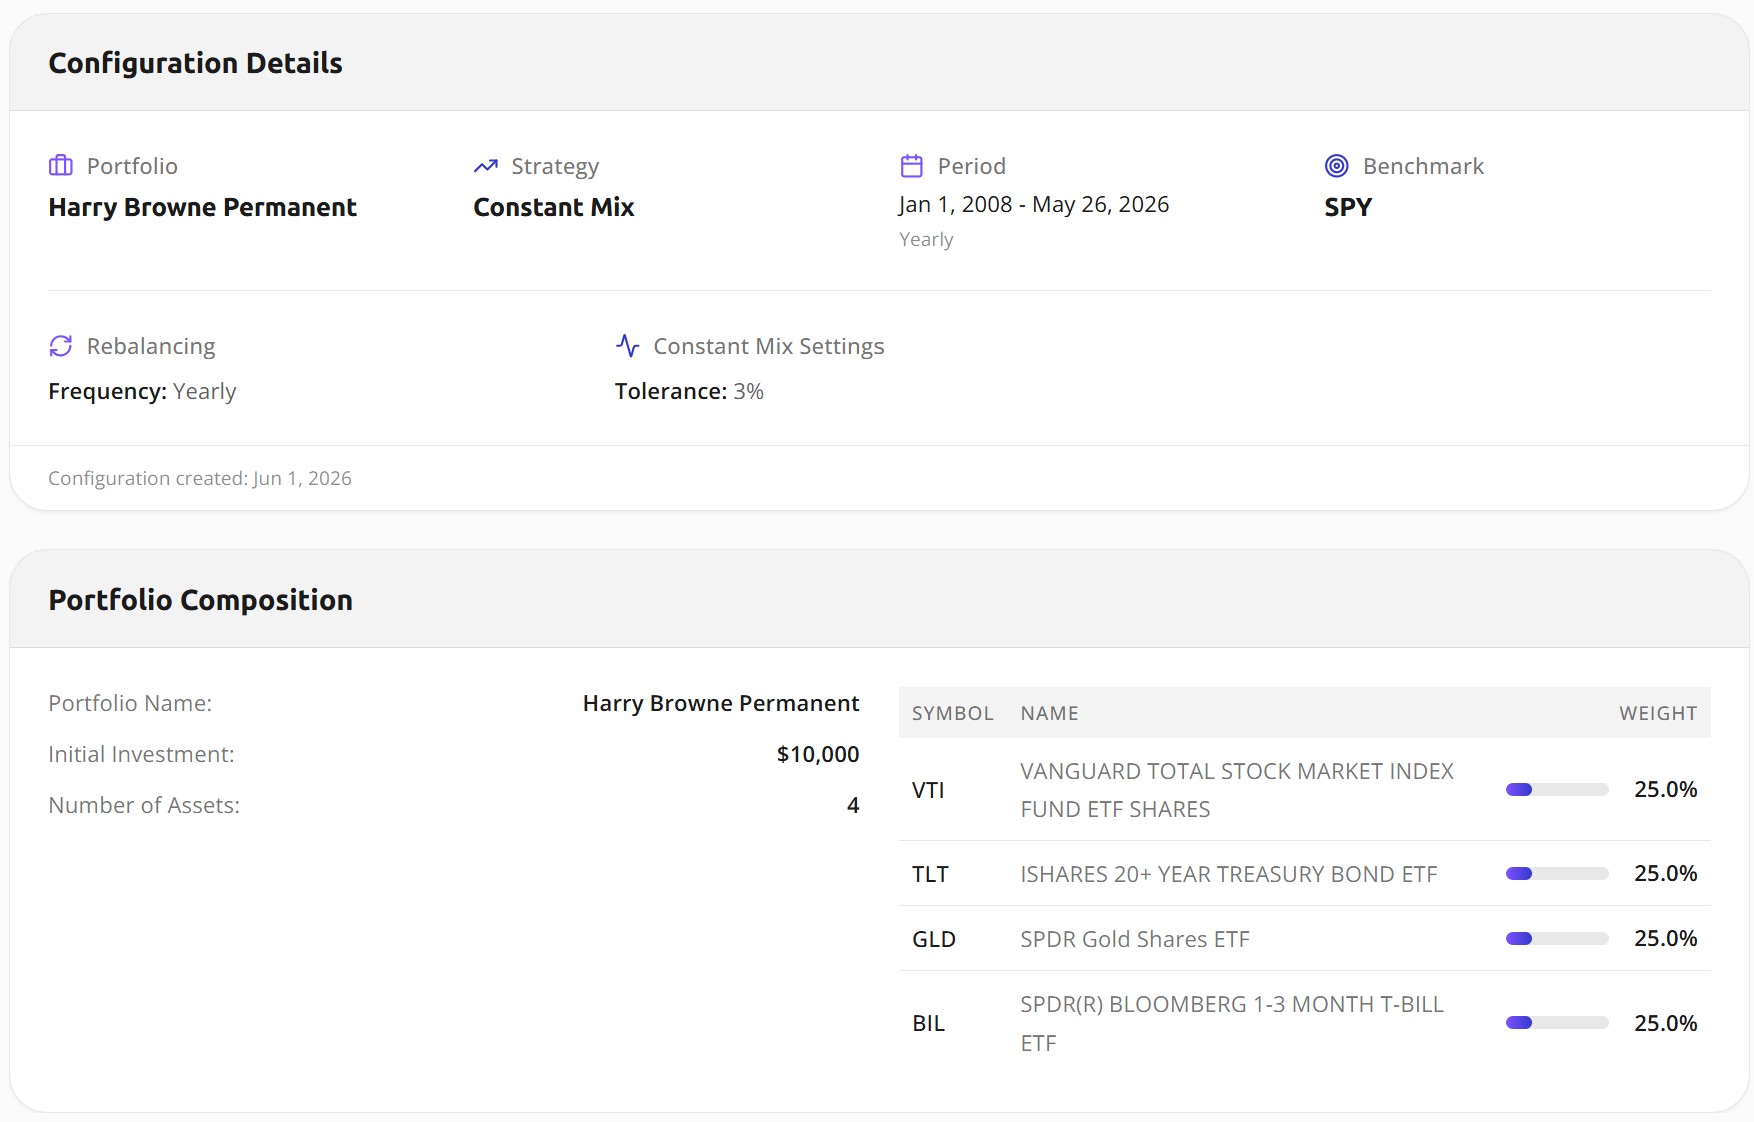
Harry Browne Permanent Portfolio — the most defensive of the three, and the simplest. Four equal slices, 25% each: stocks for prosperity, long-term bonds for deflation, gold for inflation, and cash for tight money. The logic is that something in the portfolio is always doing well.
Here's the exact composition we tested for each one.
| Portfolio | Allocation |
|---|---|
| Bogleheads 3-Fund | VTI 50% · VEU 30% · BND 20% |
| All Weather | TLT 40% · VTI 30% · IEI 15% · GLD 7.5% · DBC 7.5% |
| Permanent Portfolio | VTI 25% · TLT 25% · GLD 25% · BIL 25% |
A couple of methodology notes, since the whole point is a clean comparison. We used VEU instead of VXUS for the 3-Fund's international slice because VEU has price history back to 2007 and VXUS doesn't — it lets us include 2008. For the Permanent Portfolio's cash slice, we used BIL (1-3 month T-bills) as the standard ETF proxy. All three ran on Constant Mix with annual rebalancing, $10,000 starting capital, and SPY as the benchmark, across daily-precision data — 18.4 years and more than 4,600 data points.
The Results: S&P 500 Won the Return Race
Let's get the headline out of the way, because it's not close.
| Metric | 3-Fund | All Weather | Permanent | SPY |
|---|---|---|---|---|
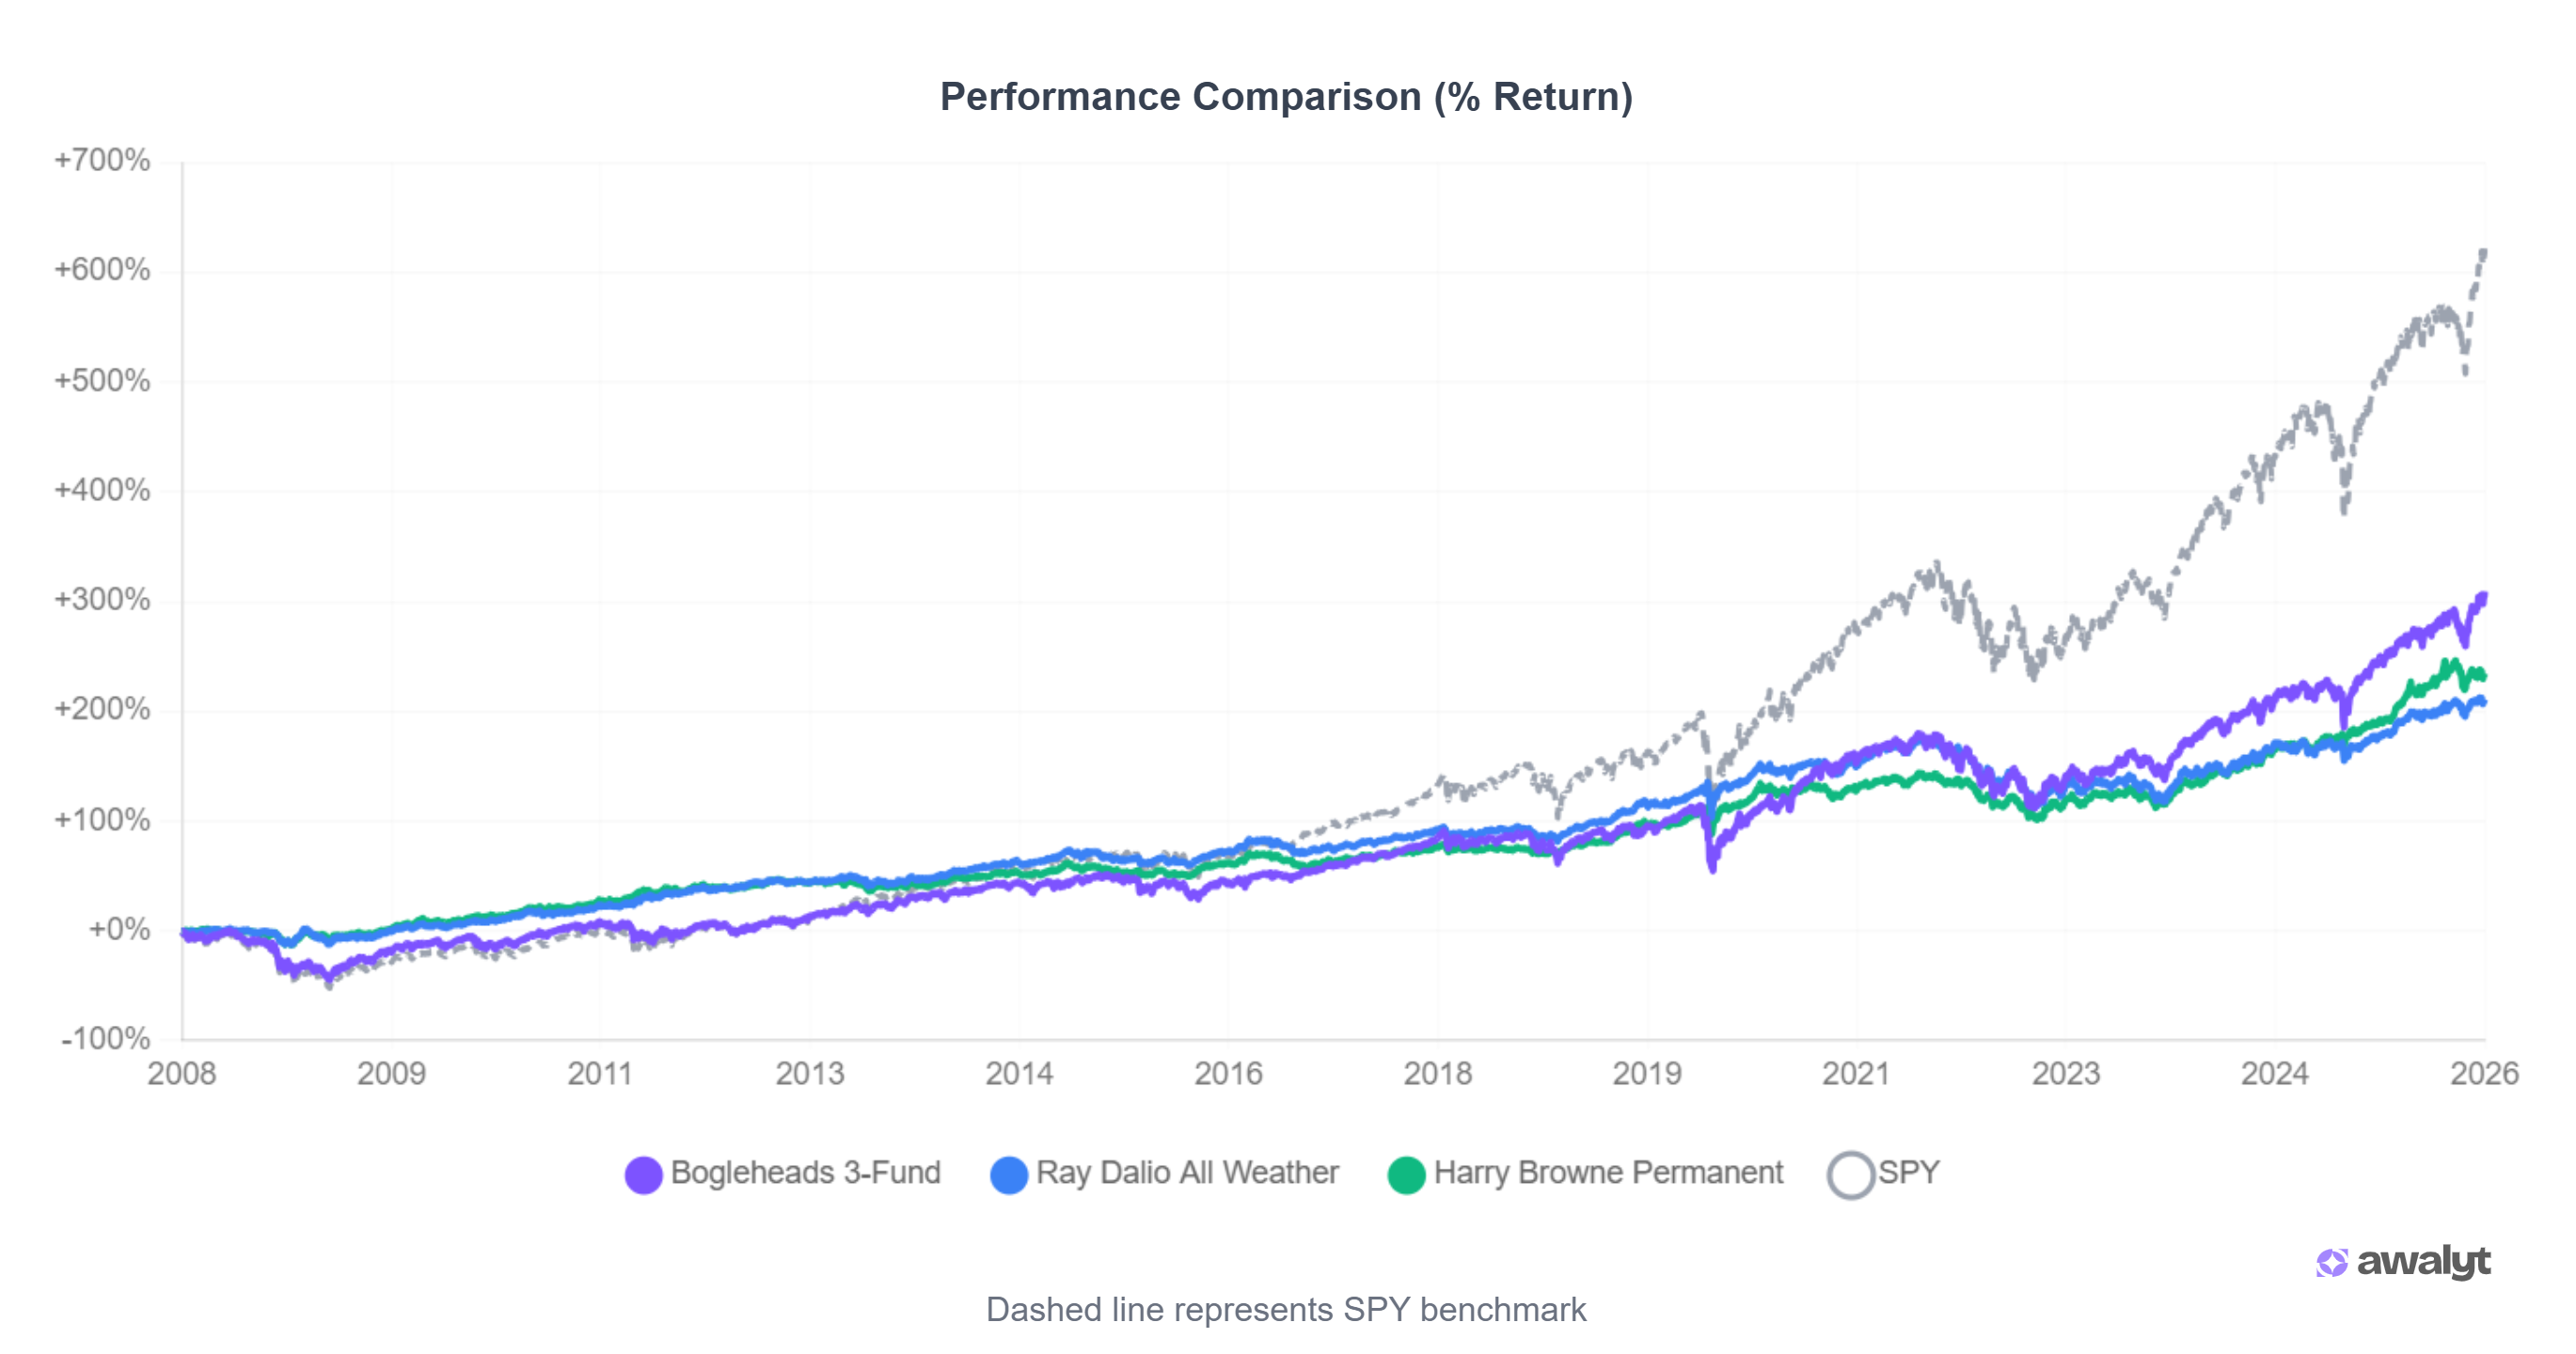
| Total return | +309.21% | +211.03% | +234.58% | +621.67% |
| CAGR | 7.96% | 6.36% | 6.78% | 11.34% |
| Final value of $10k | $40,921 | $31,103 | $33,458 | $72,167 |
| Volatility | 15.73% | 7.99% | 7.43% | 19.84% |
| Max drawdown | −44.89% | −22.83% | −17.55% | −51.86% |
| Sharpe ratio | 0.57 | 0.82 | 0.92 | 0.64 |
| Sortino ratio | 0.70 | 1.12 | 1.26 | 0.78 |
| Beta | 0.77 | 0.20 | 0.18 | 1.00 |
| Alpha | −0.92% | +4.00% | +4.63% | 0.00% |
If your only question is "which made the most money," the answer is none of them. A plain S&P 500 position turned $10,000 into about $72,000, nearly double the best lazy portfolio. The 3-Fund came second at roughly $41,000, with the Permanent and All Weather trailing around $31,000–33,000.
This is the part most lazy-portfolio advocates skip past quickly, so let me be blunt about it: over a period dominated by one of the strongest US equity bull markets in history, diversifying away from US stocks cost you a lot of upside. That's not a knock on these portfolios. It's just what the return column says, and pretending otherwise would be dishonest.
But return is one column out of nine. The rest of the table tells a completely different story.
The Results: The Defensive Portfolios Won Everything Else
Look at the same table again, this time at the risk rows, and the ranking flips.
The Permanent Portfolio posted a 0.92 Sharpe ratio — higher than SPY's 0.64 and far above the 3-Fund's 0.57. Its Sortino ratio, which only penalizes downside volatility, was 1.26 versus SPY's 0.78. It did this while taking a third less volatility: 7.43% against SPY's 19.84%.
Then there's the number that actually matters when markets break. SPY's worst peak-to-trough loss over these 18 years was −51.86%. The Permanent Portfolio's was −17.55%. All Weather sat at −22.83%. Put plainly: at the bottom of the worst stretch, an S&P 500 investor was down more than half their money, while a Permanent Portfolio investor was down less than a fifth.
That gap is the whole trade. These portfolios don't try to beat the market. They try to lose less when it falls apart, and they succeeded dramatically. A −52% drawdown is easy to shrug at in a backtest and brutal to live through — it's the kind of loss that makes people sell at the bottom and never come back. Cutting it to −17% changes whether you actually stay invested long enough to earn anything at all.
The alpha and beta rows confirm the mechanism. All Weather and Permanent ran betas of 0.20 and 0.18, meaning they barely moved with the market, and both produced positive alpha (+4.00% and +4.63%). They weren't just along for the ride — they generated risk-adjusted value the index didn't.
Where It All Shows Up: 2008
Averages over 18 years hide the moment that defines a defensive portfolio. So look at 2008 specifically, because that's when the differences stopped being theoretical.
During the 2008 crash, stocks fell roughly 50%. The 3-Fund, at 80% equities, fell with them — its −44.89% max drawdown is almost entirely a 2008 event. SPY's −51.86% is the same story. But the All Weather and Permanent portfolios held assets that were moving the other way while stocks collapsed.
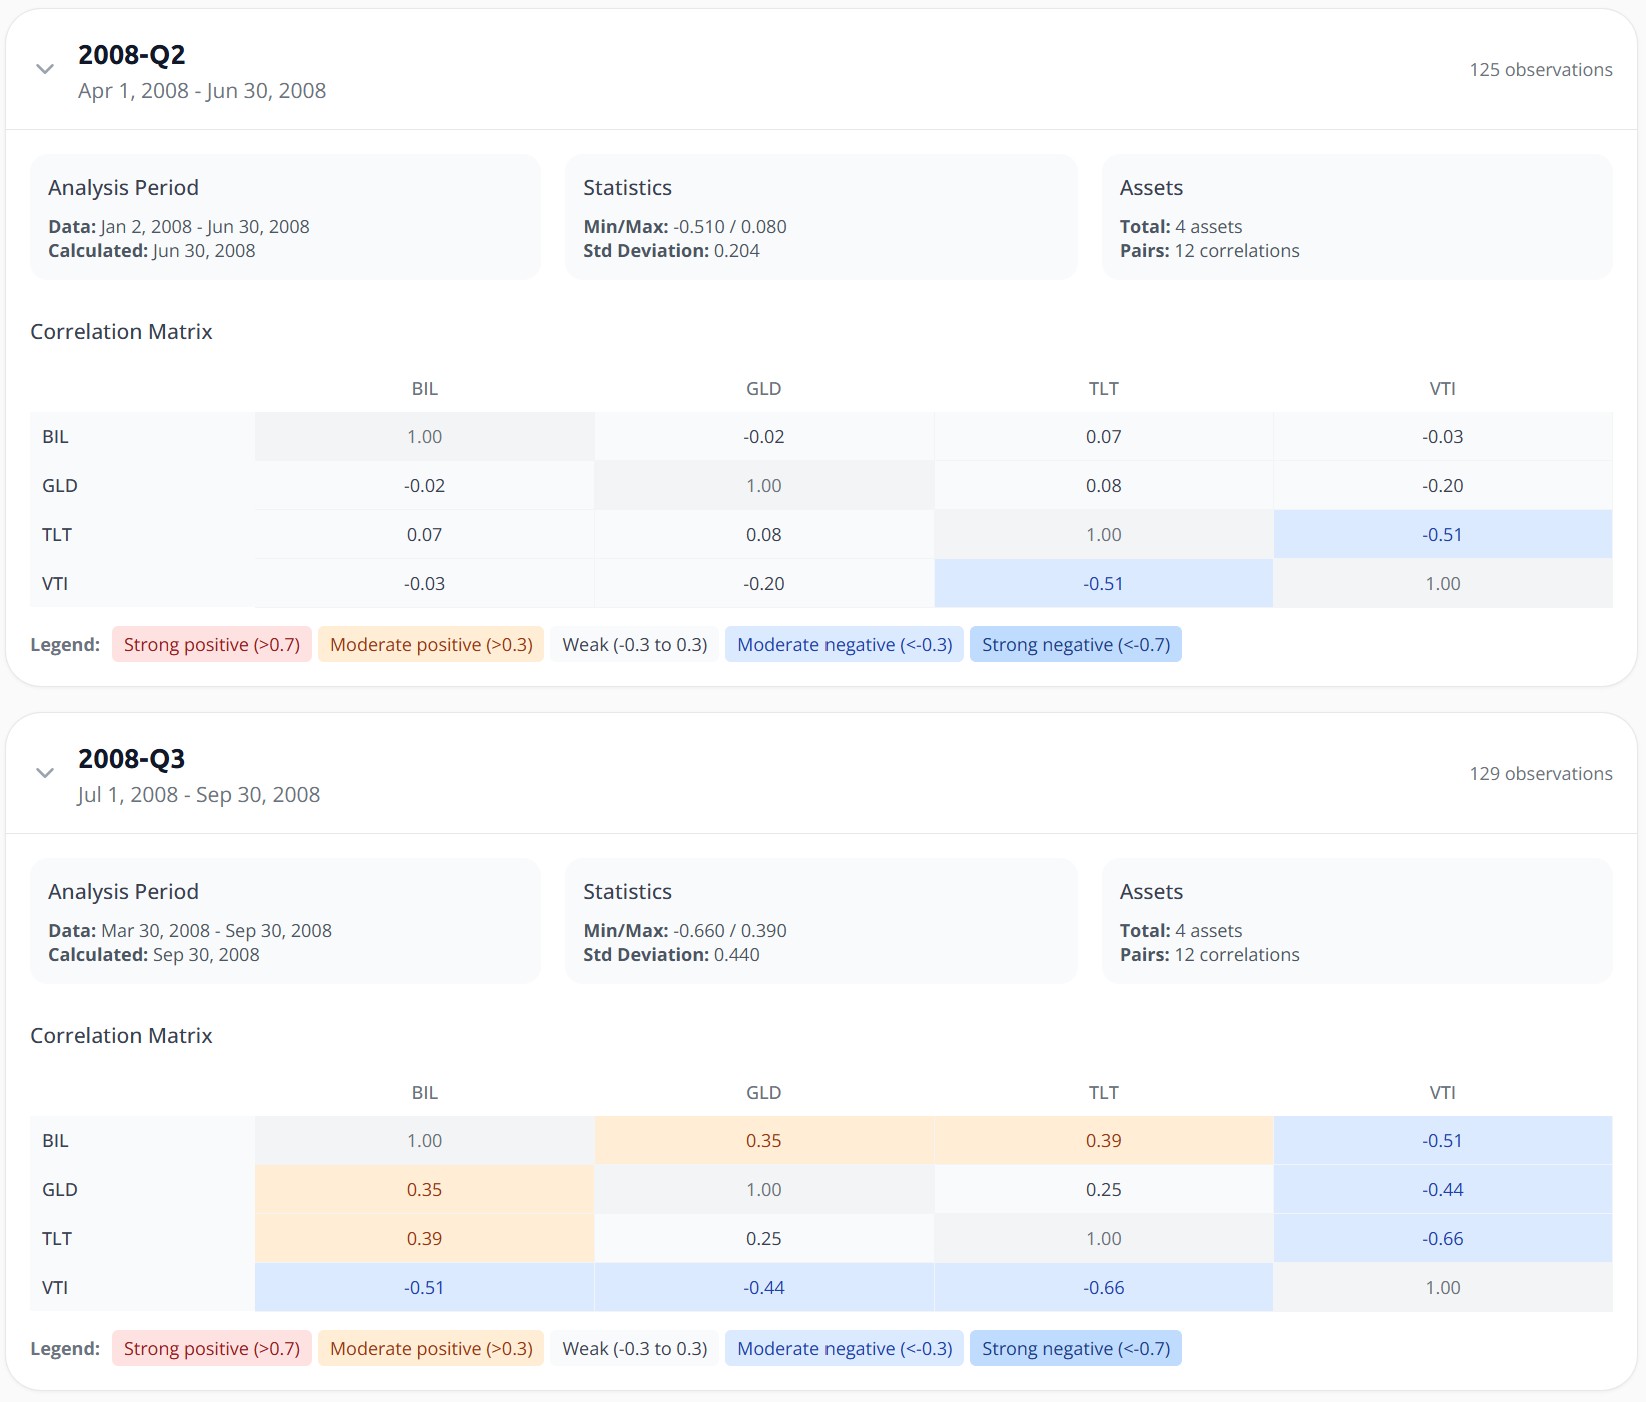
This correlation matrix from the third quarter of 2008 is the entire thesis in one image. As US stocks (VTI) cratered, long-term Treasuries (TLT) ran the opposite direction at a −0.66 correlation, gold (GLD) at −0.44, and even cash (BIL) at −0.51. While one quarter of the Permanent Portfolio was getting destroyed, the other three quarters were flat or rising. That's not luck — it's the design working exactly as Browne intended.
This is also the cleanest argument for why monthly-data backtests mislead. Correlations and drawdowns spike inside a quarter, not neatly at month-ends, and a tool that only samples monthly smooths over the worst days. The −17.55% drawdown you see here is measured on daily data; a monthly tool would likely report something shallower and flatter, which is exactly the kind of false comfort that gets people in trouble.
The 3-Fund Surprise
Here's the result that should make committed Bogleheads pause: the 3-Fund had the lowest Sharpe ratio of all four, below even plain SPY, and the only negative alpha in the group (−0.92%).
How does the "diversified" portfolio end up with the worst risk-adjusted return? Two reasons, both visible in how we built it. First, at 80% equities (50% VTI plus 30% VEU), it carried nearly all of the stock market's volatility — 15.73%, much closer to SPY than to the defensive pair. Second, the international slice was a drag for most of this period; US stocks crushed international from 2008 onward, so 30% in VEU pulled returns down without meaningfully cutting risk. You got most of the downside of stocks and a chunk of international underperformance, with only 20% bonds to cushion it.
The lesson isn't that the 3-Fund is a bad portfolio — it still grew $10k into $41k and beat the two defensive options on raw return. It's that "diversified" and "best risk-adjusted" are not the same thing. A 3-Fund weighted more toward bonds, or less toward international, would look different. The specific 50/30/20 split we tested happened to land in an awkward middle: too much equity to be calm, too much international and bonds to keep pace with the S&P 500.
Which One Fits You
The data doesn't crown a single winner, because these portfolios answer different questions. The honest way to choose is to figure out which question is actually yours.
Are you decades from needing this money, and genuinely able to watch it fall 50% without touching it? Then the defensive portfolios are costing you a lot of growth for protection you don't need, and a higher-equity allocation — even plain SPY — probably serves you better. The catch is the word "genuinely." Most people think they can sit through a −50% drawdown until they're actually staring at one.
Or are you within sight of retirement, or simply someone who knows you'd panic and sell at the bottom? Then the Permanent Portfolio's −17.55% worst case isn't weakness, it's the entire point. You'd have given up roughly half of SPY's return over this stretch, but you'd have slept through 2008, 2020, and 2022 — and you'd have actually stayed invested, which is worth more than any backtested CAGR.
The All Weather sits between those, and the 3-Fund — at least in this allocation — turned out to be the least efficient of the four. If you're drawn to the 3-Fund's simplicity, the takeaway is to be deliberate about the bond and international weights rather than defaulting to a split someone posted on a forum.
One Caveat Worth Sitting With
There's a tailwind hiding in these numbers, and it's only fair to name it. From 2008 to 2021, long-term Treasury bonds had an extraordinary run as interest rates fell toward zero. TLT is 40% of the All Weather and 25% of the Permanent Portfolio, so a meaningful slice of their defensive magic over this window came from a bond bull market that's unlikely to repeat. 2022 was the preview of the other side: rates rose, and bonds fell alongside stocks instead of cushioning them. Both defensive portfolios had a rough 2022 for exactly that reason.
So read the risk metrics as real, but not as a promise. The diversification logic — holding assets that usually zig when stocks zag — is sound. The specific magnitude of protection these portfolios delivered leaned partly on a bond environment we may not see again.
Bottom Line
Eighteen years and three crashes later, the scoreboard is split cleanly. The S&P 500 won on return and lost on everything else. The Permanent and All Weather portfolios won on risk, drawdown, and risk-adjusted return while giving up roughly half the growth. The famous 3-Fund landed in between and, in this allocation, was the least efficient of the bunch.
None of that tells you what to buy. What it tells you is that "best lazy portfolio" is the wrong question. The right one is how much return you're willing to trade for how much calm — and whether you're being honest with yourself about the version of you that shows up during a −50% year.
If you want to go deeper on any single piece of this, we've broken down the 3-Fund against the S&P 500 on its own, tested whether rebalancing actually helped the All Weather, and looked specifically at what gold does to a portfolio's drawdowns — the 25% slice doing a lot of the Permanent Portfolio's heavy lifting here.
Want to test these insights on your own portfolios?
Awalyt is a portfolio analysis platform: backtesting on daily data, fundamental analysis, asset analysis, and AI-powered insights.
Get Started FreeRelated Insights
Daily vs Monthly Data in Backtesting — Does It Matter? [2026]
11 min read
Does Rebalancing Actually Improve Returns? We Tested the All Weather Portfolio Over 16 Years [2026]
13 min read
Bogleheads 3-Fund Portfolio vs S&P 500: A 14-Year Backtest with Real Data [2026]
14 min read