60/40 vs 80/20 vs 90/10: VOO/BND Backtest Results (15 Years) [2026]
Ask ten investors how much of their money should be in bonds. You'll get ten different answers, and most of them will sound confident.
Sixty-forty is what your financial advisor probably suggested. Eighty-twenty is what half the YouTube channels recommend for "moderate" investors. Ninety-ten is the split Warren Buffett famously tells people to aim for. And since 2022, there's a loud crowd online saying bonds are finished — just buy the S&P 500 and forget the rest.
So who's right?
We pulled 15 years of daily data and ran the numbers on all three allocations. From April 2011 to April 2026 — through the longest bull run in memory, the COVID crash, the 2022 bond meltdown, and the recovery after.
The data doesn't crown a winner. But it makes a few things really clear.
Disclaimer: This article is for educational and informational purposes only. It does not constitute investment advice. Past performance does not guarantee future results. Always do your own research before making any investment decisions.
What We Tested
Two ETFs form the base of every portfolio we backtested:
- VOO — Vanguard S&P 500 ETF
- BND — Vanguard Total Bond Market ETF
Three allocations:
- 60/40 — 60% VOO / 40% BND
- 80/20 — 80% VOO / 20% BND
- 90/10 — 90% VOO / 10% BND
We also ran SPY as the 100% equity benchmark. That's the comparison point everyone actually cares about when deciding whether to add bonds at all.
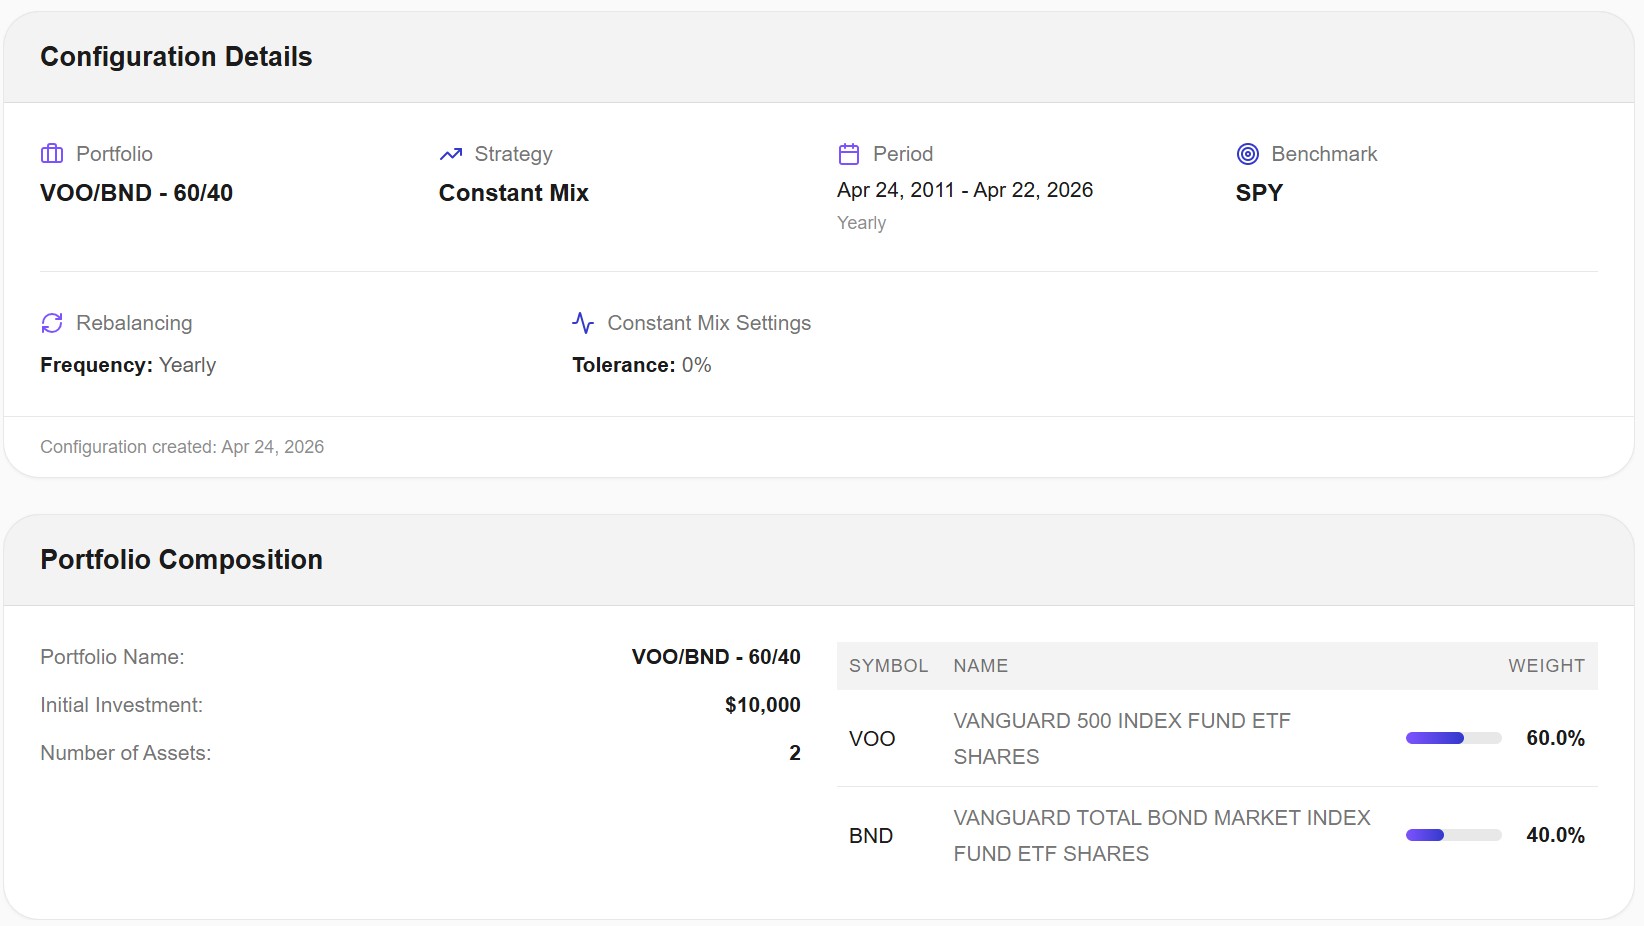
Test period: April 2011 – April 2026 (15.0 years exactly, 3,771 daily data points)
Rebalancing: Annual, Constant Mix strategy, 0% tolerance
Annual rebalancing reflects how most DIY investors operate: once a year, bring the portfolio back to target, move on with your life. Quarterly or semi-annual rebalancing produces marginally different results on a 15-year horizon, but nothing that changes the conclusions. I stuck with annual for consistency with our other backtests and for tax efficiency reasons that matter outside simulation.
The Results
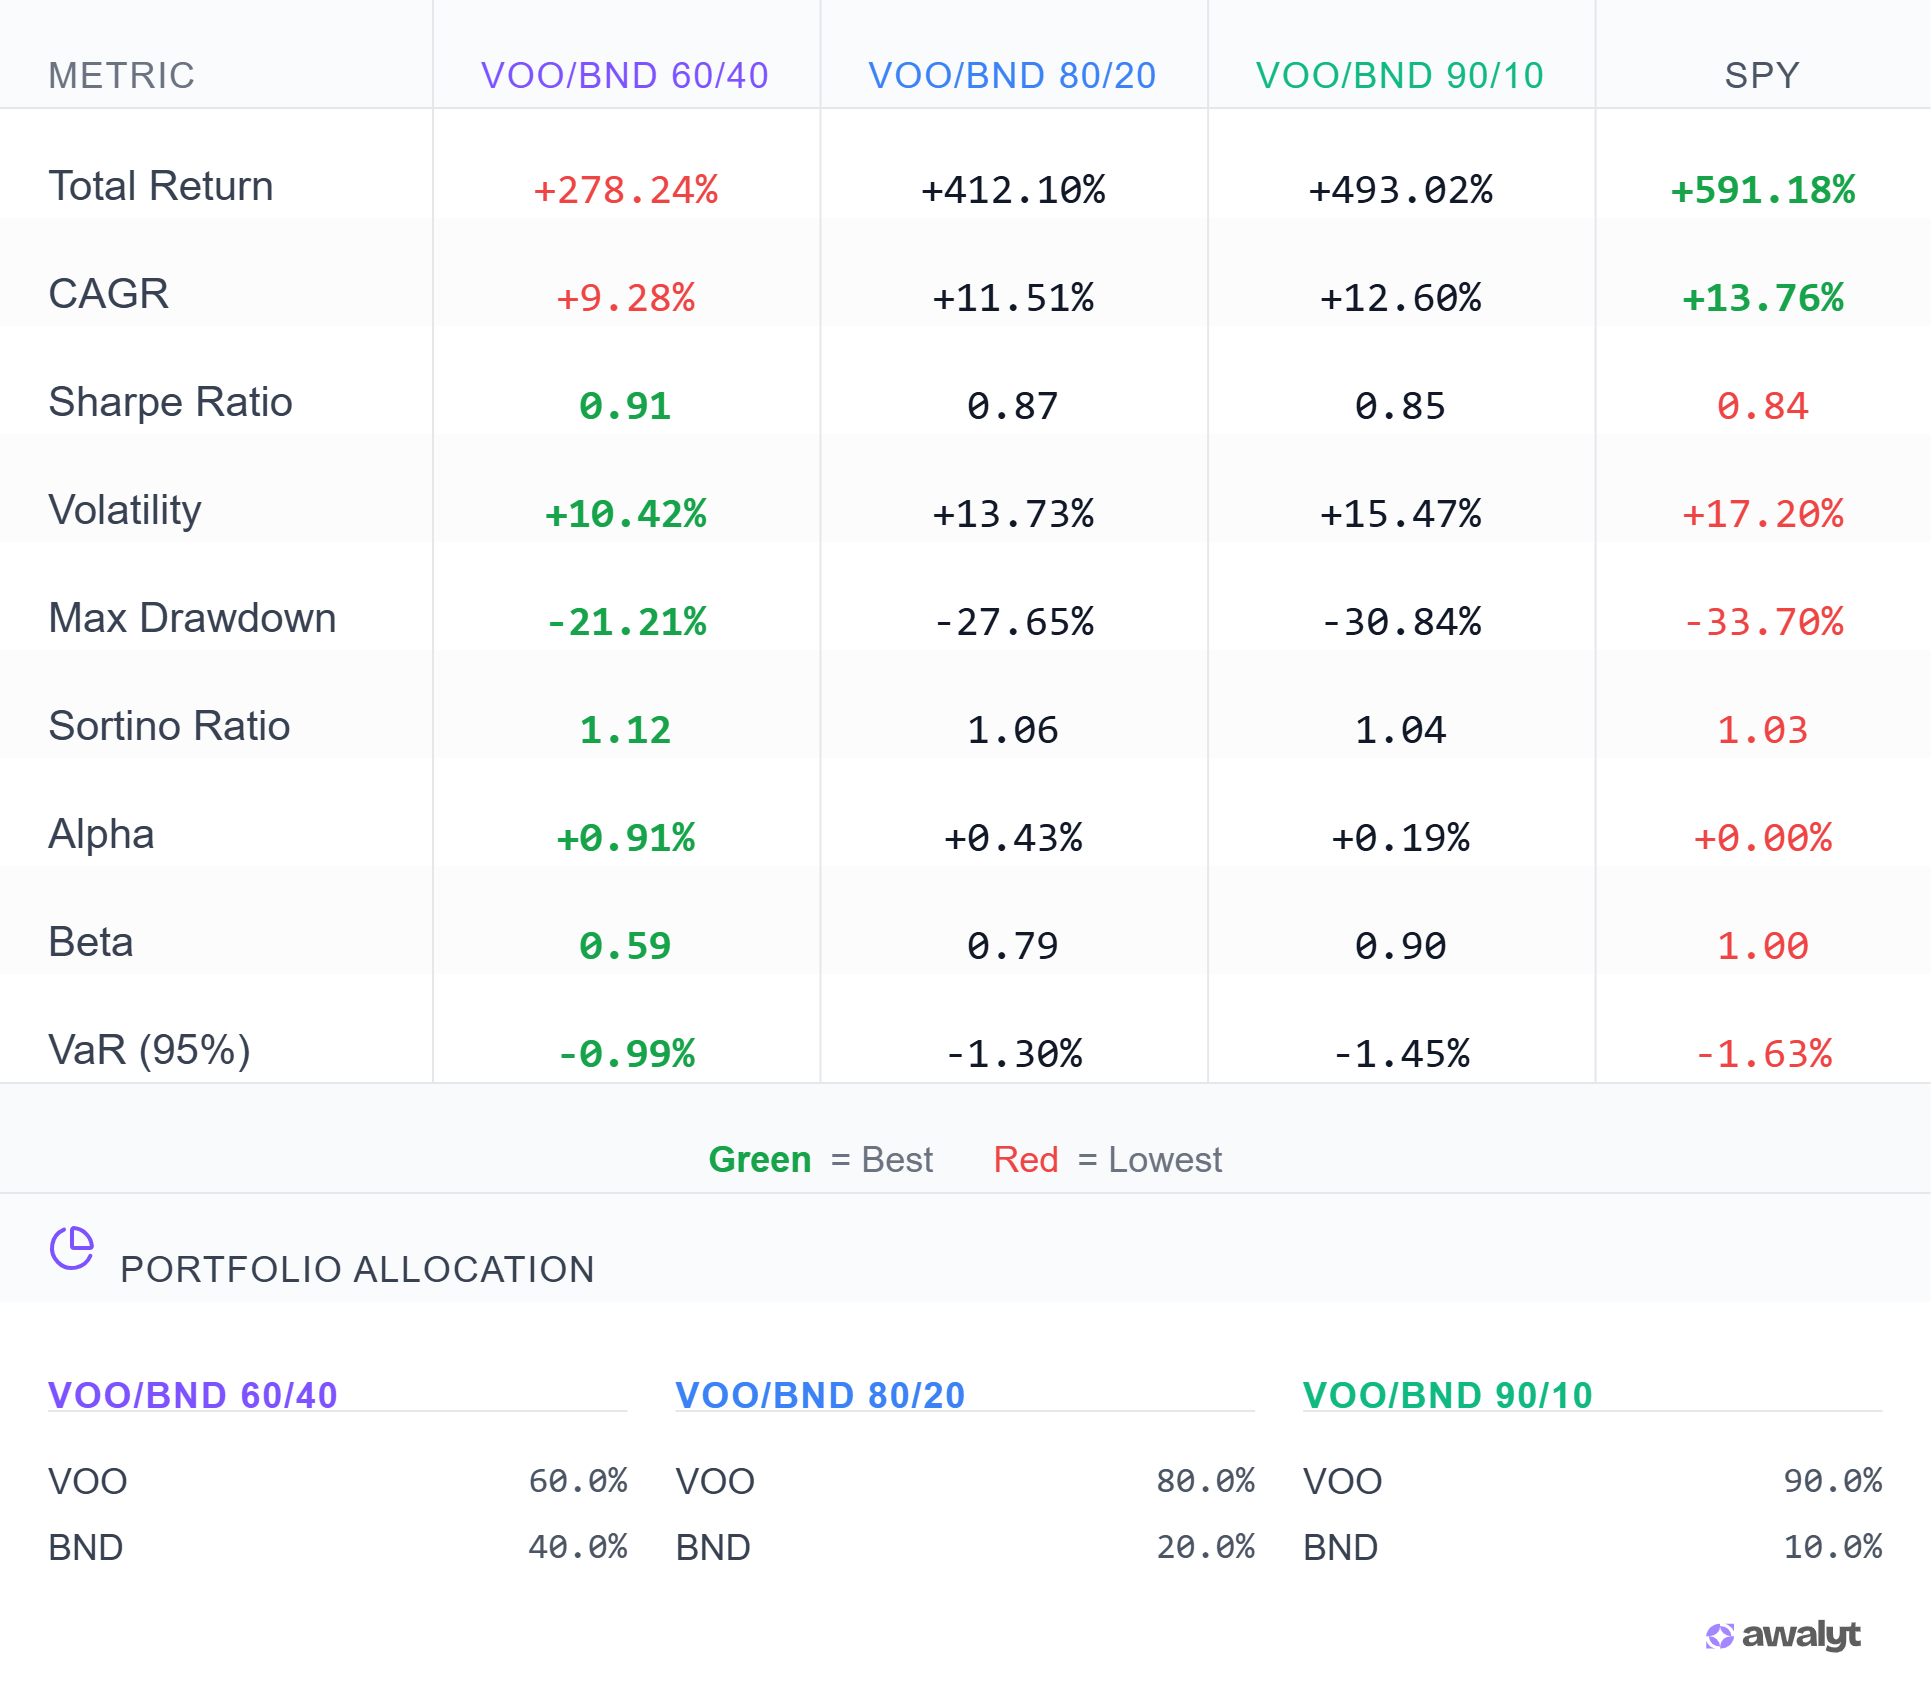
Here's the raw performance data for all four portfolios over the 15-year period:
| Portfolio | Total Return | CAGR | Volatility | Max Drawdown | Sharpe | Sortino | Alpha |
|---|---|---|---|---|---|---|---|
| 60/40 | +278.24% | 9.28% | 10.42% | -21.21% | 0.91 | 1.12 | +0.91% |
| 80/20 | +412.10% | 11.51% | 13.73% | -27.65% | 0.87 | 1.06 | +0.43% |
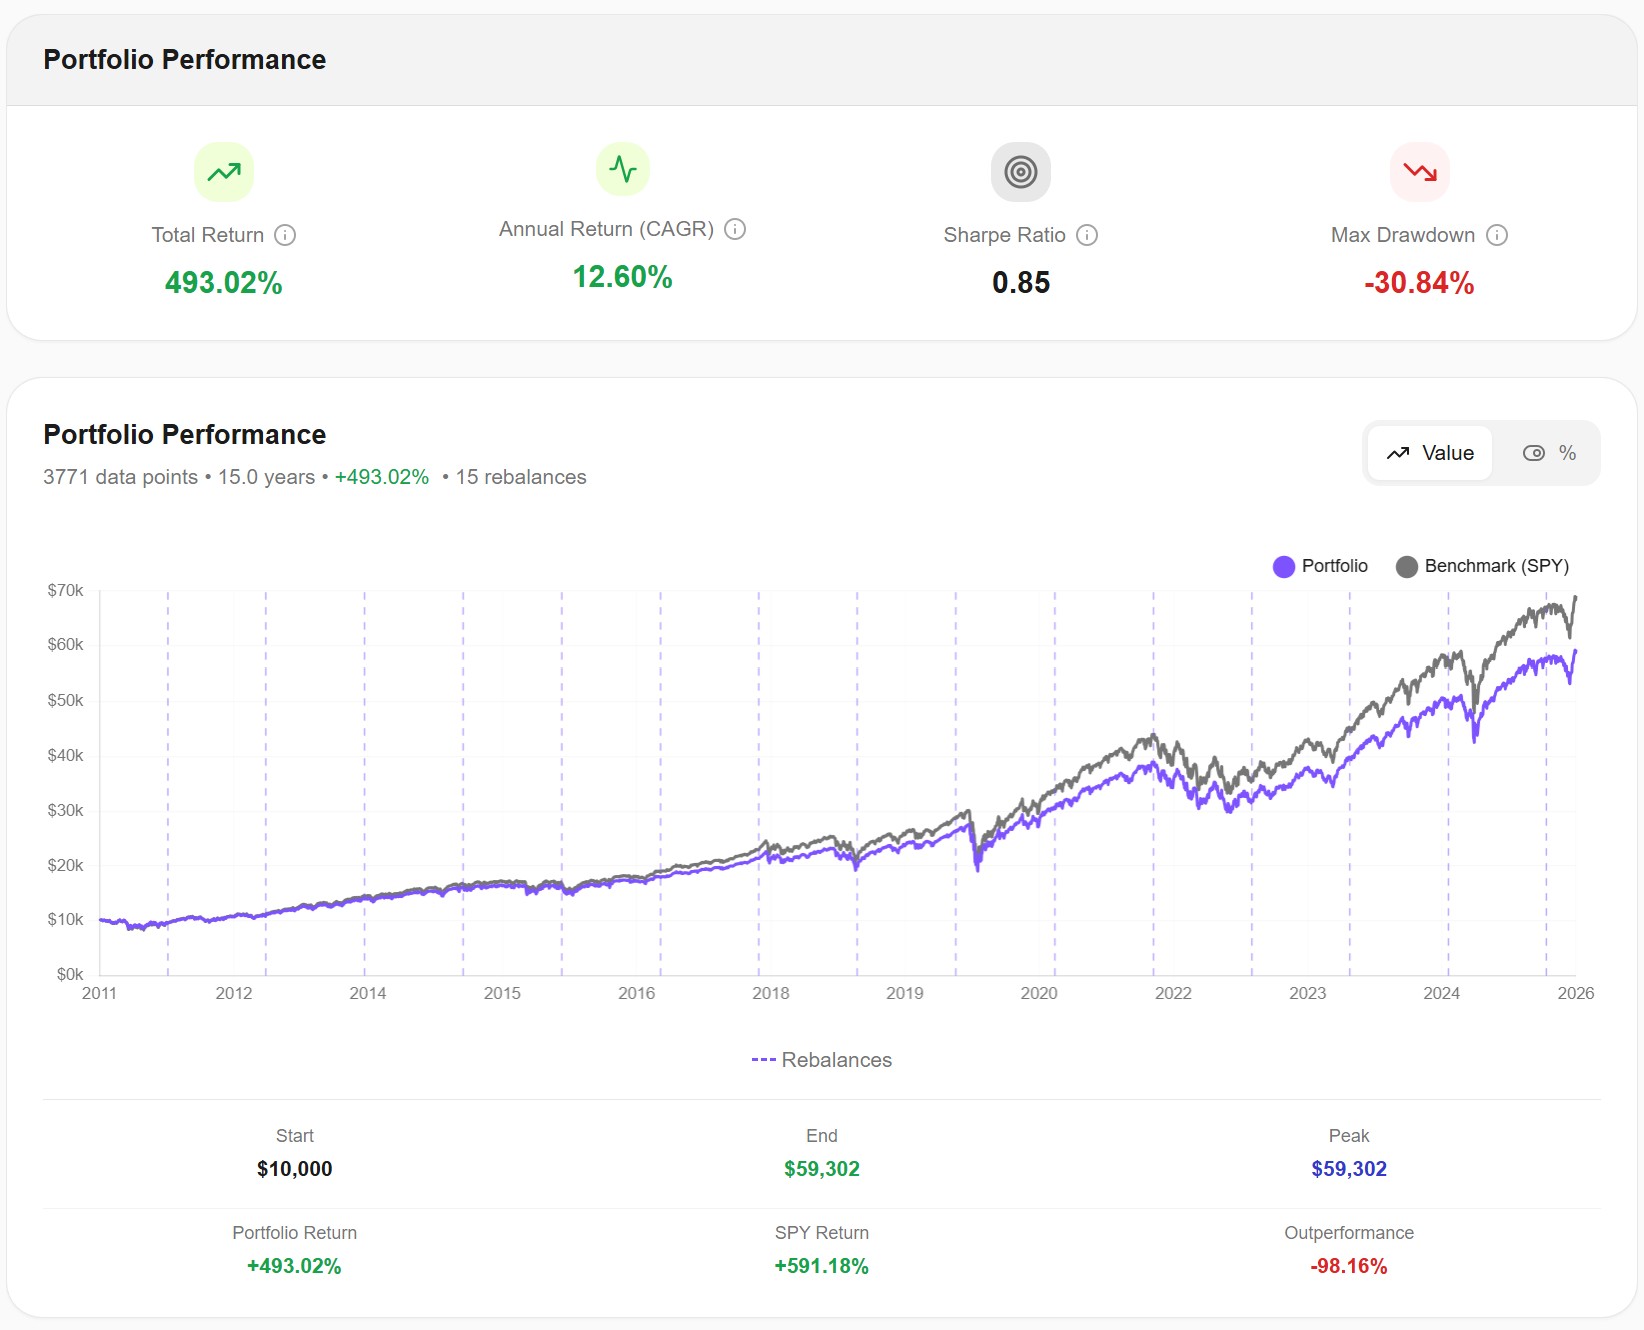
| 90/10 | +493.02% | 12.60% | 15.47% | -30.84% | 0.85 | 1.04 | +0.19% |
| SPY (100%) | +591.18% | 13.76% | 17.20% | -33.70% | 0.84 | 1.03 | 0.00% |
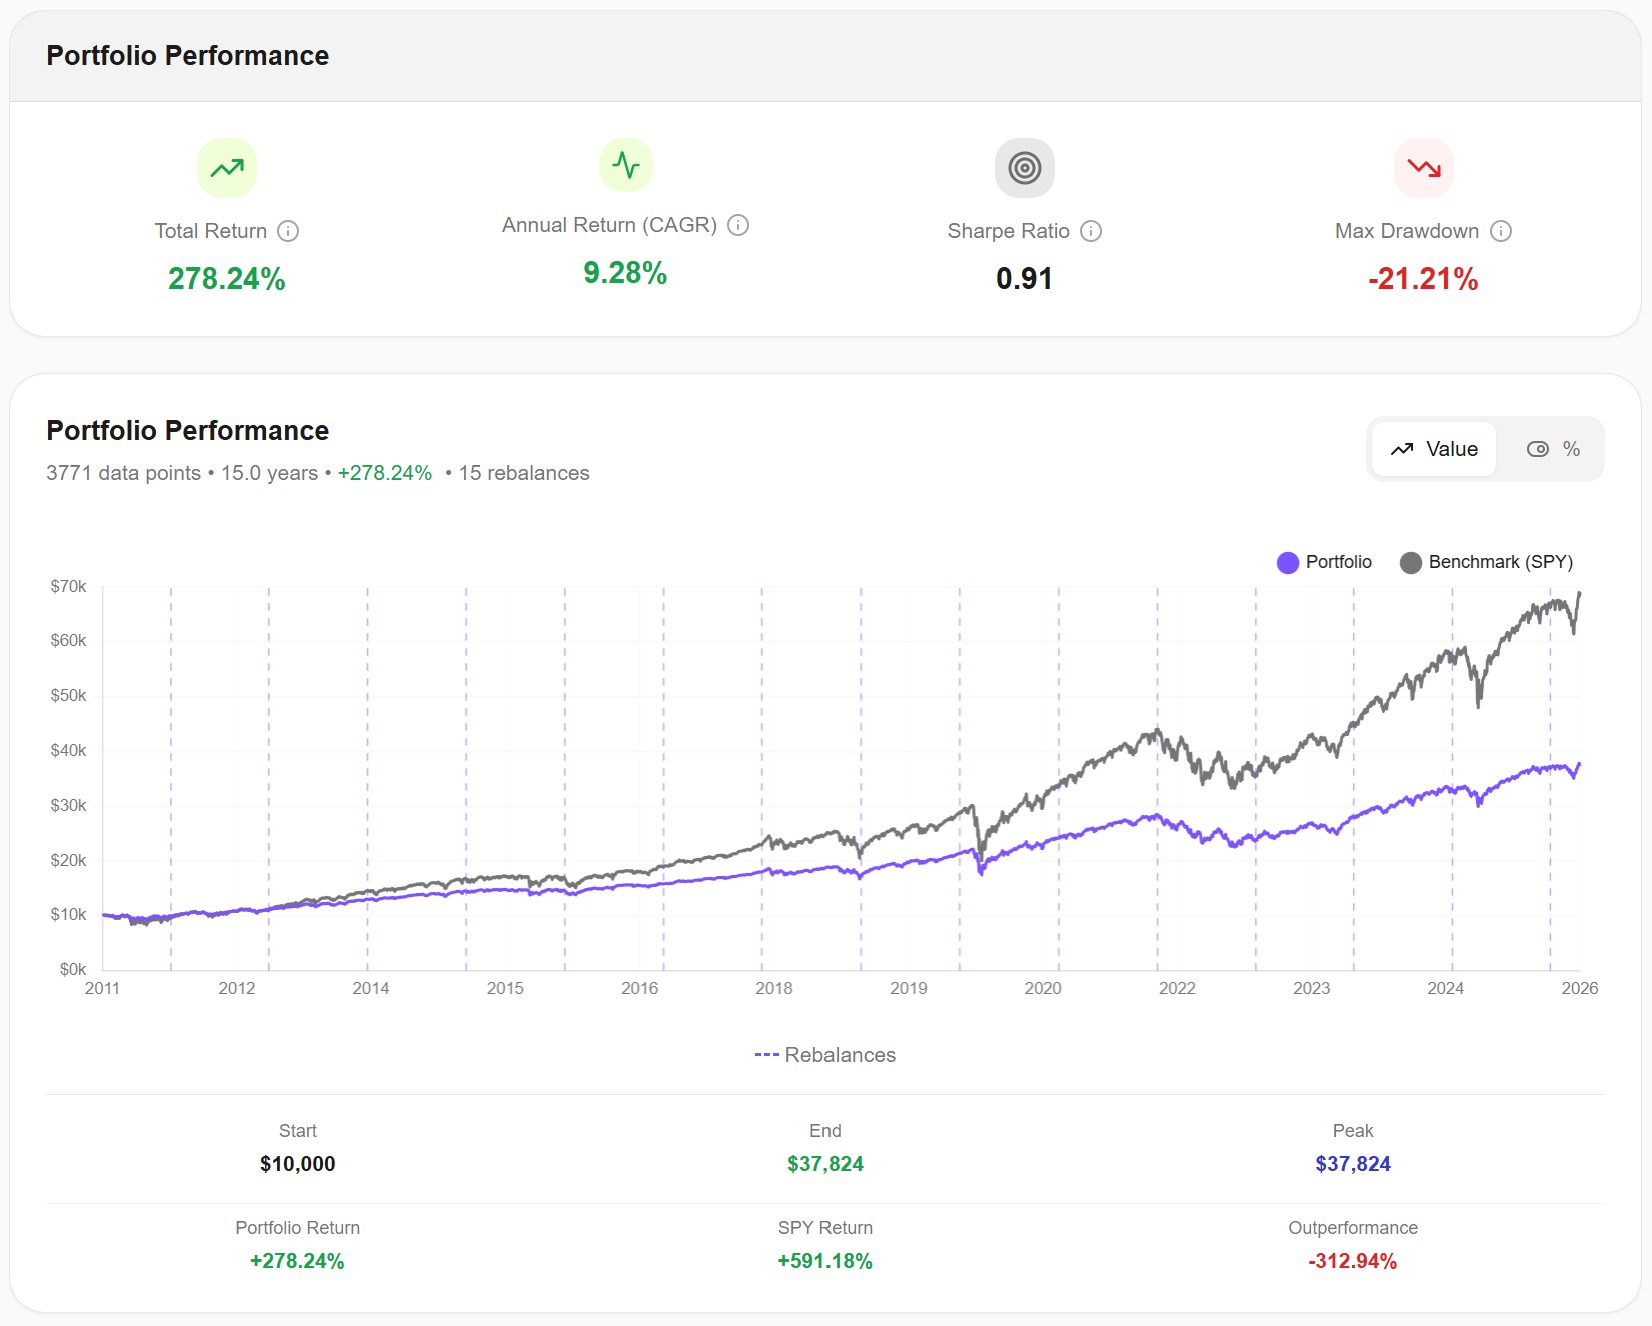
In dollar terms, $10,000 invested in April 2011 would have grown to:
- $37,824 with a 60/40 split
- $51,210 with an 80/20 split
- $59,302 with a 90/10 split
- $69,118 with 100% SPY
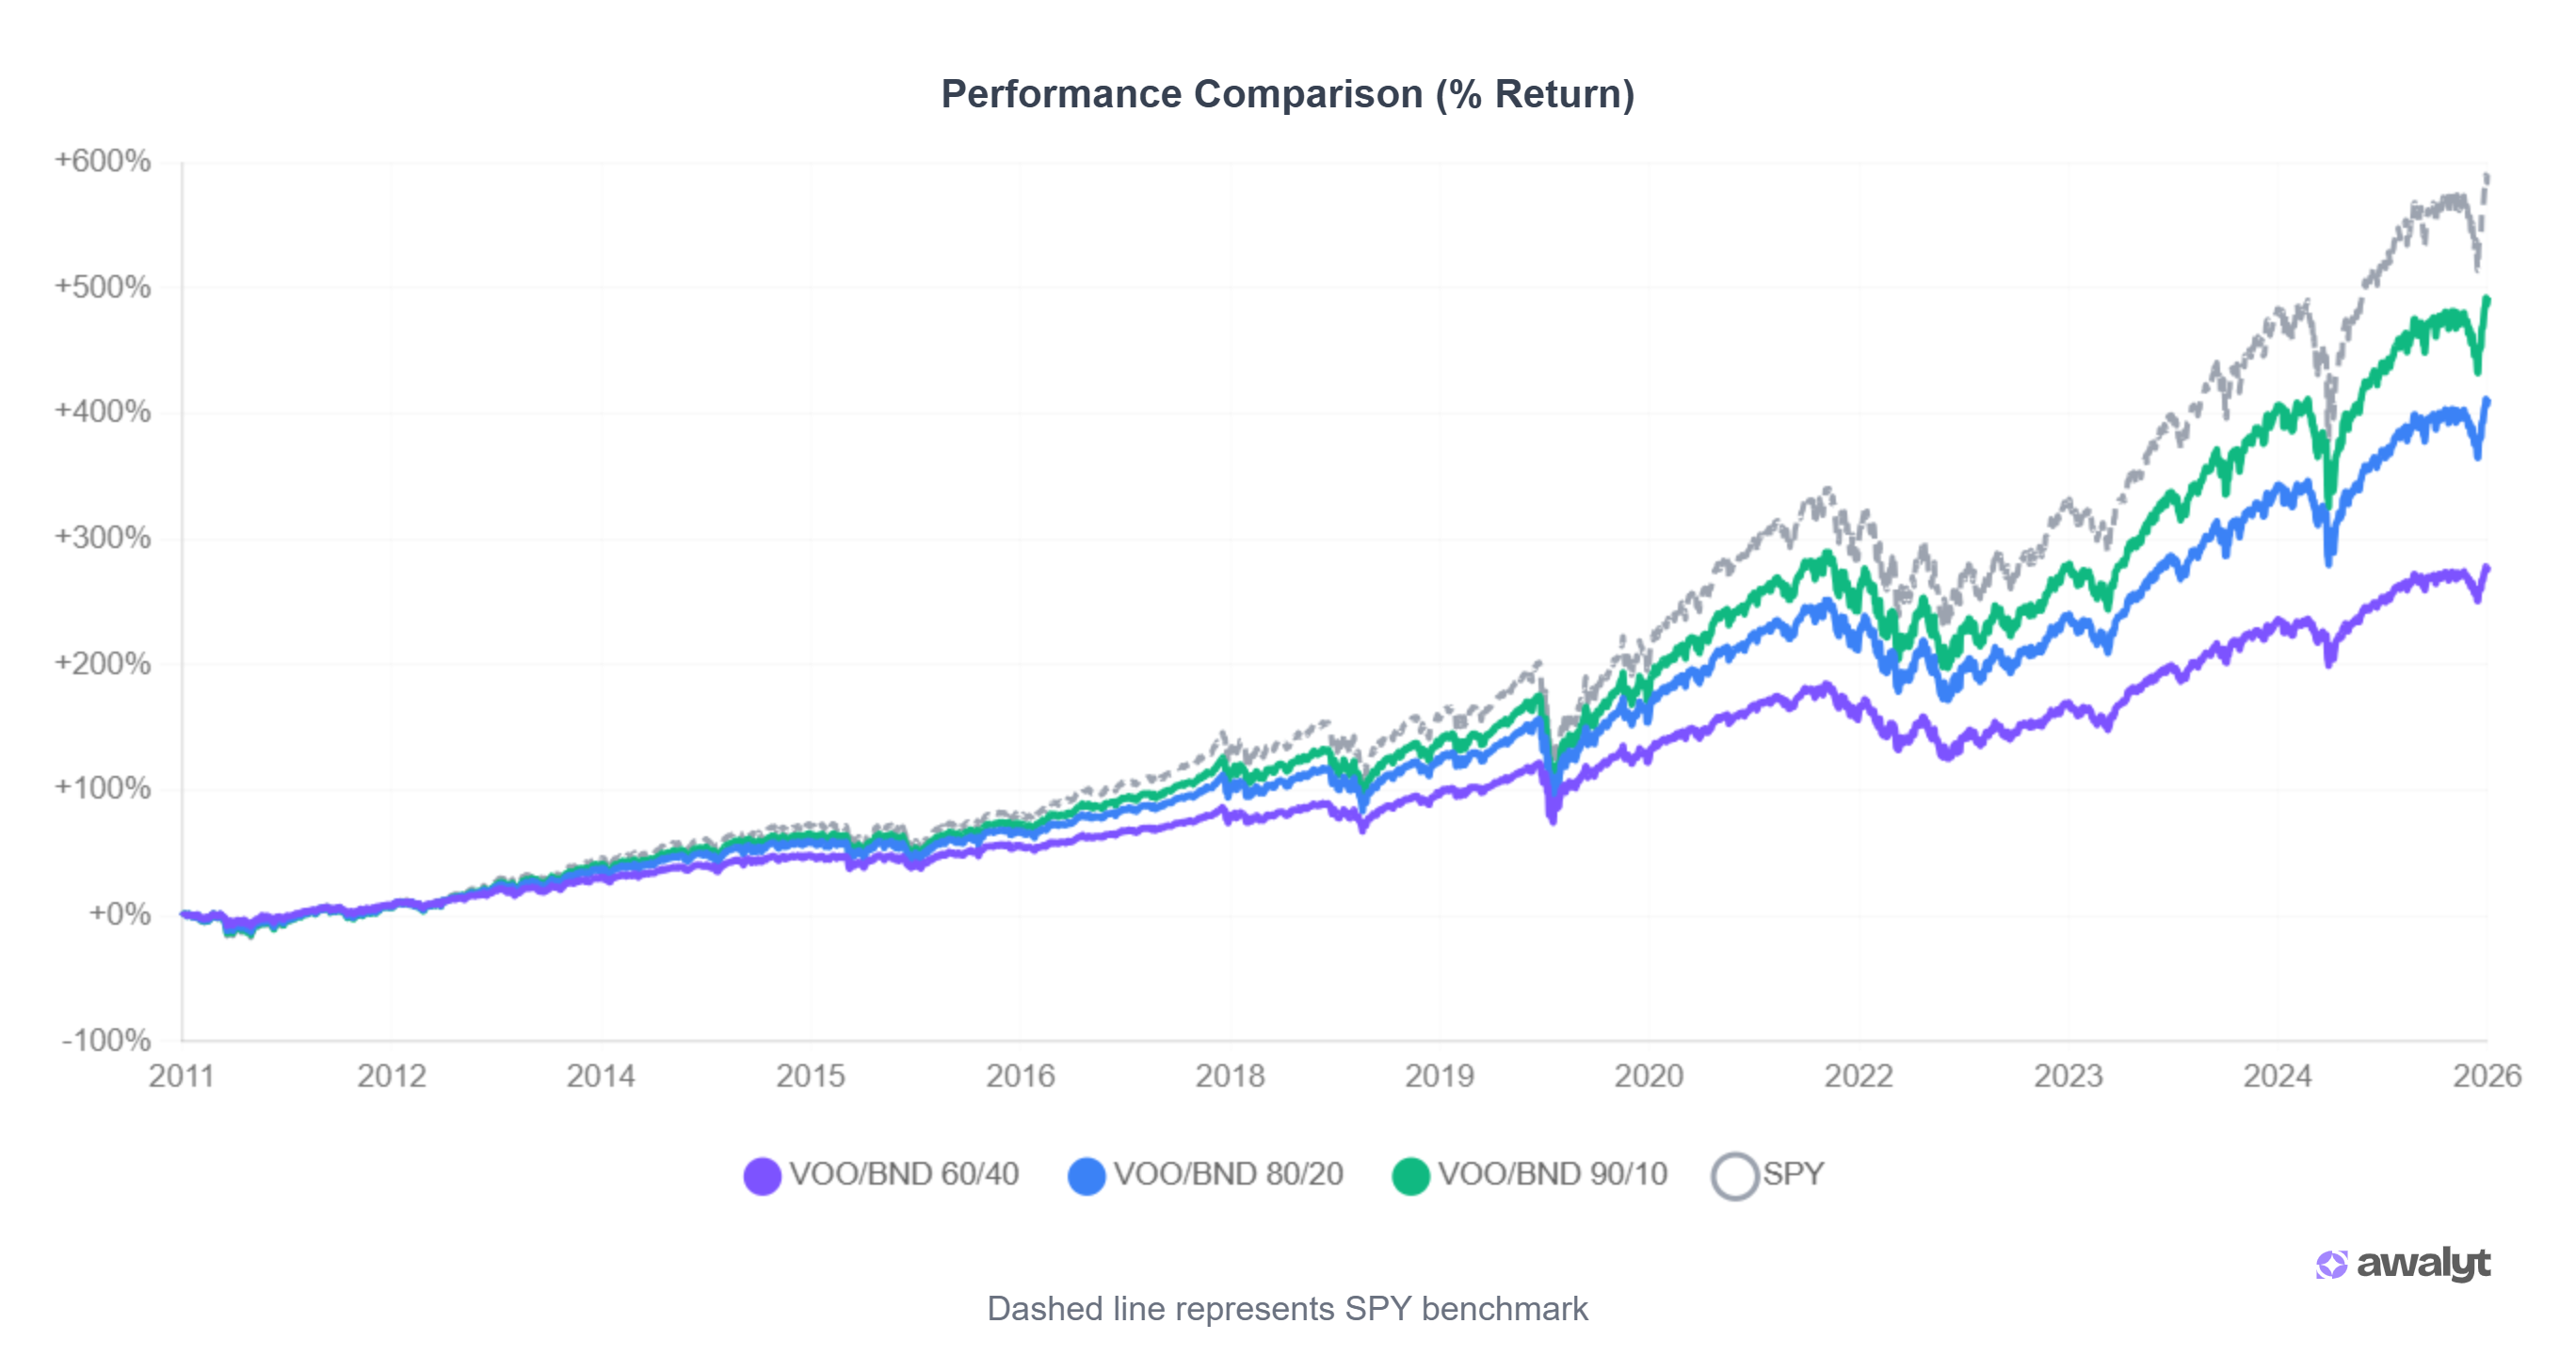
At first glance, SPY wins by a comfortable margin. The 90/10 portfolio trails it by roughly $10,000. The 60/40 trails by more than $31,000. The classic "bonds hurt your returns" narrative seems confirmed.
The first glance misses where the real story lives.
Risk-Adjusted: The Part Most Articles Skip
Total return tells you what happened. Sharpe ratio, volatility, and drawdown tell you how you got there, and whether you would have stayed invested long enough to collect those returns.
Look at the ranking by Sharpe ratio:
- 60/40: 0.91
- 80/20: 0.87
- 90/10: 0.85
- SPY: 0.84
The ranking inverts completely. The most bond-heavy portfolio delivered the best risk-adjusted return of anything we tested. SPY, the total return champion, finished last on a per-unit-of-risk basis.
Same pattern on Sortino ratio, which isolates downside volatility: 60/40 at 1.12 vs SPY at 1.03.
Alpha vs SPY tells the same story from another angle. The 60/40 generated +0.91% annualized alpha over 15 years. The 90/10 generated only +0.19%. In practical terms: after adjusting for how much of each portfolio's return came from pure market exposure, the bond-heavy version added nearly a full percentage point of annual risk-adjusted value. The bond-light version added almost nothing.
The "bonds are dead" argument always compares absolute returns. It almost never compares what you got per unit of risk you took. The data here says that risk-adjusted, bonds paid off — even over a period when US equities crushed every other asset class on the planet.
One more number worth pausing on. Max drawdown went from -33.70% (SPY) to -21.21% (60/40). That's a 12.5 percentage point gap. For an investor with $500,000 in the account, it's the difference between watching it fall to $394,000 or to $332,000. Same eventual recovery either way. But one experience is survivable for most people. The other is the kind of drawdown that triggers panic selling, which is the worst sin in investing.
This is a different result from what we found in our VTI/VXUS allocation backtest, where shifting between 60/40 and 80/20 US/International barely moved the risk needle. All three allocations in that test had drawdowns within 0.3% of each other. Stocks vs bonds is a fundamentally different allocation decision than stocks vs international stocks. Here, the allocation genuinely reshapes the risk-return profile.
2020 vs 2022: When Bonds Worked, and When They Didn't
Annual data surfaces a detail that the 15-year average hides. To understand when bonds actually protect you, compare two years side by side: 2020 and 2022.
2020 — the COVID crash:
- 60/40 max drawdown: -21.21%
- 90/10 max drawdown: -30.84%
- Difference: 9.6 percentage points
The 60/40 investor felt the shock, but bonds cushioned it hard. This is bonds doing exactly what the textbook says they should do. When equities sold off in a deflationary panic, Treasuries rallied as capital fled to safety. The VOO/BND correlation stayed solidly negative through most of the year.
2022 — the year the Fed hiked rates aggressively:
- 60/40 max drawdown: -20.69%
- 90/10 max drawdown: -23.54%
- Difference: 2.9 percentage points
Almost the same drawdown on both portfolios. Bonds barely helped.
The reason shows up in the correlation data. Through most of the 2010s, and through 2021, the correlation between VOO and BND hovered between -0.18 and -0.25. Mildly negative, which is the normal regime. In early 2022, as rate hikes accelerated, the correlation briefly deepened to -0.42, and bonds were still doing their job. Then in Q3 2022, something broke.
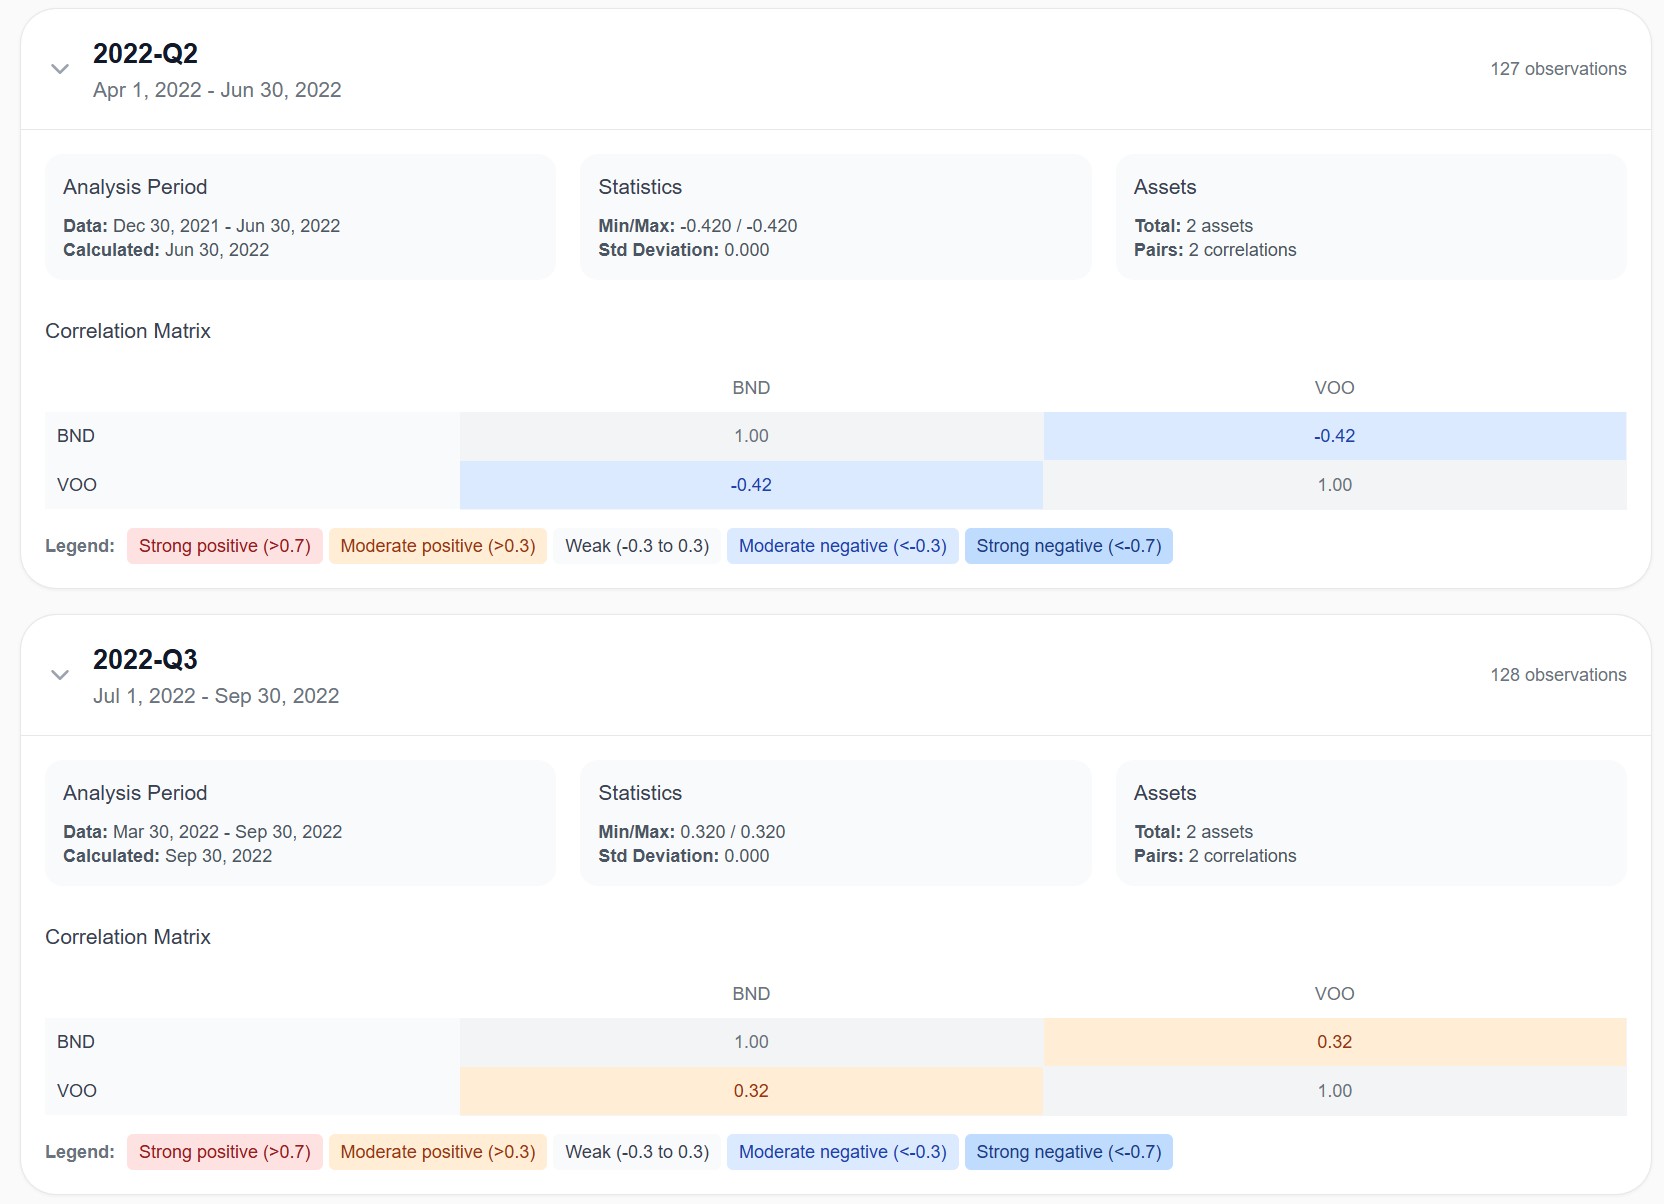
+0.32. Positive. Bonds and stocks started moving together. The entire mechanism that makes 60/40 work (bonds zigging when stocks zag) switched off for a stretch.
This happens because rising interest rates hit bond prices and stock valuations simultaneously. Higher discount rates compress everything. In 2022, the 10-year Treasury yield moved from 1.5% to 4.2% in twelve months. Bond prices collapsed. Equities repriced. Nothing diversified.
Correlations normalized in 2023. The -0.18 to -0.25 range that held for a decade came back. The 60/40 strategy isn't broken. This was a structural event tied to a specific macro regime, not a permanent shift. But it's a reminder worth keeping: bonds protect against most crashes. Not all of them.
We covered the correlation mechanics in more depth in our Bogleheads 3-Fund portfolio backtest if you want to dig deeper into how 2022 broke the diversification assumption across multiple asset classes.
So Which Allocation Should You Choose?
With two ETFs, there isn't much to optimize. VOO and BND are already diversified on their own. The choice between 60/40 and 90/10 isn't strategic — it's personal.
Ask yourself three things.
What kind of investor are you? The type who sets up a monthly automatic contribution and doesn't look at the account for six months? Or someone who wants more engagement, more risk, more chance of outperforming? There's no right answer, but the honest one changes everything else.
What's your time horizon? Only you know this. Maybe you're retiring in 15 years and want stable growth without big surprises along the way. Or you're 25, you've got four decades ahead, and a -30% drop is just noise because you won't touch that money until 2055.
How much risk can you actually handle? Not the one you ticked on a broker questionnaire. The one you showed when the portfolio dropped 20% in three weeks in March 2020, or when bonds and stocks fell together in 2022. If you sold, you know. If you never had the chance to find out, assume less risk tolerance than you think you have.
Once you answer these honestly, the ratio picks itself. And if two ETFs still feel too narrow, that's a signal you need a different portfolio — not a different split.
The Bottom Line
Fifteen years of daily data say something simple: adding bonds to VOO costs you return, but buys you a calmer ride. The 60/40 turned $10,000 into $37,824 with a -21% drawdown. Pure SPY turned it into $69,118 — with -33%.
Both are fine outcomes. The one that's right for you depends on whether you'd actually hold through the bad version.
And if you've been reading this thinking "I want something smarter than just stocks and bonds" — good. That's usually where real portfolio construction starts. Two ETFs are a beginning. Not the whole picture.
If you want to test your own split — 70/30, 50/50, or a mix that swaps BND for TLT or TIP — you can run it on the backtesting tool.
Want to test these insights on your own portfolios?
Awalyt is a portfolio analysis platform: backtesting on daily data, fundamental analysis, asset analysis, and AI-powered insights.
Get Started Free