How Often Should You Rebalance Your Portfolio? A 14-Year Backtest of 4 Strategies [2026]
Every DIY investor eventually asks the same question: how often should I actually rebalance my portfolio? Once a month? Once a quarter? Once a year? The advice you'll find online is all over the place — some blogs say quarterly is optimal, others swear by annual, a few suggest rebalancing whenever you "feel like it's drifted too far."
The problem with most of that advice is simple: it's based on opinion, not data. So we did something different. We took a realistic, diversified portfolio and backtested it over 14 years with daily data using four different rebalancing frequencies. Same portfolio, same period, same benchmark — only the rebalancing frequency changed.
The results are clear, a little controversial, and largely aligned with what academic research has been saying for years. Let's get into it.
Disclaimer: This article is for educational and informational purposes only. It does not constitute investment advice. Past performance does not guarantee future results. Always do your own research before making any investment decisions.
Quick Refresher: What Is Portfolio Rebalancing?
Before jumping into the numbers, a quick grounding for readers who are newer to the concept.
Portfolio rebalancing is the process of bringing your portfolio back to its target allocation. If you started with 60% stocks and 40% bonds, and after a strong year for stocks you're now at 68/32, rebalancing means selling some stocks and buying some bonds until you're back to 60/40.
The reason people rebalance isn't to chase extra returns — it's to control risk. Without rebalancing, a portfolio drifts over time toward whatever asset class performs best, which usually means it becomes more aggressive than you originally intended. A 60/40 that drifts to 80/20 over a decade is quietly taking on a lot more risk than its owner signed up for.
The question this article answers is: once you've decided to rebalance, how often should you actually do it?
The Experiment: 4 Backtests, One Portfolio, 14 Years
We used the Core 5-asset portfolio — the same diversified allocation featured in our Core + Satellite strategy guide — because it's representative of what a typical DIY investor or independent advisor would actually build.
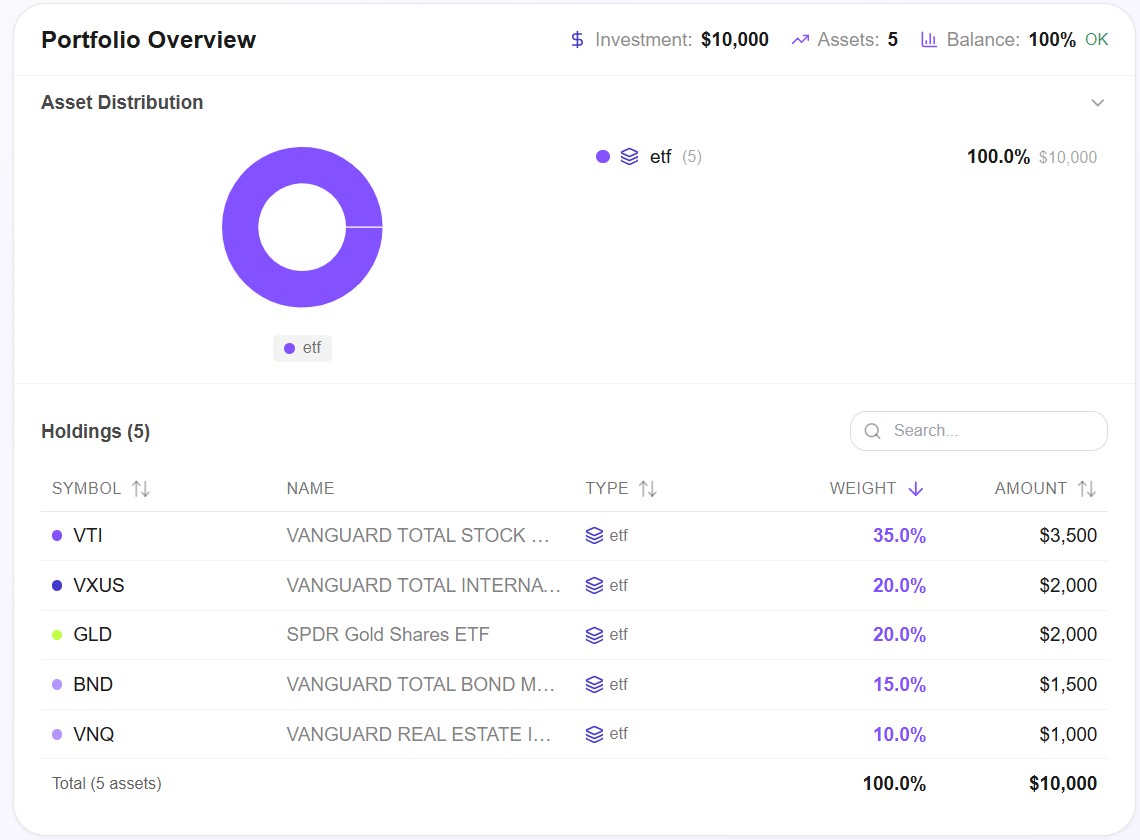
The allocation: VTI 35% · VXUS 20% · GLD 20% · BND 15% · VNQ 10% — US stocks, international stocks, gold, bonds, and real estate. This mix has enough asset-class diversity to make rebalancing meaningful: each component drifts differently depending on market conditions, which is exactly what rebalancing is designed to correct.
We ran four separate backtests with identical parameters except for the rebalancing frequency:
- Backtest 1: Monthly rebalancing
- Backtest 2: Quarterly rebalancing
- Backtest 3: Semi-annual rebalancing
- Backtest 4: Annual rebalancing
All four tests used:
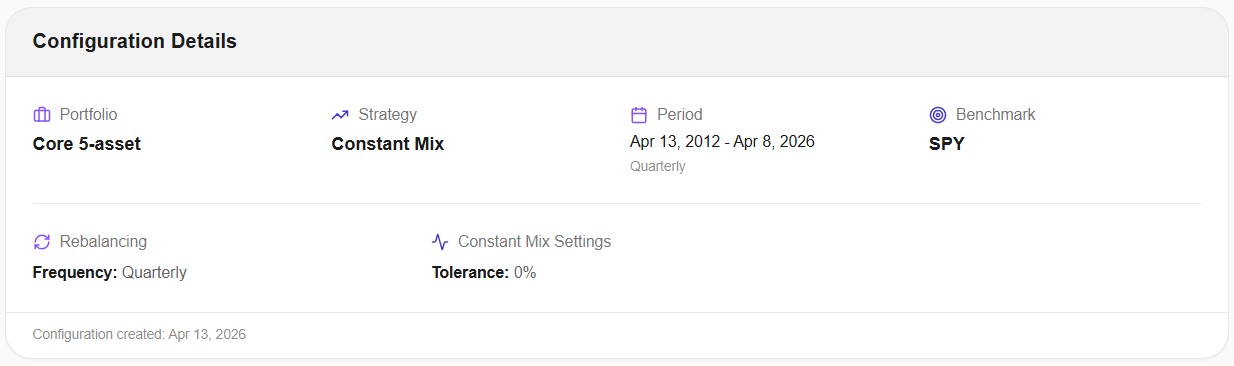
- Period: April 2012 to April 2026 (14 years)
- Initial investment: $10,000
- Benchmark: SPY
- Data: daily prices (3,516 data points per backtest)
- Strategy: constant mix (always rebalance back to the original target weights)
- Taxes: not modeled — we'll come back to this important caveat later
Now the results.
The Results: Side-by-Side Comparison
Here's the metrics comparison across all four rebalancing frequencies:
Let me translate the key findings into plain English:
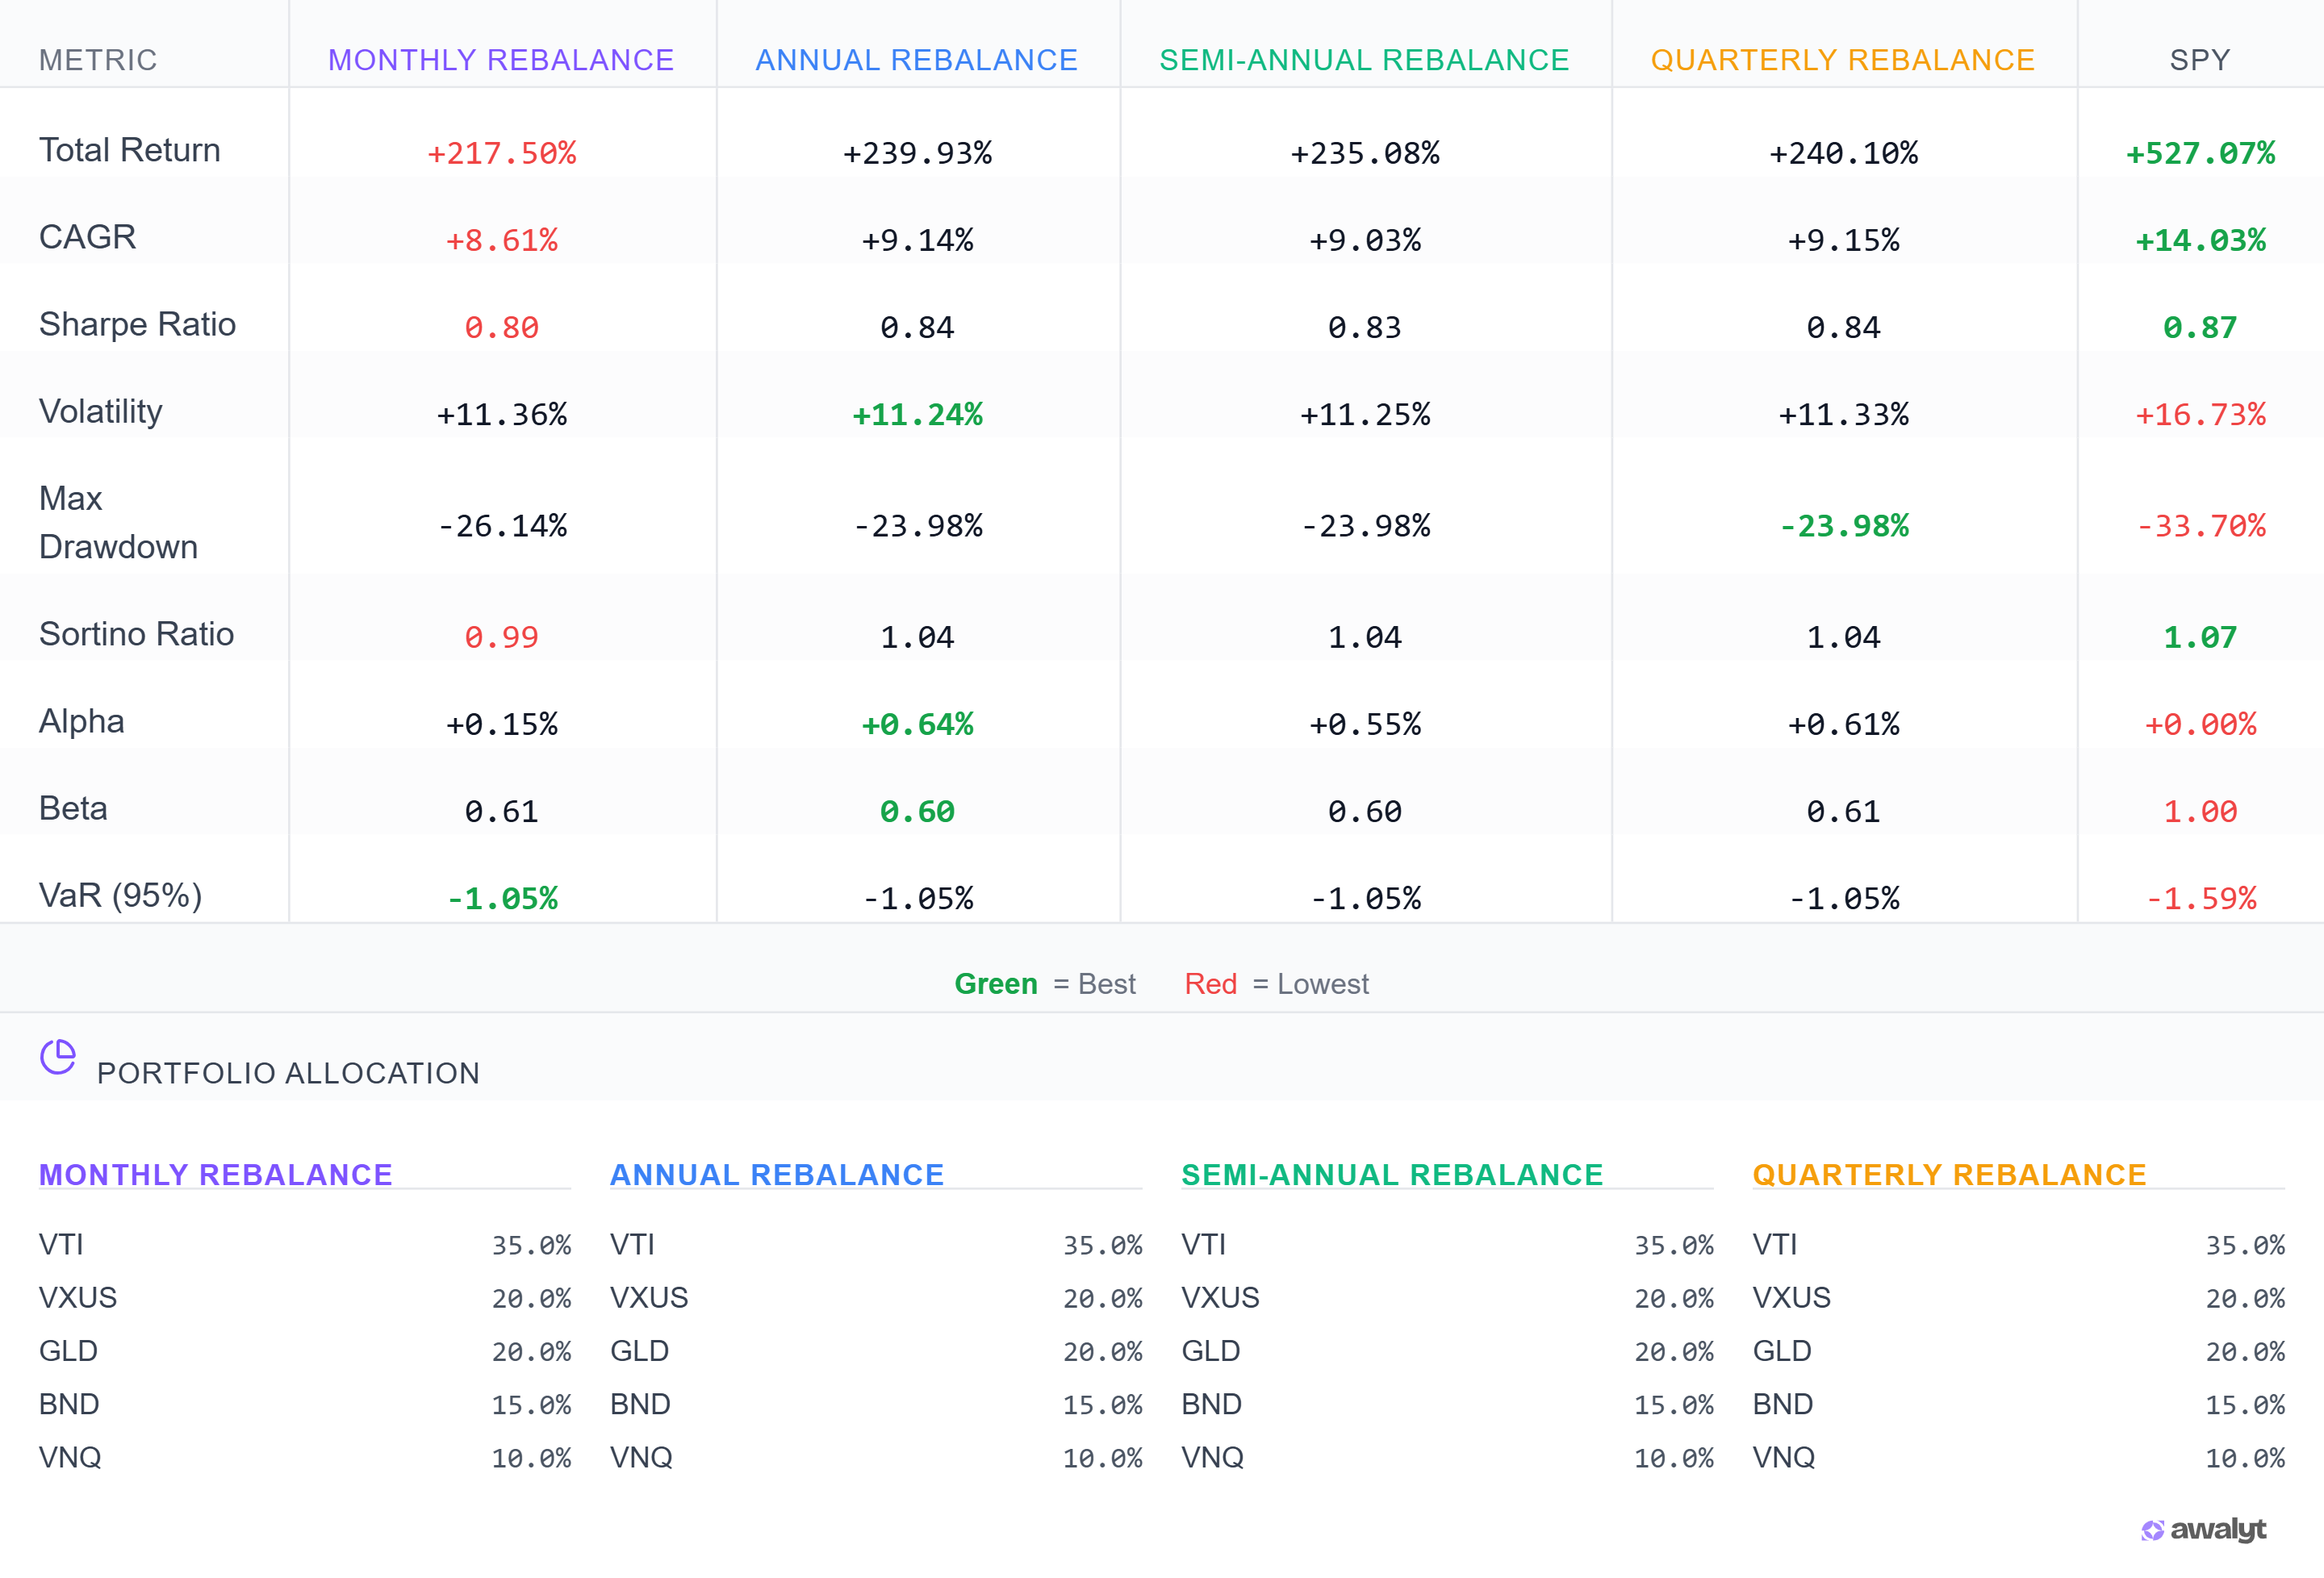
| Metric | Monthly | Quarterly | Semi-annual | Annual |
|---|---|---|---|---|
| Total Return | +217.50% | +240.10% | +235.08% | +239.93% |
| CAGR | 8.61% | 9.15% | 9.03% | 9.14% |
| Sharpe Ratio | 0.80 | 0.84 | 0.83 | 0.84 |
| Max Drawdown | -26.14% | -23.98% | -23.98% | -23.98% |
| Volatility | 11.36% | 11.33% | 11.25% | 11.24% |
| Number of rebalances | 168 | 56 | 28 | 14 |
| Final value ($10k start) | $31,750 | $34,010 | $33,508 | $33,993 |
Three things jump out immediately.
First, monthly rebalancing is the clear loser on every metric that matters. It has the lowest CAGR (8.61% vs 9.15% for quarterly), the deepest drawdown (-26.14% vs -23.98%), and the lowest Sharpe ratio (0.80 vs 0.84). Over 14 years starting from $10,000, monthly rebalancing ended with $2,260 less than quarterly. That's a 7% shortfall on the final value — not catastrophic, but entirely avoidable.
Second, quarterly, semi-annual, and annual are essentially indistinguishable. The differences between these three are in the range of 0.1% CAGR — statistical noise, not real signal. Whether you rebalance every 3, 6, or 12 months in this portfolio, you ended up at roughly the same place.
Third, the pattern runs opposite to common intuition. Most investors assume that rebalancing more frequently keeps the portfolio closer to target and therefore must be better. The data says the opposite: more frequent rebalancing produced worse risk-adjusted outcomes, not better ones.
Why Does Monthly Rebalancing Lose?
This is the part that surprises most people, so it's worth understanding the mechanism rather than just stating the result.
The phenomenon at work is called rebalancing drag. When you rebalance very frequently, you're systematically cutting winners and adding to losers at shorter intervals — and short-term price movements tend to have momentum. An asset that's up this month is statistically more likely to continue up next month than to mean-revert. By trimming winners every 30 days, monthly rebalancing repeatedly fights against that short-term momentum.
Longer rebalancing windows let winners run for longer before trimming them, which tends to capture more of the short-term momentum before reverting to the target allocation. Over 14 years and 168 rebalances, that friction compounds into a visible performance gap.
You can see the effect visually. Here's the monthly rebalancing backtest — notice the 168 rebalances marker, which creates that distinctive dense vertical striping across the chart:
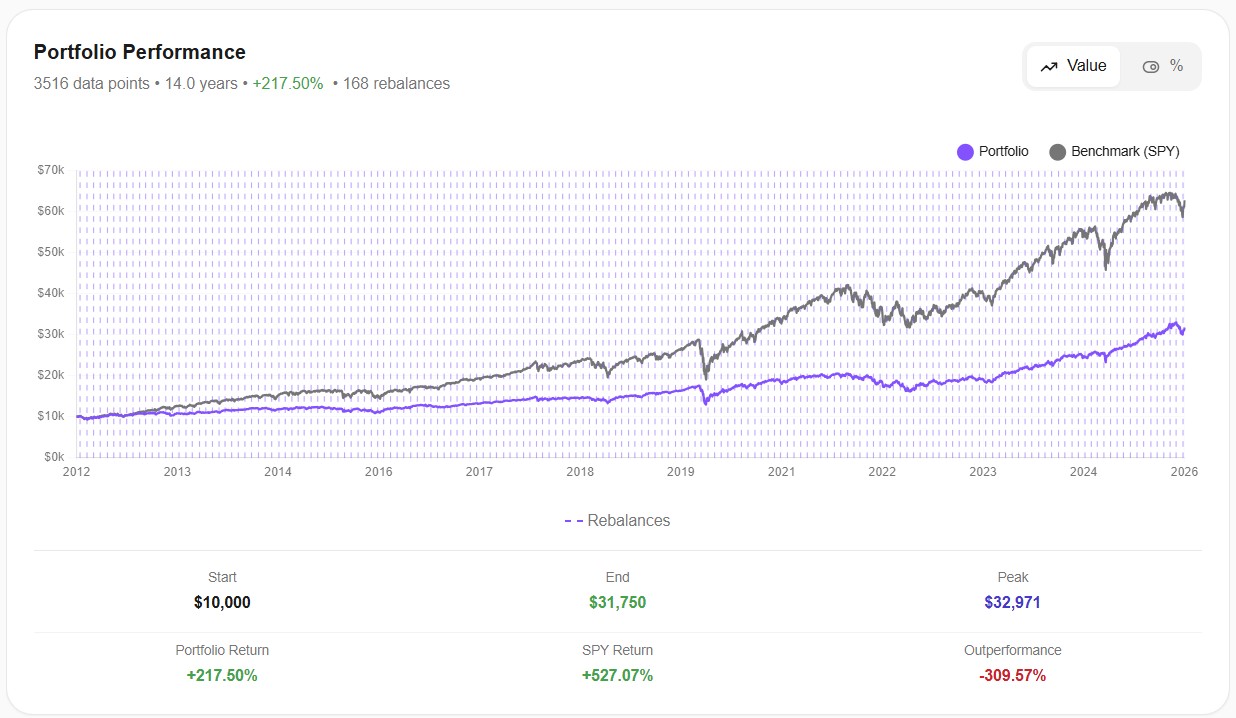
Final value: $31,750.
And here's the quarterly backtest — same portfolio, same period, just 56 rebalances instead of 168:
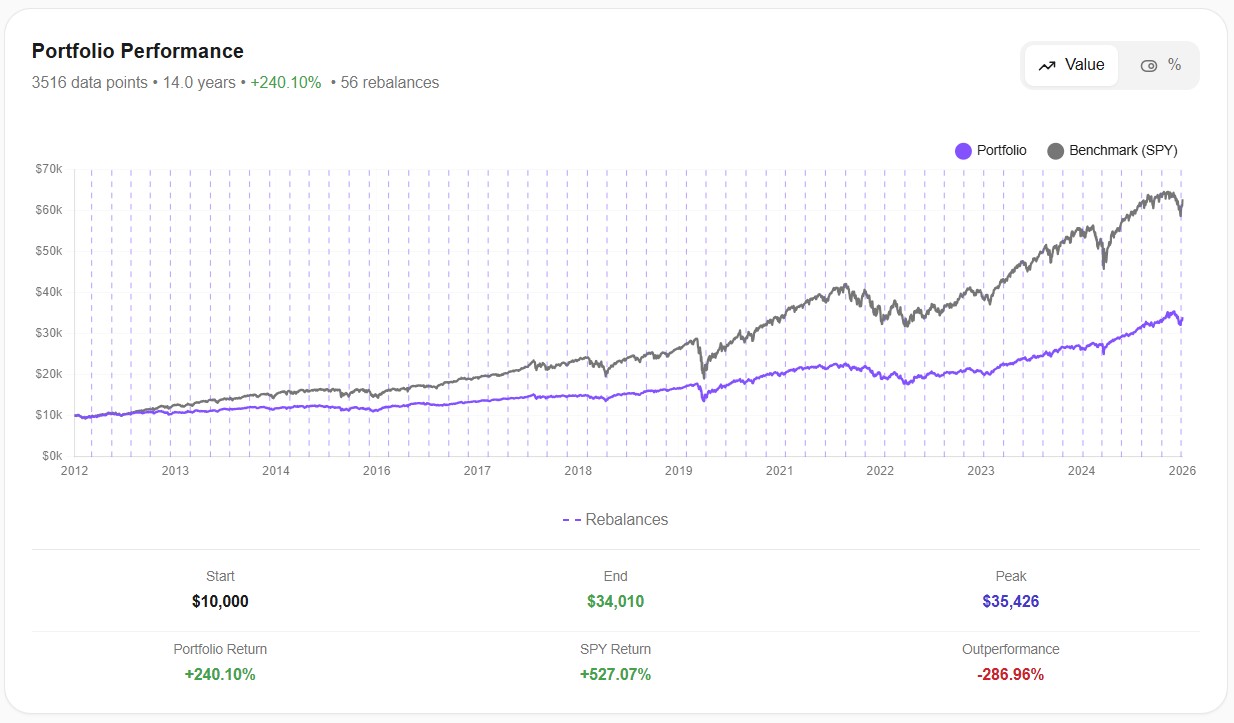
Final value: $34,010. Same strategy, but $2,260 more in your pocket, simply by rebalancing three times less often.
This isn't a niche finding — it's well documented in the academic literature. Vanguard's own research on rebalancing has consistently found that monthly rebalancing tends to underperform quarterly and annual rebalancing on a risk-adjusted basis, particularly once transaction costs and tax friction are considered. Longer rebalancing intervals allow the portfolio to benefit from momentum persistence without meaningfully increasing risk.
What the rebalancing log actually looks like
One of the most useful things about backtesting with full transparency is being able to see every single transaction at every rebalance event. Here's a snippet from the quarterly rebalancing history:
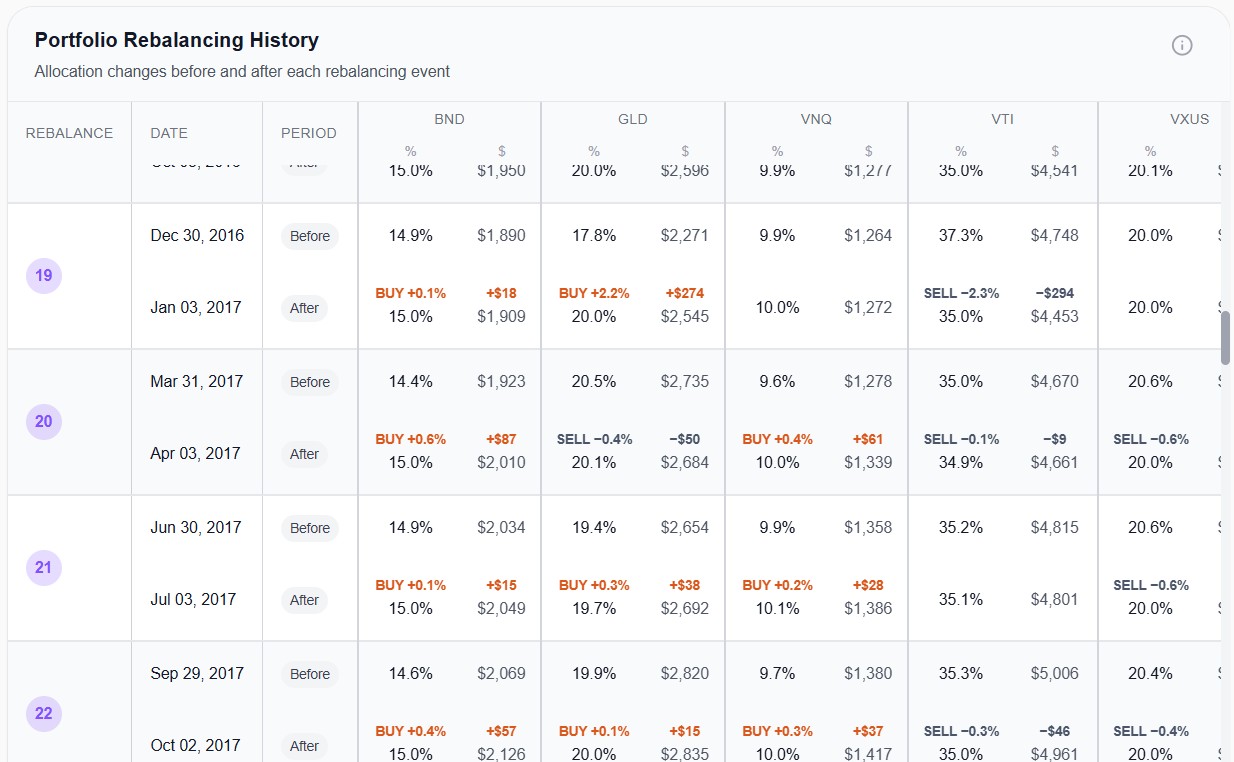
Notice how most rebalances are tiny adjustments — a few tenths of a percent here, a dollar there. These aren't dramatic corrections; they're constant small movements to hold the portfolio at target. Now imagine doing that 168 times instead of 56. Each of those micro-transactions is a small bet against short-term momentum, and in a taxable account each one would also be a potential tax event.
Quarterly vs. Semi-annual vs. Annual: Does It Actually Matter?
Once you move past monthly, the numbers get remarkably flat:
- Quarterly: 9.15% CAGR, -23.98% max drawdown
- Semi-annual: 9.03% CAGR, -23.98% max drawdown
- Annual: 9.14% CAGR, -23.98% max drawdown
For practical purposes, these three are tied. The differences are small enough to be explained by when each rebalance happened to land on the calendar rather than by any systematic advantage of one frequency over another.
This is actually a useful finding. It means that once you've decided not to rebalance monthly, the specific frequency you choose becomes a matter of operational convenience rather than performance optimization:
- Quarterly is easy to remember (every 3 months) and aligns with natural reporting cycles.
- Semi-annual is low effort and still catches meaningful drift.
- Annual is the lowest-effort option and, importantly, the most tax-efficient in a taxable account.
Pick the one that fits your workflow. The performance difference between them is noise, not signal.
Important Caveat: This Is One Portfolio, One Period
Everything above applies to this specific portfolio over this specific 14-year period. That's a genuine caveat and worth being explicit about.
A different portfolio — say, one with more volatile or more decorrelated assets, or one heavily weighted toward emerging markets and commodities — could show different numbers. A different period might favor different frequencies slightly. Portfolios with high internal correlation (e.g., 100% US equities split across VTI and QQQ) would show almost no rebalancing effect at all because the assets barely drift from each other.
What does generalize, and what's consistent with the broader academic literature, is the directional pattern:
- Monthly rebalancing tends to underperform less frequent rebalancing on a risk-adjusted basis.
- Quarterly, semi-annual, and annual rebalancing tend to produce similar outcomes.
- The benefits of rebalancing are primarily about risk control, not return enhancement.
So treat the specific numbers as illustrative, but trust the direction.
What Changes in a Taxable Account?
Our backtests above didn't model taxes. In a tax-advantaged account (IRA, 401k, Roth), that's fine — you don't pay capital gains on rebalancing transactions.
But in a taxable brokerage account, every rebalance that sells an appreciated asset is a taxable event. Suddenly the calculus changes significantly:
- Monthly rebalancing generates the most taxable events (168 over 14 years) → the highest tax drag.
- Annual rebalancing generates the fewest (14 over 14 years) → the lowest tax drag.
- The performance gap between monthly and annual widens once taxes are factored in.
This is a topic we'll explore in much more depth in a future article dedicated to tax-aware backtesting. For now, the practical takeaway is simple: if your portfolio sits in a taxable account, the case against frequent rebalancing becomes even stronger. Less-frequent rebalancing isn't just as good — it's actively better after taxes.
How to Decide: A Practical Framework
No prescriptions here, because the "right" answer depends on your situation. But based on the data, here's a framework you can actually use:
If you're in a tax-advantaged account (IRA, 401k, Roth): Any of quarterly, semi-annual, or annual will give you nearly identical results. Choose based on what fits your workflow. If checking your portfolio quarterly keeps you disciplined, do quarterly. If you'd rather set a yearly calendar reminder and forget about it, do annual. Both are fine.
If you're in a taxable brokerage account: Lean toward annual rebalancing, or consider "threshold rebalancing" (only rebalance when an allocation drifts more than, say, 5% from target). This minimizes taxable events while still controlling drift. Avoid monthly rebalancing in a taxable account — you're paying tax friction on transactions that aren't adding value.
If you contribute regularly (monthly/biweekly deposits): Consider rebalancing through your contributions instead of through sales. When new money comes in, allocate it toward whatever's currently underweight. This is effectively "free" rebalancing — no transaction cost, no tax event. It can delay or eliminate the need for explicit rebalancing sales entirely.
Universal recommendation: Skip monthly rebalancing. In our backtest it was the worst performer on every metric, and once you account for operational friction and (in a taxable account) taxes, the case against it only gets stronger. Unless you have a very specific reason to rebalance that often — and most DIY investors don't — it's the one frequency we'd actively recommend against.
Key Takeaways
- Monthly rebalancing was the clear loser in our 14-year backtest: lowest CAGR (8.61%), deepest drawdown (-26.14%), lowest Sharpe (0.80). Rebalancing drag eats into returns.
- Quarterly, semi-annual, and annual were effectively tied on every metric. The specific frequency is a matter of operational preference, not performance optimization.
- The caveat matters: these results apply to this diversified portfolio over this period. Different portfolios may show different magnitudes, but the directional pattern — more frequent rebalancing isn't better — is consistent with academic research.
- Taxes amplify everything. In a taxable account, less-frequent rebalancing becomes even more attractive because it minimizes taxable events.
- Rebalancing is about risk control, not return enhancement. Its job is to keep your portfolio aligned with your intended risk profile, not to beat the market.
The most counterintuitive lesson here is also the most practical one: if your instinct is to rebalance more often to "stay on top of things," the data suggests that instinct is costing you money. Less really is more — and in this case, the data shows it clearly.
Want to test these insights on your own portfolios?
Awalyt is a portfolio analysis platform: backtesting on daily data, fundamental analysis, asset analysis, and AI-powered insights.
Get Started FreeRelated Insights
Does Rebalancing Actually Improve Returns? We Tested the All Weather Portfolio Over 16 Years [2026]
13 min read
Backtesting a Portfolio: 6 Common Mistakes and How to Avoid Them [2026]
11 min read
Bogleheads 3-Fund Portfolio vs S&P 500: A 14-Year Backtest with Real Data [2026]
14 min read