Is Your Portfolio Actually Diversified?
A short mini-guide: the 2 checks that tell you.
Short answer: owning more ETFs doesn't make you diversified. To know for sure, you check two things: whether your funds hold the same stocks (overlap), and whether they move together (correlation). If a few companies dominate your holdings, or your funds correlate above ~0.9, you're less diversified than the ticker count suggests. Below is how to run both checks, the thresholds that matter, and how to do them in a few minutes with Awalyt.
The 2 checks, in short
- Check 1 — Overlap: what your funds actually hold underneath.
- Check 2 — Correlation: whether those holdings move independently.
You need both. A portfolio can pass one and fail the other.
The portfolio in the examples
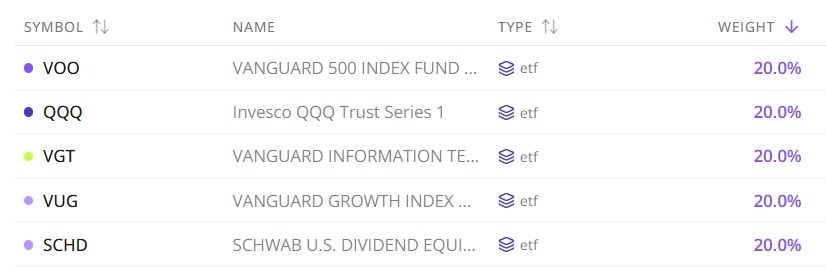
The examples below use one portfolio throughout: VOO, QQQ, VGT, VUG, SCHD, equal weights. Five tickers, US large-cap across growth, tech, and dividends. It looks spread out. It isn't.
Check 1 — Holdings overlap
What you're checking: your real exposure to each company once you see through every fund (look-through exposure), and how much of the portfolio you simply own twice (redundancy).
Why it happens: almost every US large-cap fund weights its holdings by company size, so the same handful of giants floats to the top of all of them. Own four and you own Apple, Nvidia, and Microsoft four times, in slightly different proportions.
The threshold: as a rule of thumb, more than ~50% overlap on a pair of funds means they're duplicating each other, and any single stock above ~8–10% of the portfolio through funds you never picked directly is hidden concentration.
How to check it: for a quick read on any two funds, Awalyt's ETF Overlap Analyzer is free and needs no signup. To see the look-through across your whole portfolio, every fund at once, overlap by holdings and by sector, and your true single-stock weights like the tables below, you run it inside Awalyt with a free account.
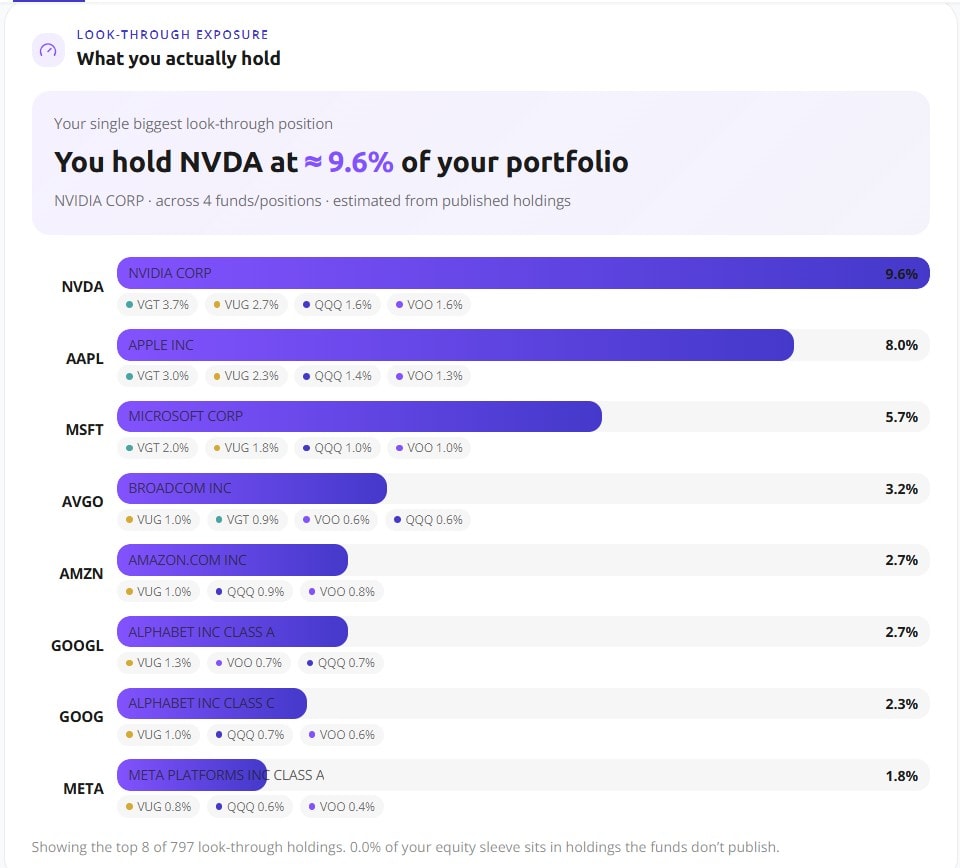
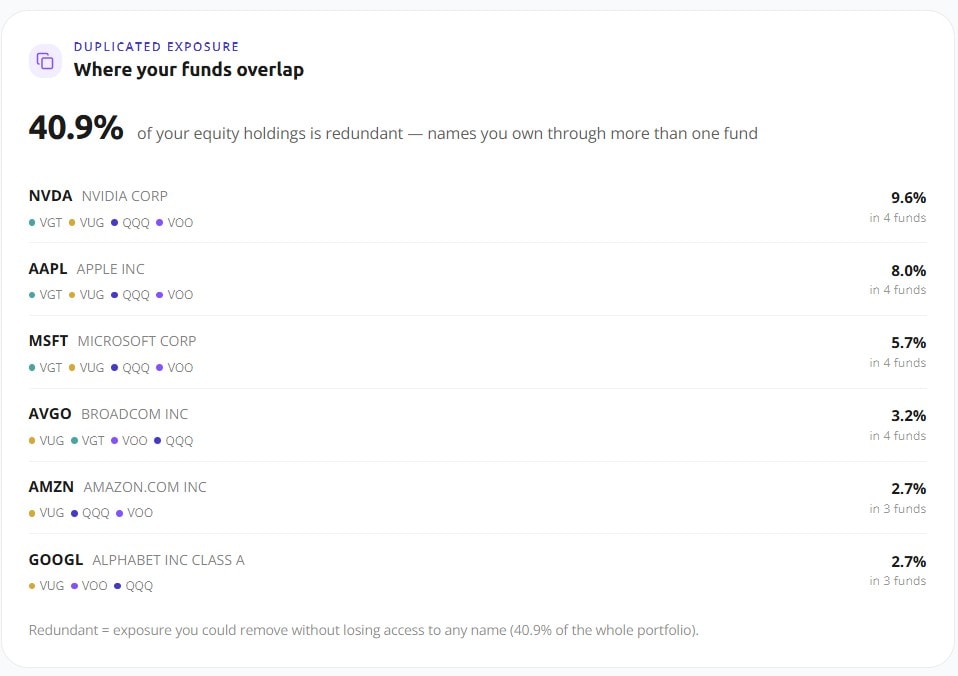
On this portfolio: NVDA shows up at ~9.6% across four funds, and 40.9% of the equity is redundant. Five funds, largely one bet.
See the full look-through on your own portfolio → Start free
Check 2 — Correlation
What you're checking: how your holdings move together, measured pair by pair and over time, not as one lifetime average.
Why overlap isn't enough: two funds can share almost no holdings and still rise and fall as one, because they answer to the same forces, the same rate moves, the same growth expectations, the same fear in the same weeks. Overlap tells you what you own. Correlation tells you whether it all dances to the same music.
The threshold: correlation runs from −1 to +1. Above ~0.9, two funds are effectively the same holding for risk. You want at least one holding well below that, ideally near zero. And read it quarter by quarter, because correlations spike toward 1.0 in a crash.
How to check it: Awalyt's backtest computes the correlation matrix automatically, quarter by quarter, with a plain-language summary.
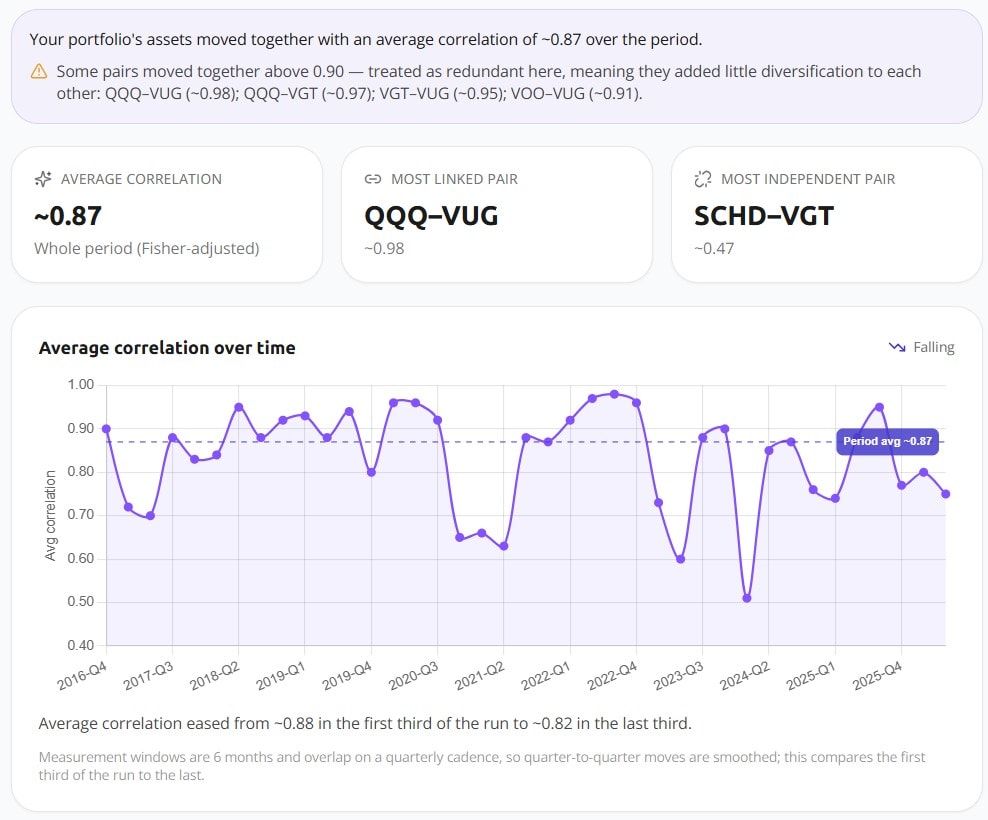
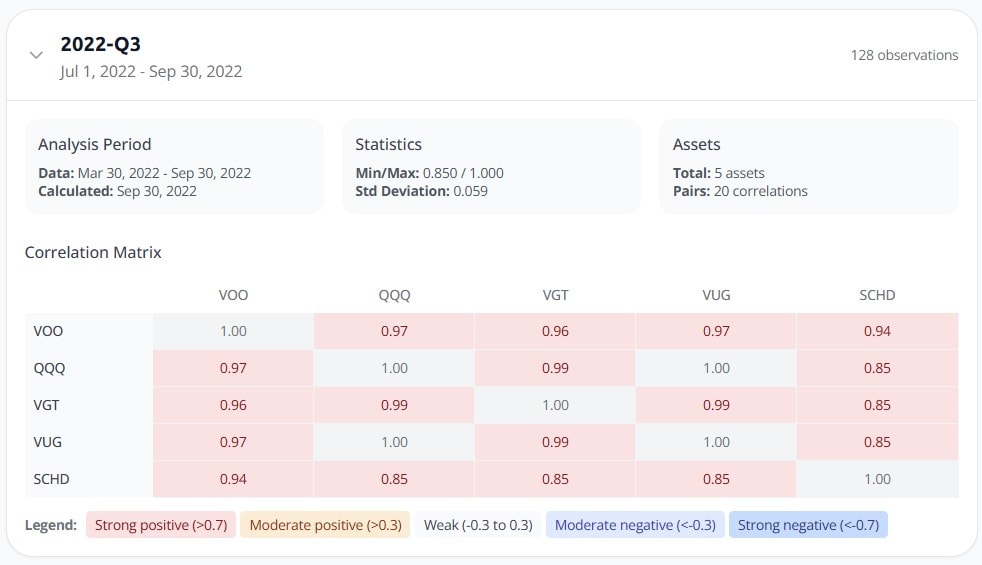
On this portfolio: the five funds averaged 0.87, and in Q3 2022 every pair sat between 0.85 and 1.00. Whatever diversification existed in calm years vanished exactly when it was needed.
How to read the result
A portfolio passes when no single company dominates the look-through table, its largest correlations stay under ~0.9, and its worst year is visibly shallower than the index. Fail both and it shows up in the drawdowns:
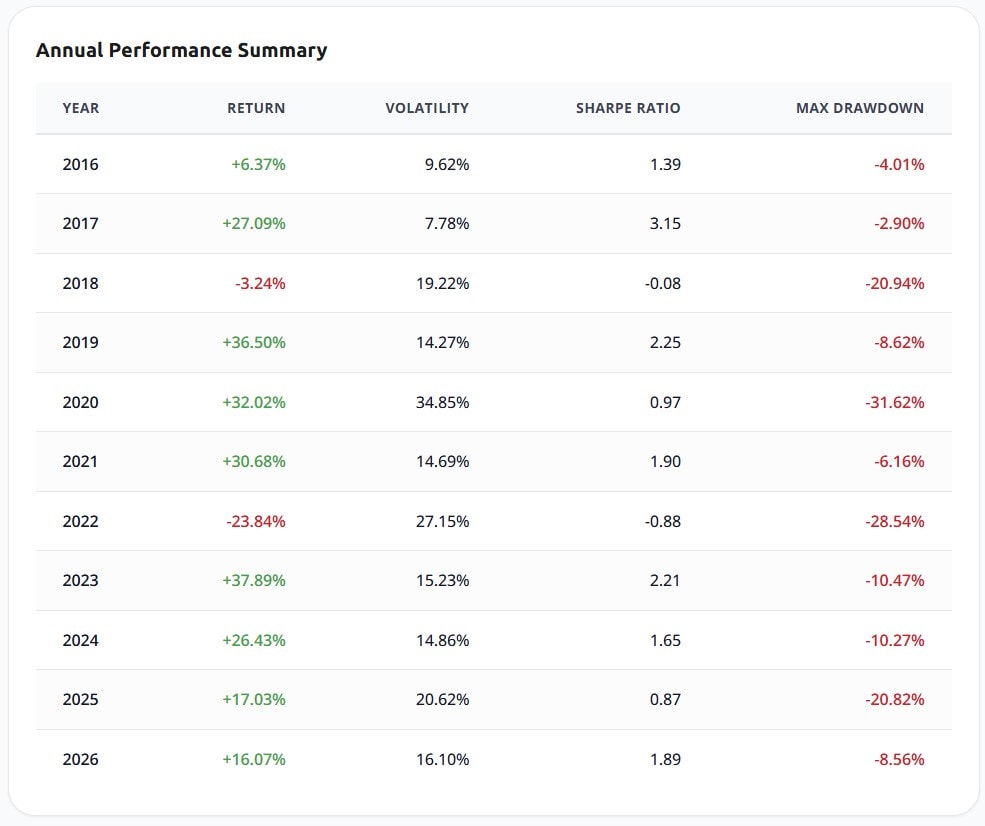
2022: a −28.54% drawdown. 2020: −31.62%. Five funds cushioned neither, because they were the same bet. The fix isn't a sixth equity fund. It's adding something that moves to a different beat, like bonds or gold, whose correlation to stocks sits far below 0.9. That's the difference between adding tickers and adding diversification.
Run both checks on your portfolio
Awalyt runs overlap and correlation on your real holdings in one place, on daily data instead of monthly averages, and free to start. A few minutes and you'll know where you actually stand.
Free plan. No credit card.
FAQ
How many ETFs do I need to be diversified?
It's not about the number. Five overlapping funds are less diversified than three that move differently. Check overlap and correlation, not the ticker count.
Are VOO and QQQ diversified together?
Barely. Roughly 95% of QQQ already sits inside VOO, so holding both mostly doubles your mega-cap tech exposure rather than spreading it.
What correlation counts as diversified?
Below ~0.9 starts to help; the real benefit comes from holdings near zero or negative, like bonds or gold against stocks. Above 0.9, two funds behave as one.
How do I check my own portfolio's diversification?
Two checks: holdings overlap and correlation. Awalyt does both, the ETF Overlap Analyzer for a quick two-fund check, and the backtest plus whole-portfolio look-through inside a free account for the full picture.