How to Check an ETF's Volatility Against the S&P 500
A short mini-guide: the risk number to check first, and the two it hides behind.
Short answer: volatility is the fastest read on an ETF's risk, how much its price swings, in percent per year. To judge it, compare the ETF's annualized volatility to the S&P 500 (~18%): below is calmer, above is wilder. But low volatility alone doesn't mean low risk. A fund can swing less day to day and still crash with the market. The full read is volatility next to max drawdown and correlation. Here's how to check all three, on any ETF and any period, with Awalyt.
The example
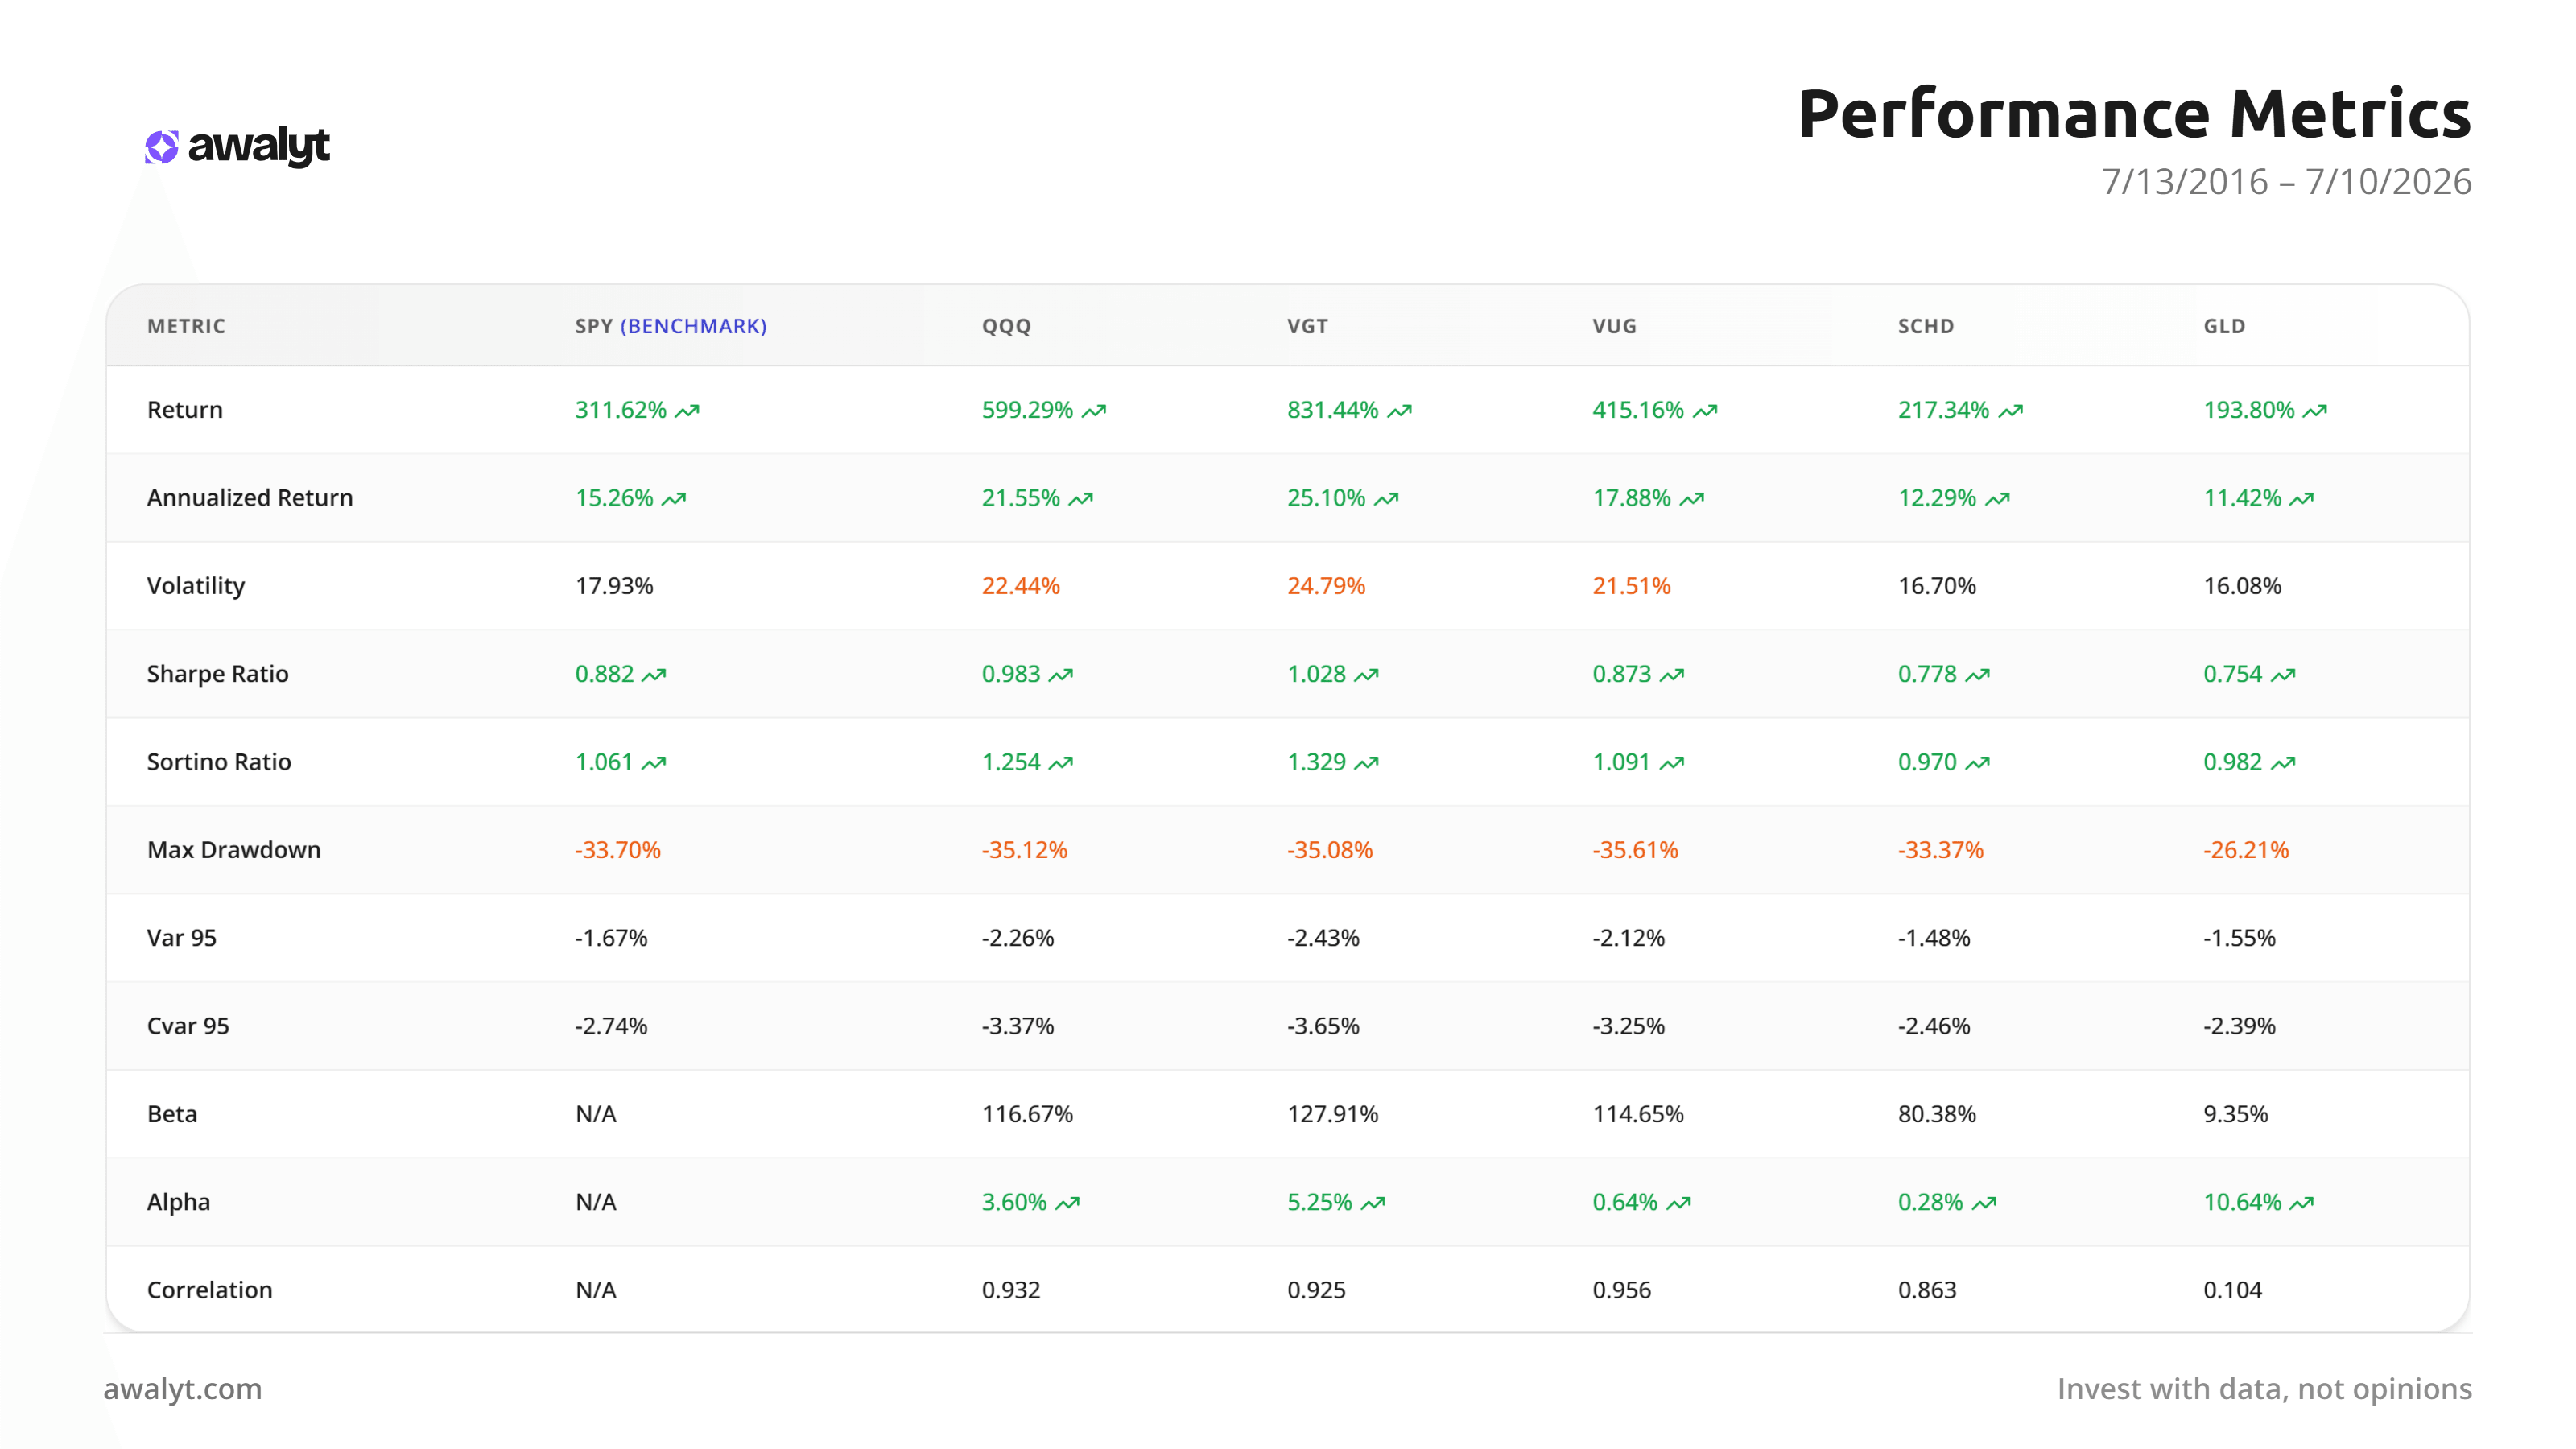
Everything below comes from one Asset Analysis run: QQQ, VGT, VUG, SCHD, and GLD, each measured against SPY over 10 years (2016–2026). One screen, six assets, every risk metric that matters.
Step 1 — Measure volatility against the S&P 500
What you're checking: annualized volatility, how much an ETF's price swings over a year, in %.
Why against SPY: a volatility number alone means nothing without a yardstick. The S&P 500, at ~18%, is the market baseline everything gets read against.
The threshold: below ~18% is calmer than the market; above ~22% is high.
How to check it: Awalyt's Asset Analysis pulls volatility, and every other risk metric, for any ticker on 10+ years of daily data, with SPY as the benchmark.
On this run: GLD (16.08%) and SCHD (16.70%) sit below SPY's 17.93%, while QQQ (22.44%) and VGT (24.79%) run well above. If a calmer ride is the goal, that column is your first filter.
Check any ETF's volatility against the S&P 500 → Start free
Step 2 — Read it over time, next to drawdown
Why over time: volatility isn't constant. It spikes in crashes and settles in bull runs, so a single ten-year number hides the years that actually test you.
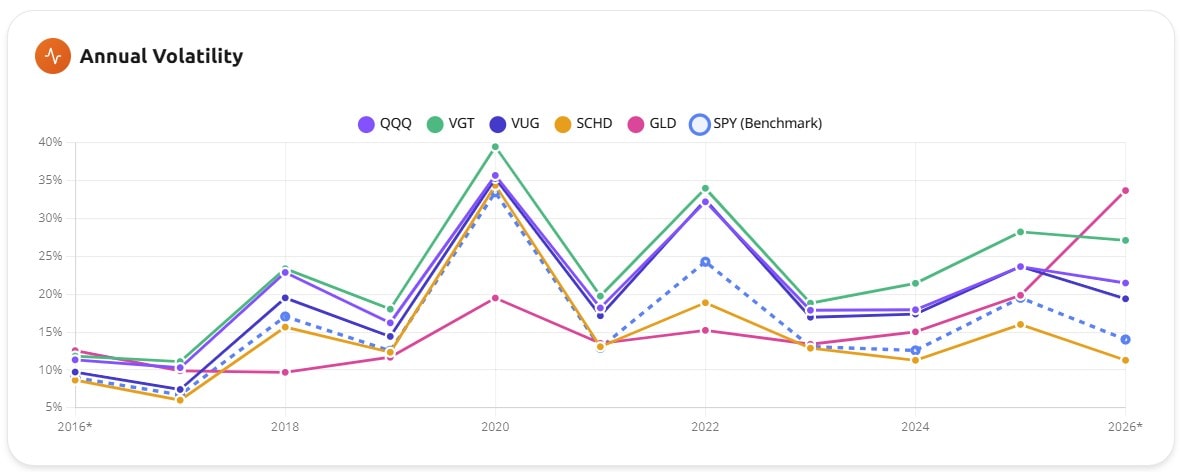
On this run: every equity fund's volatility exploded in 2020 and 2022, while gold stayed calmer through both, then turned jumpy recently. A single average flattens all of that away.
Why next to drawdown: low average volatility is not crash protection. A fund can swing modestly day to day and still fall hard when the market repriced. Read max drawdown alongside it.
On this run: SCHD's volatility (16.70%) is below SPY's, yet it still fell −33.37% at its worst. GLD, with almost the same volatility, fell only −26.21%. Same “low volatility,” very different worst case.
Step 3 — Add correlation: what separates real low-risk from fake
Why: two funds can both look “low volatility” and behave in opposite ways, depending on whether they move with the market or independently of it. Correlation is the number that tells them apart. It runs from −1 to +1, and near 0 means the asset goes its own way.
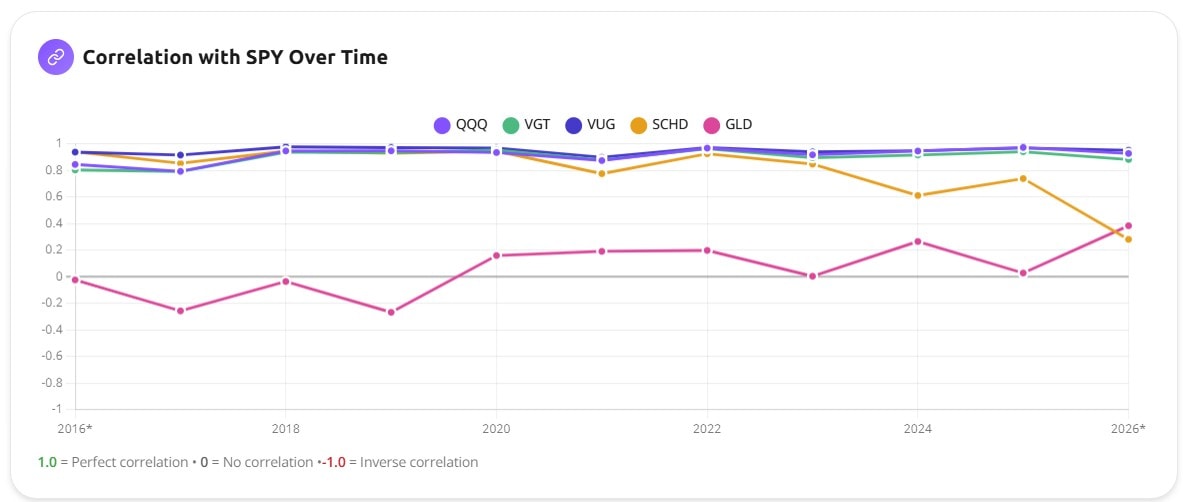
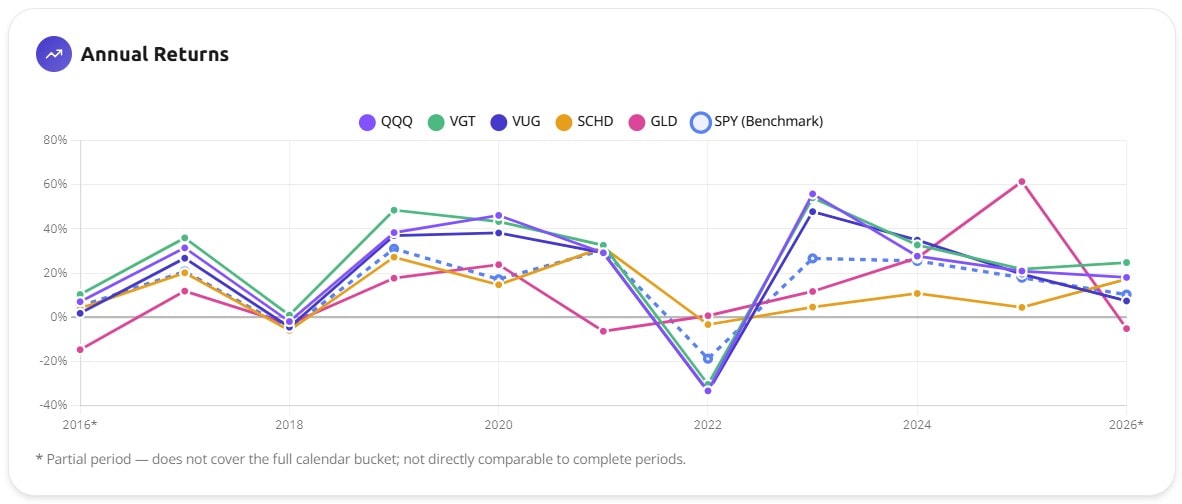
On this run: SCHD correlates 0.86 with the S&P, so its calm is the market's calm and its crash is the market's crash. GLD correlates 0.10, near zero: it barely follows stocks down, and in 2025 it rose while equities fell. Same low-volatility bucket, opposite risk behavior.
That's the point: gold's low volatility actually lowers portfolio risk, because it's decoupled. A low-volatility equity fund usually doesn't, because it still rides the market.
How to read the result
A genuinely lower-risk ETF has volatility below the S&P, a shallower max drawdown, and low correlation to what you already own. Miss the last two and “low volatility” is just a label on the box.
And because Asset Analysis gives you volatility, drawdown, Sharpe, Sortino, beta, alpha, and correlation in one view, on any ETF and any date range, you can run this test in whatever market condition matters to you, not just the flattering years.
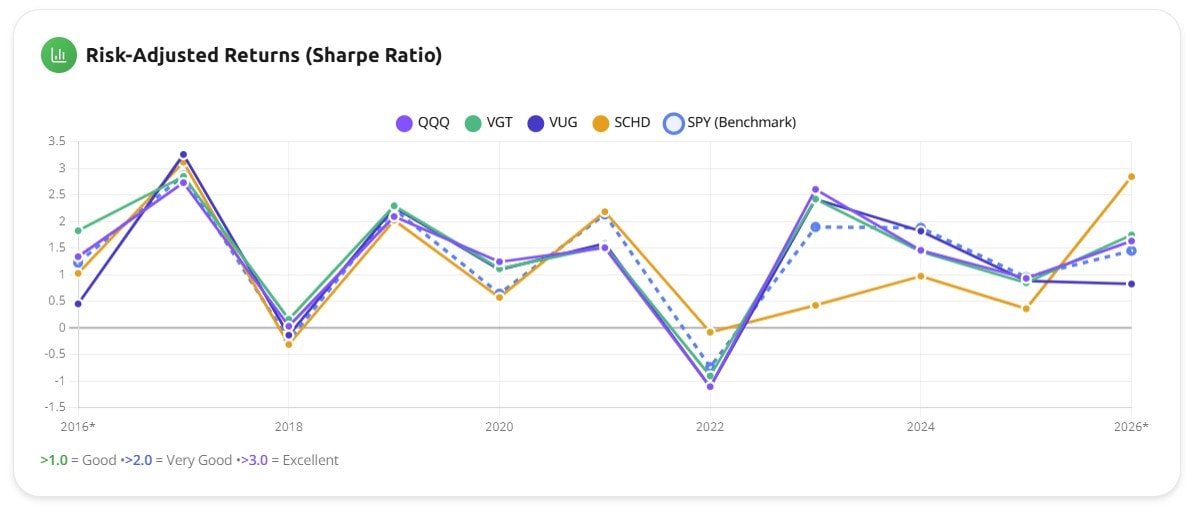
The Sharpe view above closes the loop: it tells you whether the calm was worth it, how much return each fund delivered per unit of risk, year by year.
Run this on any ETF
Pick a ticker, set the period, and Awalyt shows its volatility against the S&P 500 on daily data, plus the drawdown and correlation that tell you what the volatility number leaves out. Free to start.
Free plan. No credit card.
FAQ
What is a good volatility for an ETF?
Judge it against the S&P 500, roughly 18% annualized. Below that is calmer than the market, above ~22% is high. But volatility is a starting point, not a verdict, read it with drawdown and correlation.
Does low volatility mean low risk?
No. A fund can have below-market volatility and still crash with the market if it's highly correlated to it. SCHD, for example, swings less than the S&P yet fell about 33% at its worst because it moves with stocks.
Is gold less volatile than stocks?
Only slightly, on average. What makes gold lower-risk in a portfolio isn't its volatility, it's its near-zero correlation to stocks (~0.10) and its shallower drawdown (−26% vs −33%+ for equity funds). It goes its own way.
How do I measure an ETF's volatility?
Run it through Awalyt's Asset Analysis: it computes annualized volatility on 10+ years of daily data against the S&P 500, alongside max drawdown, correlation, Sharpe, and beta, so you see the full risk picture, not one number.